Model for Predictive Analysis of the Concentration of Dissolved Lead In Relation to the Initial and Final Solution pH during
Leaching of Galena in Butanoic Acid
Chukwuka I. Nwoye1 and Ihuoma Ezichi Mbuka2
1Department of Materials and Metallurgical Engineering, Nnamdi Azikiwe University, Awka, Nigeria.
2Department of Materials and Metallurgical Engineering, Federal University of Technology, Owerri, Nigeria.
chikeyn@yahoo.com, Phone: +234 0806 8006 092
Abstract: A model has been derived for predictive analysis of the concentration of dissolved lead during leaching of galena in butanoic acid solution. The model;
Pb = Antilog exp (γ/α) 0.7407
shows that the concentration of dissolved lead during the leaching process is dependent on the values of the initial and final leaching solution pH. The validity of the model was found to be rooted in the expression (LogPb)N = e(γ/α) where both sides of the expression were correspondingly approximately almost equal. The maximum deviation of the model-predicted concentrations of dissolved lead from the corresponding experimental values is less than 7%
which is quite within the acceptable deviation limit of experimental results. [Academia Arena, 2010;2(6):54-61]
(ISSN 1553-992X).
Key words: Model, Lead Dissolution, Solution pH, Butanoic Acid, Galena Leaching.
1. Introduction
Past report (Okoro,2004) shows feasibility studieson the extraction of lead from Ishiagu lead-zinc ore has been carried out with the view to knowing the possibility of extracting lead from Ishiagu galena using different acid types. The results of the investigation reveal that the weight concentration of lead after leaching with dilute nitric acid, sulphuric acid and aqueous solution of both acids are 39.5% w/w, 14.16% w/w and 15.18% w/w respectively. These results indicate that nitric acid gave the best result of recovery (84.2%), with original lead in the ore being 46.9% w/w.
It has been suggested (Onyemaobi, 1990a) that flotation of sphalerite could be carried out using some imported reagents and fuel oil, using a method of recovery called froth flotation. This method was found to utilize the difference between the physico-chemical surface properties of a mineral. This conclusion followed a researchcarried out by Onyemaobi (1990a) to evaluate the flotation performance of Nigeria’s sphalerite from lead-zinc ore with particular reference to the Ishiagu lead-zinc ore. It has been discovered(Onyemaobi and Anyakwo, 1996) that most lead-zinc ores are fine grained and are concentrated mainly by flotation. The flotation results obtained in this work (Ishiagu ore inclusive) are that the factors affecting flotation includes (1) Degree of oxidation (2) Abundance in nature of iron sulphide and nature of a non-sulphide gangue (Onyemaobi and Anyakwo, 1996). Galena was found
(Onyemaobi, 1990b) to float in slightly alkaline medium (pH9-10) with short-chain xanthates (potassium ethyl xanthates, isopropyl xanthates). In addition to this, it was discovered that at the critical pH of 10.4 when ethyl xanthate is used, usage of lime would make it behave like a depressant(Onyemaobi, 1990b). Investigation on the role of pH on flotation of sphalerite from Ishiagu lead-zinc ore has been carried out (Agha,1990). The result of the investigation reveals that if there are no activator ions in the medium, sphalerite does not float with xanthate and dithiophosphate collector. Activation and flotation of sphalerite in acid medium (pH4-5) is performed with As, Sb, and Pt ions and in neutral conditions (pH 6.8-7.3) Ce, Pb, Cu, Cd, Ag, Hg, B and Au ions became effective(Agha, 1990).
It has been discovered (Olubambi et al.,2007) that during bioleaching of Ishiagu lead-zinc ore, using mixed cultures of Acidithiobacillus Ferrooxidans, Acidithiobacillus Thiooxidans and Leptospirillum Ferrooxidans, higher silica contents of the ore reduce acidity, iron mobility and oxidation. It was also found (Olubambi et al., 2006) during the leaching of zinc and copper out from their respective sulphide ore that the concentrations of zinc and copper formed reduced as particle size decreased while silica, sulphur, iron and lead contents increased. Also leaching rate of copper was found to be lower than zinc. Results of sedimentation analysis carried out by Nwoye (2009) indicate that the average grain size of Ishiagu galena
concentrate is approximately 100µm. The researcher also found that the mechanism of bioleaching of Ishiagu galena concentrates was indirect mechanism. This was sequel to the dominance of Fe3+ ions over H+ during the leaching process. The best operating conditions for the highest yield of Pb were found to be; leaching temperature of not less than 320C, starting pH of leaching solution in the range 1.8 – 2.0, concentration of Fe2+ in the starting leaching solution: 2g/dm3 (0.007M), grain size of ore to be leached: 0.063µm, mixed culture of Acidithiobacillus Ferrooxidans (ATF), Acidithiobacillus Thiooxidans (ATT) and a newly discovered bacteria (CBT). The microorganisms, Acidithiobacillus Ferrooxidans are able to oxidize ferrous ions and the reduced sulphur compounds(Haver and Wong, 1971) while Acidithiobacillus Thiooxidans are able to oxide only reduced sulphur compound summarized by the reaction (Sklodowska, 1990;
Cwalina, 1994).
2Fe2+ + 2H+ + 0.5O2 + bacteria 2 Fe3+ + H2O (1)
It has been found(Williamson, 2005) that the leaching rates of single sulphide minerals decreased in the order pyrite > sphalerite > galena > chalcopyrite, with the rate of pyrite dissolution being of a similar magnitude to the highest values reported previously (Williamson, 2005). The leaching rates of galena, chalcopyrite and sphalerite increased by factors of 31, 18 and 1.5, respectively, in the presence of pyrite, due to its superior catalytic properties. In the galena + pyrite experiment, the concentration of Fe did not increase appreciably
between the first and final sampling times, whilst the Pb concentration did increase significantly. Hence, galvanically promoted dissolution of galena + pyrite decreases the pyrite electrode potential and its dissolution rate. Also in the galena + pyrite experiment, 75% of the total S in solution as measured by ICP –AES was detectable by HPLC, which detects only anionic species; this could be due to the presence of colloidal elemental S (Williamson, 2005). Acid leaching of lead sulphide has been investigated (Prosper, 2005). The results of the investigation indicate that prior to mineral addition, the redox potential of the acid solutions was 360 ± 10mV (SHE). On addition of the mineral powders, the value changed rapidly. In most cases, the redox potential then decreased by a few tens to a hundred or more mV to reach a stable value, except for the single-phase galena + pyrite mixture, for which the redox potential rose continuously throughout the experiment. The ranges of redox potential at pH 2.5 recorded for each single mineral sample are plotted onto the potential pH diagram for the S – H
S2- S0 S2O32- S4O62- SO32- SO42 (2) Researchers(Makita et al., 2004) discovered that arsenic can be reduced in a complex galena concentrate by Acidithiobacillus Ferrooxidans. The results of the investigation reveal that arsenopyrite was totally oxidized. The sum of arsenic remaining in solution and removed by sampling represents from 22 to 33% in weight (yield) of the original content in the mineral.
The rest of the biooxidized arsenic form amorphous compounds that precipitate galena (PbS) was totally oxidized too, anglesite (PbSO4) formed is virtually insoluble and remains in the solids. The influence of seven factors in a batch process was studied. The maximum rate of arsenic dissolution in the concentrate was found using the following levels of factors; small surface area of particle exposure; low pulp density, injecting air and adding the leaching medium to the system. It was also found that ferric chloride and carbon dioxide decreased the arsenic dissolution rate.
Bioleaching kinetic data of arsenic solubilization were used to estimate the dilution rate for a continuous culture. Calculated dilution rates were relatively small (0.88 - 0.103day-1)(Makita et al., 2004).
2O system.
Although the pH of the leach solution was kept constant, the generation or consumption of protons could be determined by monitoring the volume of acid needed to maintain a pH of 2.5. Dissolution of oxidation products formed during grinding of galena produced dissolved Pb(II) and sulphur concentrations significantly higher than in the case of sphalerite leaching. However, concentrations of both species decreased over the first hour of the experiment, probably due to restricted solubility of PbCl2 and PbSO4, the latter phase having a particularly low solubility product Ksp (PbSO4) = 10-7.86.
The equations of the reactions involved are as follows.
(1-y)(PbS + 4Cl- PbCl2-4 + S + 2e-) (3)
y(PbS + 4Cl- + 4H2O PbCl2-4+ SO2-4 + 8H+ +8e-) (4)
Though the dissolved metal to sulphur ratios were not as high as in the case of sphalerite leaching, they increased from 1.3 (y = 0.7) after 19mins to 2.5 (y = 0.4) after 182min. Based on the XPS data, no significant changes in S speciation occur at the surfaces of these minerals as a result of atmospheric oxidation and acid leaching.
Elemental S has been reported(Rawlings, 2005) at the surfaces of both air oxidized and acid-leached galena but no evidence for the presence of elemental S was obtained here possibly due to the sulphur desorption in UHV chamber of the instrument, which had no low – temperature range(Prosper, 2005).
Lead sulphide is rapidly attacked by ferric ion over a wide range of conditions. Soluble lead chlorocomplexes as well as ferric and ferrous chlorocomplexes are formed. It is to be expected after all, that the various metal chlorocomplexes would play an important role in the leaching reaction mechanism.
In addition, it is clear from the result of previous workers that the effect of Fe3+, Cl- and H+ are coupled, and that the reaction kinetics and the mechanism of ferric chloride leaching of PbS have not been clearly established(Dutrizac, 1986). Rapid parabolic kinetics were observed in this study under all conditions and it was shown that the parabolic rate constant was directly proportional to the area of galena being leached. In the presence of ferric ion, the rate was insensitive to HCl concentrations < 3.0M, but increased rapidly at higher acidities because of direct acid attack of the sulphide.
In the absence of ferric ion, the rate increased steadily with increasing HCl concentrations, and linear kinetics was observed. The galena leaching rate increased as (FeCl3) for FeCl3 concentrations in the range 0.01-0.1M, but decreased slightly with increasing FeCl3
concentrations in the range 0.1M to 2.0M FeCl3. The rate was virtually independent of the concentration of the FeCl2 reaction product. The presence of significant amount of the PbCl2 reaction product, however, caused the galena leaching rate to decrease rapidly. A minimum leaching rate was realized in saturated PbCl2 solutions (Dutrizac, 1986). Studies(Dutrizac, 1986) on the ferric chloride brine leaching of galena concentrate have been carried out. The results of the investigation reveal several advantages of ferric chloride over the reagents as a leaching media which includes that it exhibits substantially faster dissolution rates for most sulphides, it is regenerated easily by chlorination of ferrous chloride leaching by-products, and it has greater potential for the treatment of complex sulfides (Dutrizac, 1986). Further studies (Seon-Hyo et al., 1986) on the ferric chloride brine leaching of galena concentrate have been carried with the view to investigating the thermodynamics and kinetics of the process. Seon–Hyo etal. (1986) discovered that under the leaching condition of their work, the distribution of the various metal chloro complexes is relatively insensitive to the extent of PbS dissolution (Seon–Hyo et al., 1986).
Investigations(Dix and Hendrix, 1986) on the Cl2-O2
leaching of galena flotation concentrate have been done with the view to evaluating the kinetics of the process.
The results of this investigation indicate that the rate of gas transfer can be enhanced by increasing the partial pressure of the gas and by using vigorous agitation to increase the surface area of the liquid-gas interface.
Nwoye (2009a) derived a model for predicting the leaching rate of lead during bioleaching of galena using different strains of bacteria such as ATF, ATT and the newly discovered bacteria (CBT and CTT). The model;
not only calculates both the leaching rate and concentration of leached Pb (though indirectly), but also calculates directly the free energy change associated with the leaching process as well as the bacterial leaching index, as the case may be providing that two of the process parameters are known. The pH of the leaching solution during the leaching process can also be calculated using this model.
Ø = e- (ϒ + lnϒ) (5) referred to as pH-model, calculates the leaching rate when the pH of the leaching solution is known at any instant during the leaching process.
Where
γ = pH of the leaching solution at any instant during the leaching process.
Ø= Leaching rate of lead from galena (g/dm3hr-1)
On multiplying both sides of the model by leaching time t, the model then calculates the concentration of Pb leached out as Ө = e-(ϒ + lnϒ)t.
Nwoye (2009a) also derived a model (known as ∆G – model) for predicting the leaching rate of lead relative to the bacterial leaching index and the free energy change associated with the bioleaching process involved.
The model;
Ø = 10(∆G/C) (6)
calculates the leaching rate when the values of the free energy change ∆G, associated with the leaching reaction as well as bacterial leaching index C, are known. This model indicates that the value of the leaching rate and concentration of leached Pb depends largely on the nature and leaching ability of bacteria or bacteria consortium used. It was observed that the greater the value of C, the higher the bacterial leaching ability and tendency. It was also found that the bacterial leaching index of bacillus spp is within the range 2-2.2 while mixed cultures of bacillus spp gave greater value (close to 3) of C than the case of single bacillus spp (Nwoye, 2009a). Based on the fore going, given the values of the leaching rate and the associated free energy change, the specie of the bacteria used can be identified by calculating the value of C, just by re-arranging the model as C = ∆G/log Ø. It was observed that pseudomonas spp. of bacteria have a value of C, less than 1. This value was found to be associated with very poor yield of Pb and leaching rate. Furthermore, on multiplying both sides of the model by the leaching time t, the model then calculates the concentration of leached Pb as Ө = (10(∆G/C) ) t.
Nwoye (2009a) further derived a more comprehensive and precision-enhanced model by jointly associating the pH-model and ∆G-model. The resultant model;
∆G = Log e-(ϒ+Inϒ) C (7)
It has been found (Nwoye,2009a; Pinches, 1975) that the final pH of the leaching solution depend on the leaching time, initial pH for the leaching solution and
the leaching temperature.
Nwoye (2009b) derived a model for predicting the initial solution pH at pre-assumed final pH and concentration of dissolved zinc, during leaching of galena in butanoic acid solution. The model;
γ = Final pH of the butanoic acid leaching solution at α = 1.4γ (8) time t.
Pb = Concentration of dissolved lead during the ln[(Zn)1/3]
shows that the initial pH of the leaching is dependent on the values of the pre-assumed final solution pH and concentration of dissolved zinc. The validity of the model was rooted in the expression eN(γ/α) = 3√Zn where both sides of the expression were approximately equal to 4. The respective deviation of the model-predicted initial solution pH value from that of the corresponding experimental value was less than 2% which is quite within the acceptable deviation limit of experimental results.
The aim of this work is to derive a model for predictive analysis of the concentration of dissolved lead in relation to the initial and final solution pH during leaching of Ishiagu (Nigeria) galena in butanoic acid.
2. Model
During the leaching process, the ore was assumed to be stationary in the reaction vessel and contains the un-leached lead and zinc as part of reaction remnants.
The ore was attacked by hydrogen ions from butanoic acid within the liquid phase, and in the presence of oxygen.
2.1 Model Formulation
Results from experimental work (Nwoye, 2008) carried out at SynchroWell Research Laboratory, Enugu were used for the model derivation. These results are as presented in Table 1.
Computational analysis of these experimental results (Nwoye, 2008) shown in Table 1, resulted to Table 2 which indicate that;
(Log Pb) N = e (γ/α) (approximately) (9)
Introducing the value of N into equation (9)
(Log Pb)1.35 = e (γ/α) (10)
Multiplying the indices of both sides of equation (10) by 1/1.35
The leaching process boundary conditions include:
atmospheric levels of oxygen (considering that the cylinder was open at the top) at both the top and bottom of the ore particles in the gas and liquid phases respectively. A zero gradient was assumed for the liquid scalar at the bottom of the particles and for the gas phase at the top of the particles. The sides of the particles were assumed to be symmetries.
Log Pb= e (γ/α) 0.7407 (11)
Pb= Antilog e (γ/α) 0.7407 (12)
Where
N = 1.35 (Dissolution coefficient of lead in butanoic acid) determined in the experiment (Nwoye, 2008).
α = Initial pH of the butanoic acid leaching solution just before the leaching process started.
leaching process (mg/kg)
Equation (12) is the derived model.
Table1: Variation of the initial and final pH of the butanoic acid leaching solution with the concentration of dissolved lead. (Nwoye, 2008)
(γ) (α) Pb (mg/kg) 3.98
4.25 4.33 4.41 4.50 4.61 4.63 4.72 4.84 4.86
3.80 4.08 4.24 4.36 4.46 4.55 4.60 4.67 4.81 4.83
140.22 138.42 136.22 136.02 135.86 135.04 133.96 133.34 132.82 132.60
3. Boundary and Initial Condition
Iron oxide ore was placed in cylindrical flask 30cm high containing leaching solution of hydrogen peroxide. The leaching solution is non flowing (stationary). Before the start of the leaching process, the flask was assumed to be initially free of attached bacteria and other micro organism. Initially, the effect of oxygen on the process was assumed to be atmospheric. In all cases, weight of iron oxide ore used was 5g. The initial and final pH range of leaching solutions; 3.80 - 4.83 and 3.98 – 4.86 respectively as well as leaching time of 2 hrs (120 minutes) were used for all samples. A constant leaching temperature of 25oC was used. Butanoic acid concentration at 0.23 mol/litre and average ore grain size;150µm were also used. Details of the experimental technique are as presented in the report (Nwoye, 2008).
4. Model Validation
The formulated model was validated by calculating the deviation of the model-predicted initial pH from the
corresponding experimental pH values.
The deviation recorded is believed to be due to the fact that the surface properties of the ore and the physiochemical interactions between the ore and leaching solution which were found to play vital roles during the leaching process (Nwoye, 2008) were not considered during the model formulation. It is expected that introduction of correction factor to the predicted initial pH, gives exactly the experimental initial pH values.
Deviation (Dn) (%) of model-predicted initial pH values from those of the experiment is given by
Dn = PI – EI x 100 (13) EI
Where
PI = Predicted initial pH values EI = Experimental initial pH values
Since correction factor (Cr) is the negative of the deviation,
Cr = - Dn (14) Substituting equation (13) into equation (14) for Dn,
Cr = -100 PI - EI EI (15)
It was observed that addition of the corresponding values of Cr from equation (15) to the model-predicted initial pH gave exactly the corresponding experimental initial pH values (Nwoye, 2008).
5. Results and Discussion
Computational analysis of these experimental results (Nwoye,2008) shown in Table 1, resulted to Table 2.
Table 2: Variation of e(γ/α) with (LogPb)1.35
The derived model is equation (12). An ideal comparison of the concentrations of dissolved Pb as obtained from experiment and as predicted by the model for the purpose of testing the validity of the model is achieved by considering the R2 values (coefficient of determination). The values of the correlation
coefficient, R calculated from the equation;
R = √R2 (16)
using the r-squared values (coefficient of determination) from Figures 1-4 show close correlations between the concentrations of dissolved Pb obtained from experiment (Nwoye,2008): (0.9876) & (0.9821) and derived model:
(0.9129) & (0.8749) relative to initial & final solution pH respectively.
R2 = 0 .9 7 5 3
13 2 13 3 13 4 13 5 13 6 13 7 13 8 13 9 14 0 14 1
3 .7 4 .2 4 .7
In it ia l p H
Figure 1: Effect of initial solution pH on the concentration of lead dissolved (as obtained from experiment (Nwoye, 2008))
R2 = 0 .9 6 4 5
13 2 13 3 13 4 13 5 13 6 13 7 13 8 13 9 14 0 14 1
3 .8 4 .3 4 .8 5 .3
F in a l p H
Figure 2: Effect of final solution pH on the concentration of lead dissolved (as obtained from experiment (Nwoye,2008))
(γ/α) e(γ/α) LogPb (LogPb)1.35 1.0474
1.0417 1.0212 1.0115 1.0090 1.0132 1.0065 1.0107 1.0062 1.0062
2.8502 2.8340 2.7765 2.7497 2.7429 2.7544 2.7360 2.7475 2.7352 2.7352
2.1468 2.1412 2.1342 2.1336 2.1331 2.1305 2.1270 2.1250 2.1233 2.1225
2.8049 2.7950 2.7827 2.7817 2.7808 2.7762 2.7700 2.7665 2.7635 2.7621
R2 = 0 .8 3 3 3
12 0 12 5 13 0 13 5 14 0 14 5 15 0
3 .7 4 .2 4 .7 5 .2
In it ia l p H
Figure 3: Effect of initial solution pH on the concentration of lead dissolved (as predicted by derived model)
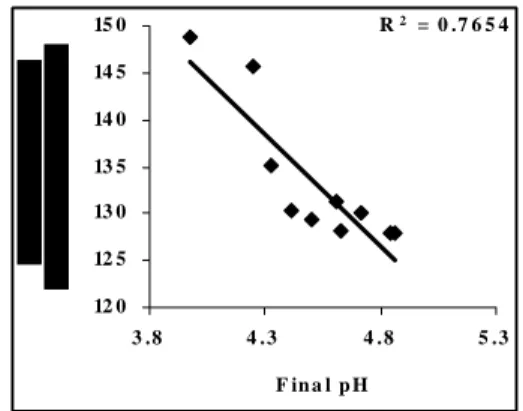
R2 = 0 .7 6 5 4
12 0 12 5 13 0 13 5 14 0 14 5 15 0
3 .8 4 .3 4 .8 5 .3
F in a l p H
Figure 4: Effect of final solution pH on the concentration of lead dissolved (as predicted by derived model)
9 0 10 0 110 12 0 13 0 14 0 15 0 16 0
3 .7 4 .2 4 .7
In it ia l s o lu t io n p H E xD M o D
Figure 5: Comparison of the concentrations of dissolved lead (relative to the initial solution pH) as obtained from experiment (Nwoye,2008) and derived model.
9 0 10 0 110 12 0 13 0 14 0 15 0 16 0
3 .8 4 .3 4 .8
F in a l s o lu t io n p H E xD M o D
Figure 6: Comparison of the concentrations of dissolved lead (relative to the final solution pH) as obtained from experiment (Nwoye, 2008) and derived model.
Figures 5 and 6 also shows very close alignment of the curves from model-predicted values of the concentration of dissolved Pb (MoD) and that from the corresponding experimental values (ExD). The degree of alignment of these curves is indicative of the proximate agreement between both experimental and model-predicted
concentration of dissolved Pb. The validity of the model is believed to be rooted on expression (Log Pb)N = e (γ/α) where both sides of the equation are correspondingly approximately almost equal. Table 2 also agrees with equation (9) following the values of (Log Pb)N and e (γ/α) evaluated following statistical and computational analysis carried out on the experimental results in Table1.
Table 3: Variation model-predicted concentrations of dissolved lead its associated deviation and correction factors
Pb (mg/kg) Dv (%) Cv (%) 148.71
145.61 135.08 130.42 129.26 131.22 128.09 130.04 127.96 127.96
+6.05 +5.19 -0.84 -4.12 -4.86 -2.83 -4.38 -2.47 -3.66 -3.50
-6.05 -5.19 +0.84 +4.12 +4.86 +2.83 +4.38 +2.47 +3.66 +3.50
Table 3 shows insignificant positive and negative deviations of the mode-predicted concentrations of dissolved Pb from the corresponding experimental values. Table 3 also shows that the maximum deviations (from experimental values) of the model-predicted concentration of dissolved Pb are less than 7% which is quite within the acceptable deviation limit of experimental results. The least and highest magnitude of deviation of the model-predicted concentration of dissolved Pb (from the corresponding experimental values) are -0.84% and 6.05% which correspond to initial solution pH 4.24 and 3.8 as well as final solution pH 4.33 and 3.98 respectively. Table 3 indicates that the correction factor to model-predicted concentration of dissolved Pb is opposite that of the deviation values.
This is because correction factor is the negative of the deviation as shown in equations (14) and (15). It is believed that the correction factor takes care of the effects of the surface properties of the ore and the physiochemical interaction between the ore and the leaching solution which (affected experimental results) were not considered during the model formulation.
Based on the foregoing, Table 3 indicates that a correction factor of 0.84 and -6.05% make up for the least and highest deviation of -0.84 and 6.05% resulting from application of initial solution pH 4.24 and 3.8 respectively. It is pertinent to state that the actual deviations are just the modulus of the values. The role of the sign attached to the values is just to show when the deviation is surplus or deficit.
6. Conclusion
The model predicts the concentration of dissolved lead during leaching of Ishiagu (Nigeria) galena in butanoic acid solution. This prediction could be done during the leaching process providing the initial and expectant final pH of the leaching solution are known. The validity of the model is believed to be rooted in the expression (Log
Pb)N = e (γ/α) where both sides of the expression are
correspondingly approximately almost equal. The maximum deviation of the model-predicted concentration of dissolved Pb from that of the corresponding experimental value is less than 7% which is quite within the acceptable deviation limit of experimental results.
Acknowledgement
The authors are grateful to the management of SynchroWell Nig. Ltd. Enugu for funding this work through Grant Agreement No. 23875.
Correspondence to:
Dr. Chukwuka Ikechukwu Nwoye
Department of Materials and Metallurgical Engineering, Nnamdi Azikiwe University P.M.B 5025, Awka, Anambra State, Nigeria.
Cellular phone: +234 0806 800 6092 Email: chikeyn@yahoo.com
Reference:
[1] Okoro CC. Hydrometallurgical Extraction of Lead from Ishiagu Galena, B. Eng. Project Materials and Metallurgical Engineering Dept., Federal University of Technology Owerri. 2004:34-39.
[2]Onyemaobi OO. Evaluation of Flotation
Performance of Nigeria’s Sphalente (ZnS) Without Activation by copper. Ife Journal of Tech. 1990:
2(2):21-25.
[3]Onyemaobi OO, Anyakwo CN. Factors Affecting the Performance of Nigeria’s Lead and Zinc Ores for Industrial Usage JSET, 1996:3(1): 46.
[4]Onyemaobi OO. Flotability of Ishiagu Galena as Raw Materials for Smelters. Nigeria Journal of Applied Science, 1990: 8 (1): 93-101.
[5] Agha UH. Role of PH on Flotation of Sphalerite from Ishiagu Lead-Zinc Ore, Nigeran Journal of Applied Science, 1990: 2(2):4-6.
[6] Olubambi PA, Ndlovu S, Potgieter H, Borode JO. Effects of Ore Mineralogy on the Microbial Leaching of Low Grade Complex Sulphide Ore.
Hydrometallurgy, 2007: 86: 96-104.
[7] Olubami PA, Borode JO, Ndlovu S. Sulphuric Acid Leaching of Zinc and Copper from Nigerian Complex Sulphide Ore in the Presence of Hydrogen Peroxide.
Journal of the Southern African Inst. Of Mining and Metallurgy, 2006:106: 765-769.
[8]Nwoye CI. Ph.D Thesis, Metallurgical and Materials Engineering Department, Federal University of Technology, Owerri. 2009a:
178-190.
[9]Haver FP, Wong MM. Recovering Elemental Sulfur from Non-Ferrous Minerals. Rep.Invest. U.S Bur.
Mines 7474,20,1971, in Orlowska L and Golab B;
Microbial Leaching of Blende Flotation
Concentrate using Acidithiobacillus Ferrooxidans and Acidithiobacillus Thiooxidans,
Physicochemical Problems of Mineral Processing.1990: 37:58-60.
[10]Sklodowska R. Microbial Leaching of Blende Flotation Concentrate using Acidithiobacillus Ferrooxidans and Acidithiobacillus Thiooxidans;
Physico Chemical Problems of Mineral Processing, 1990:32:40-56.
[11]Cwalina W. Microbial Leaching of Blende Flotation Concentrate using Acidithiobacillus Ferrooxidans and Acidthiobacillus Thiooxidans Physicochemical Problems of Mineral Processing, 1994:25:51-67.
[12]Makita M, Esperon M, Pereyra B, Lopez A, Orrantia E. Reduction of Arsenic Content in a Complex Galena Concentrate by Acidithiobacillus Ferrooxidans; BioMed Central Biotechnology, 4:22 doi: 10.1186/1472-6750-6750-4-22, 2004.
(published on line)
[13]Williamson S, Rimstidt M, Smith T, Schumate H.
Rates of Leaching in Single and Two Phase System. Min. mag.,2005: 3-12.
[14]Prosper I. Acid leaching of lead sulphide, J. Med.
Central, 2005:3(4):13-16.
[15]Rawlings DE. Characteristics and Adaptability of Iron and Sulphur Oxidizing Microorganisms Used for the Recovery of Metals from Minerals and Their Concentrates, Bio Med Central, 4:13 doi 10:1186/1475-2859-4-13, 2005 (published on line).
[16]Dutrizac JE. The Dissolution of Galena in Ferric Chloride Media, Metallurgical Transactions B, 1986:17B: 77-83.
[17]Seon-Hyo KK, Henein H, Warren GW. An Investigation of the Thermodynamics and Kinetics of the Ferric Chloride Brine Leaching of Galena Concentrate. Metallurgical
Transaction B, 1986:17B:26.
[18]Dix RB, Hendrix JL. Kinetics of Cl2-O2 Leaching of Lead–Zinc Flotation Concentrates. University of Nevada Reno, 89557, 1986.
[19]Pinches A. Bacterial Leaching of an Arsenic Bearing Sulphide Concentrate. The Institute of Mining and Metallurgy, England, 1975: 34-39.
[20] Nwoye CI. Model for Predicting the Initial
Solution pH at Pre-Assumed Final pH and Concentration of Dissolved Zinc during Leaching of Galena in Butanoic Acid Solution,
J. Min. Mat. Charact., & Eng., 2009b:8(8), 621-633.
[21] Nwoye CI. SynchroWell Research Work Report, DFM Unit, No 2008600, 2008: 15-21.
.
23/3/2010