SPECIAL ISSUE ON UNDERSTANDING THE EFFECTS OF OFFSHORE WIND ENERGY DEVELOPMENT ON FISHERIES
Effects of the Block Island Wind Farm on Coastal Resources LESSONS LEARNED
By Drew A. Carey, Dara H. Wilber, Lorraine B. Read, Marisa L. Guarinello, Matthew Griffin, and Steven Sabo
INTRODUCTION
The Block Island Wind Farm (BIWF) offers the first opportunity to assess the effects of offshore wind (OSW) develop- ment on coastal resources in the north- eastern United States. “America’s First Offshore Wind Farm” was constructed in 2015 and 2016 after an extensive sci- entific data-gathering and stakeholder vetting process (RICRMC, 2010). The pilot-scale project consists of five 6 MW turbines located within the state waters of Rhode Island 5.3 km from Block Island.
The turbines are within sight of commu- nities that depend on tourism and recre- ational fishing (H. Smith et al., 2018) and that rely upon the project for electricity and grid connection (Russell et al., 2020).
The BIWF is located close to rock reefs and intertidal habitats in an area with rel- atively low commercial fishing pressure (RICRMC, 2010). This unique juxtapo- sition of scale, location, resources, and user interests influenced the design of the studies described here ( Figure 1 ).
The site selection and permitting pro- cess for the BIWF raised important ques-
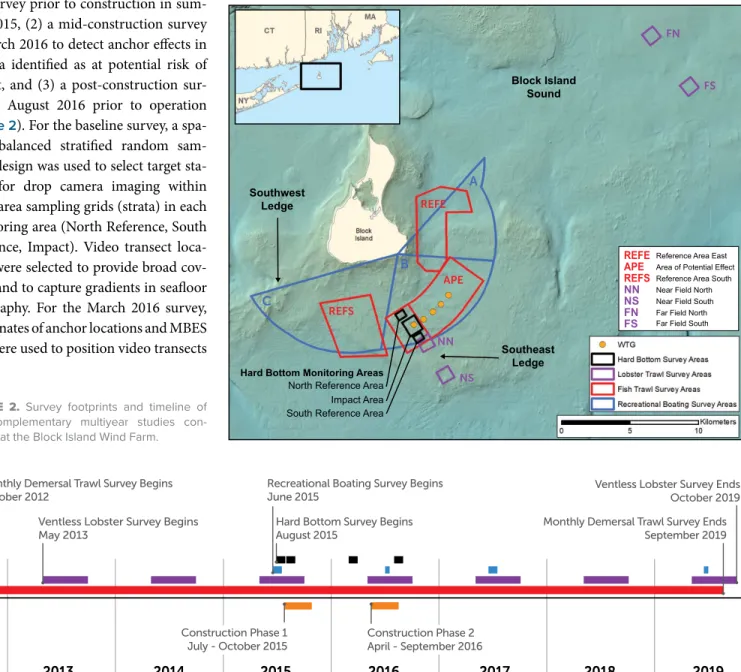
tions about the potential effects of OSW construction and operation on a wide variety of marine resources (RICRMC, 2010). The four study designs summa- rized here were required by the lease agreement, vetted by stakeholders and scientists, and represented the first opportunity to evaluate fish and fisher- ies resources at an operating OSW proj- ect in the United States. Each study col- lected data on multiple parameters and compared effects of the project to refer- ence areas prior to construction, during construction, and post-construction. A timeline illustrates the overlap between construction events and each of the four studies ( Figure 2 ). Detailed results of these studies are presented in a series of technical reports and publications (Guarinello et al., 2017; Guarinello and Carey, 2020; Sabo et al., 2020; Wilber et al., 2020a,b), with more forthcoming.
Here, we critically examine study designs to identify lessons learned from assess- ment of potential effects of the pilot-scale BIWF on multiple resources and stake- holders. These lessons can be applied to planning and monitoring larger-scale OSW farms proposed for the northeast- ern United States.
Principles of study design included consultation with commercial and recre-
ational users, adaptive monitoring based on data and stakeholder feedback, and cooperative research with commercial fishermen. Sampling was based on meth- ods consistent with regional surveys (e.g., ASMFC, 2015; Bonzek et al., 2017) and included data on multiple metrics to evaluate fish and fisheries resources.
Statistical considerations included strat- ified random sampling within a before- after- control- impact (BACI) design, using customized linear contrasts (e.g., Chevalier et al., 2019; Schad et al., 2020) and power analysis (when possi- ble) to determine sample size.
Sampling designs were developed through an iterative collaborative pro- cess with state and federal regulators and stakeholders (commercial and recre- ational fishing and user groups) and direct meetings with local fishermen. Over 20 meetings of these groups and 15 meet- ings with fishermen resulted in a coop- erative research design where fishermen identified suitable sampling locations, conducted the sampling with onboard scientists, and engaged in the inter- pretation of data. For each study, sam- pling began before construction in refer- ence and potential-effect areas defined by their proximity to the planned installa- tion area. The locations and sizes of these areas were scaled to the sampling method and expected effects; hence, they are dis- tinctly named for each study ( Table 1 ; Figure 2 ). Hard bottom habitat (HBH) surveys of limited duration were con- ducted during three sampling periods over 15 months, with planned sampling at three and five years post-construction canceled with approval of state and fed- eral regulatory agencies based on initial post- construction results. These surveys focused on HBH adjacent to the south- ern end of the wind farm using stratified random sampling, with post- construction locations adaptively added based on results of multi beam echosounder (MBES) mapping. Demersal trawl sur- veys began two years and eight months before construction, with monthly data collected from randomized trawl lines ABSTRACT. The Block Island Wind Farm, the first offshore wind farm in the United
States, attracted intense interest and speculation about the effects of construction and operation on valuable coastal resources. Four studies designed to address the ques- tions raised were conducted over seven years as a requirement of the lease agreement between the State of Rhode Island and the developer, Deepwater Wind Block Island.
The objectives of the studies were to separate the effects of construction and operation on hard bottom habitats, demersal fish, lobster and crabs, and recreational boating from regional changes in conditions. Study elements included: early engagement with stake- holders (fishermen and boaters), adaptive monitoring based on data and stakeholder feedback, cooperative research with commercial fishermen, use of methods consistent with regional surveys, stratified random sampling within a before-after-control-impact (BACI) design, power analysis (when possible) to determine sample size, and multiple metrics to evaluate fish and fisheries resources. This combination of studies and ana- lytical approaches evaluated multiple mechanisms by which potential effects could be detected. Lessons learned included practical guidance, for example, for collaborating with stakeholders and regional scientists to address concerns through adaptive mon- itoring, quantifying uncertainty associated with BACI contrasts, and evaluating the duration of a seasonal lobster survey. Applying these lessons can improve monitoring at proposed larger-scale offshore wind projects in the United States.
FACING PAGE. The INSPIRE team conducts
demersal-trawl cooperative research aboard
F/V Virginia Marise at the Block Island Wind
Farm. Photo credit: Steven Sabo
for seven years in three areas identified as suitable by commercial trawlers. Ventless lobster trap surveys began two years and two months before construction, with bimonthly data collected for seven years, in two locations with two areas each, which were identified by commercial lobstermen. Each year, trawl locations were randomly selected and revisited every two weeks May through October.
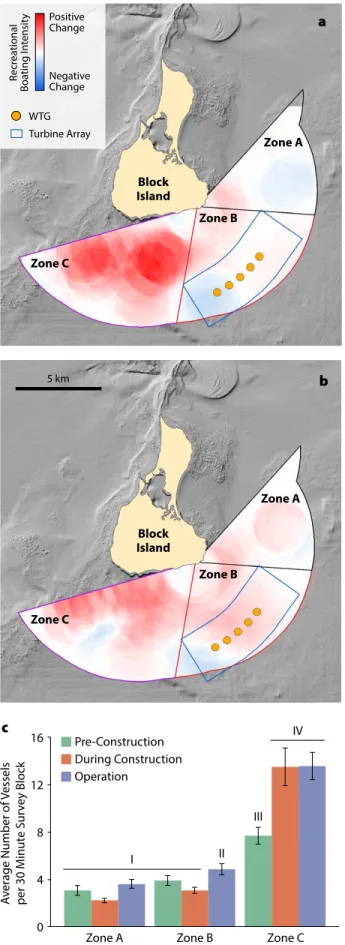
Week-long recreational boating surveys that focused on identifying the locations of fishing activity began one month before construction and continued across four years. They were timed around one or two of the busiest recreational boating week- ends each year, with data collected from three contiguous marine areas visible to a
single observer on Block Island.
BACI study designs offer a powerful tool for detecting environmental impacts because they account for both temporal and spatial changes (Underwood, 1992;
E. Smith et al., 1993; Stewart-Oaten and Bence, 2001). Natural spatial heterogene- ity was acknowledged early in the design process and ameliorated by the inclusion of two reference areas for each survey.
Sampling frequency was designed for each survey, tailored to provide the sam- pling intensity needed for examining potential impacts not only of wind farm operation but also of construction peri- ods that included turbine installation and cable placement (Lindeboom et al., 2015;
Dannheim et al., 2020).
HARD BOTTOM HABITAT
Physically complex and limited in distri- bution in Rhode Island Sound (RICRMC, 2010), HBH is critical for ecologically and economically important taxa such as American lobster (Wahle and Steneck, 1991), juvenile Atlantic cod (Gotceitas and Brown, 1993), and longfin squid (Griswold and Prezioso, 1981). Because these habitats provide stability and phys- ical complexity, they are a focal point for regulatory conservation and mit- igation, but prior to BIWF, few OSW farms have been located within 1 km of HBH (e.g., Wihelmsson and Malm, 2008; Roach et al., 2018). The BIWF was sited to avoid construction directly in HBH, although one turbine was located
FIGURE 1. The first offshore wind farm in the United States, Block Island Wind Farm (BIWF) is unique in scale with five turbines 830 m apart. It is located
near an island adjacent to natural reefs, an area where there is heavy recreational fishing use. Four studies related to fish and fisheries resources
yielded important lessons on scale and duration for future monitoring efforts. WTG = wind turbine generator.
close to HBH ( Figure 2 ; HDR, 2018).
Because HBH is present in several pro- posed US OSW areas, monitoring effects of construction within these habitats is important for potential mitigation of OSW development. Baseline, mid-, and post- construction surveys were designed to develop methodologies for assessing the abiotic and biotic features and distri- bution of HBH and OSW construction effects on these habitats (Guarinello and Carey, 2020) and to detect and evaluate disturbance and recovery from anchoring activity conducted proximal to these hab- itats (Guarinello et al., 2017).
HBH Sampling Design
Three surveys were conducted: (1) a base- line survey prior to construction in sum- mer 2015, (2) a mid- construction survey in March 2016 to detect anchor effects in an area identified as at potential risk of impact, and (3) a post- construction sur- vey in August 2016 prior to operation ( Figure 2 ). For the baseline survey, a spa- tially balanced stratified random sam- pling design was used to select target sta- tions for drop camera imaging within equal-area sampling grids (strata) in each monitoring area (North Reference, South Reference, Impact). Video transect loca- tions were selected to provide broad cov- erage and to capture gradients in seafloor topography. For the March 2016 survey, coordinates of anchor locations and MBES data were used to position video transects
and drop camera stations. The August 2016 post-construction survey deter- mined if disturbance features identified in the March 2016 survey recovered and compared reference areas to the Impact Area. Video and drop camera survey loca- tions were modified in real time to col- lect data at disturbance features detected in MBES data.
HBH Analytical Methods
Habitat data were evaluated using the Coastal and Marine Ecological Classification Standard (CMECS) rec- ommended by federal regulators (FGDC, 2012), with modifications to reflect
inferred physical stability (Guarinello and Carey, 2020). In addition to our study, a separate project recorded visual obser- vations of construction activities during each phase of the project, and MBES mon- itoring was conducted on disturbance fea- tures from anchors and jackup barges in soft sediments at six-month intervals from May 2016 to May 2017 to document physical recovery (HDR, 2018).
Lessons Learned from HBH Sampling Design
The study design used several approaches to capture physical and biological recov- ery from habitat disturbance, includ-
FIGURE 2. Survey footprints and timeline of
four complementary multiyear studies con-
ducted at the Block Island Wind Farm.
ing MBES time-series mapping and randomized analysis of biotic cover of disturbed soft bottom habitats as well as non-random MBES mapping of post- construction conditions with directed high-resolution imagery of disturbed and undisturbed features. By adaptively mon- itoring (i.e., directing video and camera locations to disturbed habitat identified by MBES), the probability of character- izing recovery was increased compared to the use of as-built anchor locations or random sampling. The rate of physi- cal seafloor recovery in mobile sand sedi- ments (surface returning to baseline con- ditions) can be related to seabed mobility, with areas of higher seafloor energy with finer sand recovering more quickly (K. Smith and McNeilan, 2011; HDR, 2018). However, biological recovery of HBH may be inversely related to seabed mobility (Wilhelmsson and Malm, 2008).
Two studies evaluated recovery of the
seafloor from physical disturbance that resulted in distinct furrows due to anchor drag (HDR, 2018; Guarinello and Carey, 2020). Some furrows (drag marks) were unchanged in MBES signature over time due to the presence of boulders lining the furrows ( Figure 3 ). Biological growth on the boulders returned in less than a year, with mean percent cover increasing from 10% to 62% in August 2016 com- pared to March 2016 (Guarinello et al., 2017). MBES surveys in October 2016 and May 2017 noted that 32% of the drag marks created in soft sediment with- out boulders in 2015 had fully recovered physically by May 2017 (HDR, 2018). Use of multiple survey approaches revealed the clear contrast in the response of mobile habitats to construction distur- bance (return to baseline profile) com- pared to relocated boulders (return to baseline biological cover, but similar physical profile).
Modification of CMECS to include physical habitat stability proved a useful tool for interpreting video data, and com- bining this approach with adaptive sam- pling could be an effective methodology for studies of hard bottom effects at other OSW projects that involve relocated boulders (Guarinello and Carey, 2020).
DEMERSAL FISH
Stakeholder feedback from the permit- ting process identified potential effects on demersal fish, lobster, and sport fish as primary concerns (RICRMC, 2010). The demersal trawl surveys were designed in conjunction with ventless trap surveys (see below) to measure how the fish and invertebrate community near the BIWF was affected by construction and opera- tion. The study area had limited scientific fish sampling data from regional surveys so the usage of the site by fish was poorly known (RICRMC, 2010).
TABLE 1. Sampling protocols for the hard bottom habitat, demersal trawl, ventless lobster trap, and recreational fishing studies conducted for the Block Island Wind Farm. REFE = Reference Area East. REFS = Reference Area South. NN = Near Field North. NS = Near Field South. FN = Far Field North.
FS = Far Field South.
SURVEY TYPE
IMPACT (I) AND REFERENCE (R)
AREA TERMINOLOGY
SAMPLING PROTOCOL REPLICATION WITHIN EACH
AREA
TOTAL NUMBER OF
SAMPLES PARAMETERS
ANALYZED
Hard Bottom Habitat
• I: Impact Area
• R: North and South Reference Areas
• Pre-construction in reference and impact areas (summer 2015)
• Mid-construction to detect anchor features in impact area (March 2016)
• Post-construction in reference and impact areas (summer 2016)
• Three drop camera images per station
• 2 km
2area of
bathymetry, backscatter, side-scan sonar
• 47 towed video transects (ranging from 54 to 1,049 m in length)
• 130 drop camera stations
• 30 single image stations at anchor features
• Classifiers from the CMECS substrate and biotic components
Demersal Trawl
• I: Area of Potential Effect (APE)
• R: REFE and REFS
• Monthly, October 2012–
September 2019
• Two random trawls per month
• 497 trawls
• Fish and invertebrate catch rates and sizes
• Fish condition
• Fish diet composition
• Fish stomach fullness
Ventless Lobster Trap
• I: Near Field (areas NN and NS)
• R: Far Field (areas FN and FS)
• Twice monthly, May to
October, 2013–2019 • Six fixed trawls
per year • 1,718 trawls (10,251 traps)
• Lobster catch rates and sizes
• Ovigery rates
• Shell disease
• Cull status
• Bycatch rates and sizes
Recreational
Fishing • I: Zone B
• R: Zones A and C
Week-long surveys conducted:
• Pre-construction (June and July 2015)
• Mid-construction (July 2016)
• Operation (June and July 2017, June 2019)
• Four 30-minute survey blocks, three times a day for one week
324 total survey blocks:
• Pre (n = 132)
• Mid (n = 60)
• Operation (n = 132)
• Vessel counts, activity,
and location
Trawl Sampling Design
Baseline, construction, and operational sampling with a demersal otter trawl occurred monthly over seven years near the wind farm in an area of potential effect (APE) and in two nearby refer- ence areas (REFE and REFS; Figure 2 ).
Habitat characteristics (depth and sub- strate composition) were similar in all areas. Gear and sampling protocols con- sistent with those used by the long- term, biannual demersal trawl survey in Rhode Island Sound (Bonzek et al., 2017) allowed comparison with historical data and broadened the spatial context of the study. Cooperative research using a com- mercial fishing vessel, captain, and crew, with scientists onboard to process the catch, promoted communication with the local fishing community that facili- tated adaptive monitoring in response to fishermen’s concerns.
Fish populations naturally exhibit large variability in abundance, which can weaken even a robust BACI approach to assessing wind farm impacts based on catch statistics alone (Lindeboom et al., 2015; Methratta, 2020). Recreational fishermen were concerned about lack of information regarding effects on prey species. Therefore, additional metrics (fish condition, stomach fullness, and prey composition) were included for flounders, hakes, and cod. An example of adaptive monitoring was the inclusion of black sea bass in the diet study compo- nent during the seventh year of sampling in response to an industry concern that juvenile lobsters were being consumed by these fish. Select preliminary demer- sal trawl results for the first six years are provided here to illustrate lessons learned from this study (data processing for the seventh year is ongoing).
Trawl Analytical Methods
Statistical methods focused on estimat- ing the 95% confidence intervals (95CI) around measures of change described by pre-specified contrasts. BACI inter- action contrasts described the spatial dif- ferences (APE versus each reference area)
in mean abundance between the baseline and operation time periods. A similar interaction contrast was used to describe the spatial differences in mean abun- dance between baseline and the two con- struction periods. Catch data (average monthly catch per trawl) were modeled in R (R Core Team, 2019) as a function of area and year with negative binomial gen- eralized linear models (GLMs) with a log- link. Monte Carlo confidence intervals were constructed for the contrasts using 5,000 draws from the multivariate distri- bution of model coefficients. Diet compo- sition data, stomach fullness indices, and fish condition indices calculated from length-weight regressions were graphed to depict spatial and temporal changes, and analyses of variance (ANOVAs) were conducted when sufficient data were available. Multivariate analysis included spatial and temporal comparisons of fish and invertebrate community composi- tion and prey assemblage composition using non-metric multidimensional scal- ing (nMDS) and analysis of similarities (ANOSIM) based on the Bray-Curtis dis- tance metric (Clarke et al., 2014).
Lessons Learned from Trawl Sampling Design
Multiple metrics (catch rates, assemblage composition, condition, diet composi- tion, and stomach fullness) were useful
to assess potential wind farm effects and provided a more complete understand- ing of how turbine foundations function as shelter and colonization resources.
For instance, although spatial and tem- poral differences in abundances were evident, results for the interaction con- trasts of the catch rate models often did not reflect an impact statistically differ- ent from zero (i.e., where 95CIs excluded zero). As an example, the longfin squid BACI contrast between APE and REFE had an expected 82 fewer squid per tow (0.003 fewer squid per m
2) during the operation period compared to the base- line time period with 95CI [–341, 109].
The width of this statistically nonsignif- icant confidence interval illustrates how the inherently large variance in catch data results in low statistical power for anything but large effect sizes. Notably, this survey collected 53,860 squid using 426 trawls over six years. Longfin squid distributions also provide a good example of a species with consistent spatial trends in catch throughout the study, with con- sistently higher abundances at the REFE than in the APE or REFS ( Figure 4 ).
In contrast, black sea bass abundances dramatically increased (over 1,200%) between baseline and operation periods at the APE, while changes at the refer- ence areas were more modest ( Figure 4 ).
However, the interaction contrasts were
FIGURE 3. Anchor furrow imaged by towed video during the March 2016 post-construction survey.
not statistically significant for either REFE (95CI of –328, 21) or REFS (95CI of –338, 5), demonstrating the impor- tance of not relying solely on statistical outcomes when evaluating potential wind farm effects. Black sea bass is a structure- seeking species that prefers complex bot- tom habitat, as provided by the turbine foundations (Guida et al., 2017).
The preliminary BACI analyses com- paring two years of the baseline period to two years of wind farm operation revealed the value of two reference areas and comparable regional studies that pro- vided context. For instance, conclusions varied in some cases depending on the reference area used for comparison. Most commonly, similar changes in abundance occurred at both the APE and at least one reference area between the baseline and operation periods. In other cases, con- sistent results suggested a regional trend, such as declining abundances of Atlantic herring, alewife, and butterfish in all areas over six years and in regional sur- veys (Wilber et al., 2020a). Use of a single reference area in future studies may not
adequately account for the role of spatial variability for a highly stochastic metric such as fish and invertebrate catches.
Diet composition was an import- ant aspect of survey design, provid- ing a window into wind farm effects on trophic relationships of importance to user groups. Lobsters were not found in the stomachs of black sea bass, although crabs were a common prey item for them.
Ten times more winter flounder had blue mussels in their diets during the opera- tion period, coinciding with the concen- tration of blue mussels, an early colonizer of the turbine foundations (HDR, 2020), in relatively large numbers in the APE and the REFS (Wilber et al., 2020a).
Because the timing and scale of con- struction and operation were unknown during study design, the BACI design with continuous monthly sampling for the study duration was crucial. Monthly abundance data during the discontinuous construction phases were compared to baseline data and regional data from the same months. The short time periods for the construction activities limited statis-
tical power for the interaction contrasts on some of the additional metrics; there- fore, analyses included graphical compar- isons of stomach fullness indices and prey composition in the diets of focal preda- tors among areas. Depictions of spatial and temporal trends in these metrics can inform assessment of potential construc- tion effects; thus, the inclusion of these metrics in future monitoring of other OSW projects should be considered.
LOBSTERS AND CRABS Ventless Trap Sampling Design Ventless trap surveys were conducted twice per month during lobster season (May to October) over seven years, end- ing in October 2019 ( Table 1 ). Preliminary survey results are provided here to illus- trate lessons learned and are based on the first six years of the study; data pro- cessing for the seventh year is ongoing.
Sampling was conducted in two potential impact areas near the wind farm, Near Field North (NN) and Near Field South (NS), and two reference areas approxi- mately 22 km distant from the wind farm,
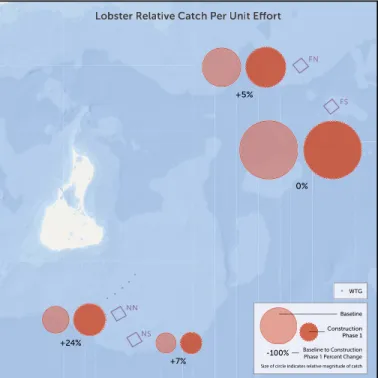
Size of circle indicates relative magnitude of catchSize of circle indicates relative magnitude of catch Size of circle indicates relative magnitude of catchSize of circle indicates relative magnitude of catch
FIGURE 4. Relative catches of longfin squid and black sea bass in the demersal trawl survey for the baseline and turbine operation periods in the area
of potential effect (APE) and reference areas (REFE and REFS). Circle size indicates relative magnitude of average catch; percentages indicate the
changes between baseline and turbine operation periods for each area.
Far Field North (FN) and Far Field South (FS) ( Figure 2 ). The sampling design was influenced by the results of a power anal- ysis that used regional catch data for 2006–2012 from a vent- less trap survey (ASMFC, 2015) to identify background variabil- ity and illustrate the relationship between sampling effort and precision of catch estimates. The final design integrated these sample-size estimates with additional input from lobstermen, including steps to mitigate gear loss (trawl orientation, number of traps per trawl), soak time to allow for adequate trap fill, and fine-tuning site selection to reduce user conflicts (existing gill nets and tow tracks). The design also incorporated the Rhode Island lobster industry request that the survey include at least one vented trap per six-trap trawl for comparison with commer- cial fishing efforts and to reduce a potential bias of trap satura- tion by juveniles and crabs.
Lobster size, female reproductive status, shell disease, and claw loss (cull status) also were monitored. Female reproduc- tive status was noted to identify locations with favorable condi- tions for egg development and hatching and to examine poten- tial effects of BIWF construction and/or operation. The increase in shell disease prevalence in Rhode Island Sound since the late 1990s (Castro and Somers, 2012) and claw loss can be indica- tors of environmental stress. Claw loss also creates individuals that are less valuable to the fishery than intact lobsters. Catch rates and individual sizes were also evaluated for several bycatch species that were developing or established as commercial and recreational fisheries in the area, such as Jonah crab (Cancer borealis), rock crab (Cancer irroratus), and black sea bass (Centropristis striata).
Ventless Trap Analytical Methods
Similar to the demersal trawl survey, statistical methods focused on estimating the 95CI around measures of change described by pre-specified contrasts. Lobster catch data (average annual catch per trap [CPUE] for the six-trap trawls) were modeled in R as a function of area and year with normal GLMs and a log-link.
Models for other metrics, for example, proportion ovigerous, shell disease, and claw status, were constructed similar to catch data, but with binomial GLMs and a logit-link.
Lessons Learned from Ventless Trap Sampling Design Assessing multiple metrics provided a means to evaluate sev- eral potential mechanisms of effect. The number of years sur- veyed allowed comparison with regional trends. Average lob- ster catches were lower during the operation period both Near Field (difference of –0.6, 95CI [–1.0, –0.3]) and Far Field (dif- ference of –0.5, 95CI [–0.9, –0.2]), reflecting a trend of declin- ing catches throughout the region (Wilber et al., 2020b). Spring (late-stage eggs) ovigery rates increased between the baseline and operation time periods to a greater extent in the Far Field (difference of 25%, 95CI [11%, 38%]) than near the wind farm where ovigery rates were highly variable (difference of 7%, 95CI
[–27%, 38%]). Use of two sampling blocks in both the Near Field and the Far Field ( Figure 2 ) provided a better understanding of spatial variation in late-stage, ovigerous female distributions; for example, ovigery rates at NS increased 14% between the base- line and the operation time periods compared to a decrease of less than 1% at NN.
Potential construction effects were examined by compar- ing estimates between months in which construction occurred to the same months during the baseline period ( Figure 2 ).
Bimonthly sampling provided sufficient data to determine that lobster catches were significantly higher near the wind farm during Phase I construction (difference of 0.5, 95CI [0.1, 1.0], Figure 5 ; Wilber et al., 2020b), and significantly higher every- where during Phase II (difference of 1.1 in the Near Field, 95CI [0.7, 1.5] and 4.5 in the Far Field, 95CI [4.1, 4.9]), a period during which high catches were observed throughout the region as corroborated by Rhode Island and Massachusetts state sur- veys (Wilber et al., 2020b).
During the last survey of each year (late October), lobster catch rates at the Near Field areas were often still near their annual high, while catch rates in Far Field areas were near zero (FN) or between 20% and 50% of the annual high (FS). This sea- sonal trend in catches declining earlier with increasing proxim- ity to the mainland is consistent with seasonal offshore move- ment as nearshore water temperatures decline (Goldstein and Watson, 2015). Annual lobster catches were consistently higher at the Far Field areas throughout all years of sampling. In hind-
Size of circle indicates relative magnitude of catch