Ocean Exploration
Presentation for the Revelle Lecture, National November 1, 2001
Academy of Sciences
Marcia McNutt
Monterey Bay Aquarium Research Institute. Moss Landing, California USA
Introduction
What fuels scientific discovery? The experts on this subject, the philosophers of science, have recently tended to promote the value of hypothesis-driven research, in which questions suggest experiments that lead to tests of the proposed theory. Hypothesis testing is indeed a cornerstone of the scientific method. It is what we teach our students. It is how we write our pro- posals and how we logically present the arguments in our scientific papers.
But as I think back on some of the more interesting scientific papers that I have written, I admit that this classic application of the scientific method was mostly a farce. The hypothesis that I set out to test (as per the funded National Science Foundation proposal) was not the question I ended up answering. The paper that I ultimately wrote made it sound as though I had known all along where the project was leading, whereas in fact it was only after the data were collected that I finally was able to, in effect, "read the story that the data had to tell." The National Science Foundation (NSF) implic- itly seems to understand that this experience is com- monplace; in evaluating your prior accomplishments, they never ask whether you found the answer to the question you had been funded to address. All that counts is that your results are original and important.
What this experience suggests to me is that there is still so much we do not know about the oceans that often we do not even know the proper questions to ask or an unambiguous w a y to test what hypotheses we do have. For that reason, I am a fan of ocean exploration.
History of Ocean Exploration
Ocean exploration dates back at least to the voy- ages of the Beagle and the RMS Challenger. The
Challenger ~ expedition in 1872-1876, in particular, radi- cally changed our views of the deep sea. With funding from the British Royal Society, that expedition system- atically collected observations of the oceans stopping every two hundred miles. At each station, depth to the seafloor and temperature at various depths were meas- ured by lowering a sounding rope over the side. Water samples were collected, and the bottom was dredged for rocks and deep-sea marine life. The results from the expedition were staggering and filled fifty volumes.
Surprisingly, oceans were not the deepest in the mid- dle the first hint of the vast mid-ocean ridge system that would be so central to the seafloor spreading con- cepts proposed later. Seven hundred fifteen new genera and 4417 new species were identified, but unexpected- ly, none turned out to be the living fossil equivalents to the trilobites and other ancient marine creatures found in terrestrial strata. The types of sediments on the seafloor were unusually lacking in diversity as com- pared with terrestrial equivalents, and were catego- rized by Sir John Murray 2 as being one of only two types: chemical precipitates or accumulations of organ- ic remains. The Challenger expedition set the pattern for all expeditions for the next 50 years.
After the World Wars, m o d e r n oceanographic research ships resumed exploring the oceans with interdisciplinary teams of scientists under funding from the newly-established Office of Naval Research and the National Science Foundation. However, gradu- ally over the years, exploration per se went out of favor.
By the 1970s it was already very difficult to obtain funding to take a new array of tools to a new place just because no one had ever been there before. Instead, the emphasis is now on testing hypotheses, which in turn
'The Challenger covered 68,890 nautical miles, still the record for the longest expedition ever. The ship stopped for 362 stations at which depth, s e a
bottom temperature, and various geological and biological samples were collected. It was also the first expedition to carry a camera to record its findings.
2The name that is best remembered in terms of this expedition is that of John Murray who spent 19 years completing the report from this expedi- tion. In fact, the expedition was led by Charles Wyville-Thomson, and Murray was his student.
Oceanography • Vol. 15 ° No. 1/2002 112
means that ships keep returning to places where scien- tists already have enough information in order to pose a hypothesis. The global map of ship tracks changes lit- tle from year to year despite m a n y nautical miles logged, because they are simply retracing well-worn routes. The scientific parties have changed composi- tion as well. Except in some rare instances of special multidisciplinary programs, ships
are no longer staffed with physics, biologists, chemists, and geologists, all trying to understand the same system. It is difficult to justify the berth space and travel costs for a participant whose expertise is not necessary to test the narrow hypothesis at hand, and multidisci- plinary proposals are subjected to double or triple jeopardy at the
hands of the more narrowly constituted peer panels.
The education programs have changed in response to these trends. Students have become more narrowly trained in their own disciplines in order to acquire the depth of understanding necessary to tackle the next higher order of hypothesis testing. A marine geo- physics student asked to describe a basalt, by far the most common rock in the oceans, will know in great detail its density and seismic velocity structure, but probably won't be able to select the basalt hand speci- men from amongst a collection of rocks.
Serendipitous Discoveries
To be sure, startling finds have been stumbled upon in the course of hypothesis-driven research. One of the more important surprises of the 2 0 th century was discovery of the chemosynthetic communities in the deep sea. This discovery was the unintended conse- quence of a very deliberate attempt to solve the mys- tery of the missing heat at the mid-ocean ridges. The plate tectonic model predicted that molten magma was forming new plate material at mid-ocean ridges. The ridges stand high above the surrounding seafloor because the hot rock is thermally expanded. The seafloor gradually cools through the conduction of heat to the surface, and therefore contracts and sub- sides as it drifts away from the plate boundary.
According to this model, the depth of the seafloor should be directly proportional to the square root of its age, and its heat flow should be inversely proportional to the square root of its age. Agreement between the model and seafloor depths is excellent, but the heat flow near the ridges is far less than the model would predict.
Marine geologists began to suspect that their assumption that heat is lost only through conductive mechanisms was flawed. They envisioned the under- sea equivalent of "Old Faithful" transporting heat
directly to the cold oceanic heat sink via the circulation of seawater through oceanic crust. Although in retro- spect this prediction turned out to be dead on, I know of no suggestions that deep sea hot springs would harbor novel species prior to their discovery. Then-current the- ories would not have predicted that proteins could fold, and thus function at such hot temperatures. The search
In this case, the serendipitous discovery was so impressive
that even the geologists on board the ship were able to
recognize its importance.
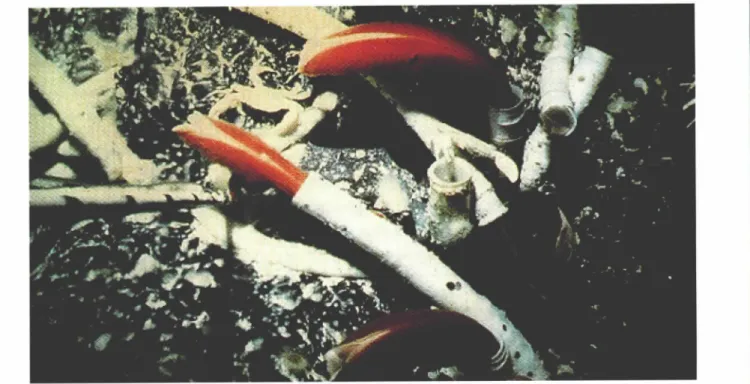
for the hypothesized deep-sea hot springs proved elusive, because at any one time only a very small por- tion of the mid-ocean ridge is vol- canically active. However, in 1977 an expedition to the Galapagos Ridge offshore Ecuador paid off mightily. Images from a camera sled towed near the bottom revealed a veritable oasis of life associated with hot waters venting from cracks along the ridge (Figure 1). The submersible Alvin arrived on site soon after, to sample the vent waters and fauna associated with the deep-sea hot springs. The fuel for this branch of the food chain did not come from photosynthesis, but rather from novel chemical reactions mediated by bacteria. The scientific party had been so utterly unprepared for what they found that they had to preserve the biological speci- mens in vodkaL
This story is well known and often recounted. In this case, the serendipitous discovery was so impressive that even the geologists on board the ship were able to recognize its importance. The stunning visual images so enthralled scientists that there was no question but that the funds would be found for repeat visits to the vent sites. But what about those discoveries less obvious, that might go unnoticed by a shipload of specialists on hand to test a narrow hypothesis? Or what about those chance encounters that the shipboard party is unprepared to document fully, and that cannot later be exploited either due to their ephemeral nature or lack of sufficient resources? For those reasons, the research community would benefit from a program in ocean exploration.
The Unknown Ocean
As we enter the 21 "t century, it is still true that the vast majority of the ocean is u n k n o w n and unexplored.
It is always difficult to estimate how much of the ocean has been surveyed since the answer is scale dependent.
Consider for example the simple question of how well we know the depth of the ocean basins. At scales longer than a few tens of kilometers, we can use gravity anom- alies recovered from satellite altimetry to interpolate between sparse ship soundings in order to yield a first- order approximation to seafloor depth. But this is only a proxy, and is totally inadequate for geologic mapping,
'For a first-hand account of the discovery of the deep sea communities, see Ballard's "The Historjl orAlvin", in F(fiy Years qf Ocean Discovery, National A c a d e m y Press, 2000.
Oceanography • Vol. 15 • No. 1 / 2 0 0 2
113
Figure 1. Tube worm colony thriving in the hot vents along an active midocean ridge segment.
Figure 2. Chain of salps in Monterey Bay. This particular species is Tethys vagina, the largest salp species. This image, from high-definition television deployed on MBARI's R O V Ventana, reveals embryos inside the individual members of the chain, as well as amphipods and a fish. The amphipods are stealing food from the mucous strands of the salps, and the fish are hiding out. In a region devoid of physical substrate, such as rocks or trees, this chain of salps is providing habitat for other marine animals, ©2001 MBARI.
114
Oceanography • Vol. 15 • No. 1 / 2 0 0 2
minerals assessment, habitat characterization, fisheries management, estimation of geologic hazards, etc. At best about 5% of the seafloor has been mapped with multibeam echo sounders 4, and even that is only a first step towards useful bottom characterization.
As we move u p w a r d into the water column, the situation is even worse. The midwater zone, between the sunlit upper layers and the benthos, is the largest habitable living space on the planet. Just prior to World War II, it was thought to be a wasteland. The soft-bod- ied denizens of this world (Figure 2) are mostly destroyed by traditional sampling gear (net tows, etc.) and leave no fossil record. Sonars deployed by U.S.
Navy ships in World War II indicated that indeed something living was d o w n there. Reflecting layers appeared on the sonar screen as phantom bottoms.
And the bottom moved up and d o w n in a daily cycle.
This was the first hint at the largest animal migration on the planet.
It took some thinking out of the box to actually learn what these midwater organisms look like. Bill Hamner, an ornithologist then at University of California at Davis, had become allergic to bird feath- ers, and therefore was in search of a new profession.
Oceanography seemed safe for someone with allergies.
On one sampling trip to the Gulf of California in 1969, he was surprised to see the marine biology graduate students combing the deep sea with nets to sample organisms. Bill asked them w h y they were doing that.
They answered that it was the w a y deep-sea biology was done. Bill asked w h y they didn't simply go d o w n there and look at what was there. This simple question led to a complete turn-around in the methodology for studying deep-sea biology, with blue-water diving, fol- lowed by h u m a n occupied submersibles, and remotely operated vehicles (ROVs) replacing net tows.
These new tools have revolutionized our thinking about the midwater. Now its biomass is thought to exceed that of all of Earth's rainforests combined. The potential here for fundamental discovery is great, but we know so little about this realm that it is difficult to even pose questions within the context of a hypothesis- based research system. For example, on a recent sam- pling expedition Bruce Robison from the Monterey Bay Aquarium Research Institute (MBARI) found a doliol- id with a copepod in its gut. This was completely unex- pected: doliolids are filter feeders. The body parts (Figure 3) and subsequent DNA analysis confirmed that this creature was indeed a close relative of the fil- ter feeders, but the fact that even in the lab it would consume copepods indicated that this particular speci- men is a carnivore. This discovery would be analogous to finding on land a cow eating like a tiger. So what caused this peculiar turn of evolution? We don't yet have the answer, but how would we even know to ask such a question if we hadn't stumbled across this bizarre
- . . . : .'~
Figure 3. Framegrab of the unusual carnivorous doliolid captured by the ROV Tiburon on a transit between Monterey Bay and Hawaii, ©2001 MBARI.
animal. This is, in m y view, one of the most important outcomes of exploration. It leads to posing questions that no one would otherwise have thought to ask.
The Ocean Exploration Initiative
Just two years ago I was asked by National Oceanic and Atmospheric Administration (NOAA) Administrator Jim Baker to chair a panel of distinguished researchers, explorers, educators, and marine archaeologists to develop a national strategy for ocean exploration (NOAA, 2000). The report was commissioned by the White House on the bicentennial of the Lewis and Clark expedition, and was intended to expand exploration of our planet to the portions that lie undersea.
The panel embraced the charge with relish, and recommended that the nation implement a program of ocean exploration with four elements:
1. Voyages of discovery.
2. Platform and instrumentation development.
3. Data management and dissemination.
4. Formal and informal educational outreach.
In this presentation today, I would like to focus on the promise for ocean exploration based on develop- ments in two areas: new tools (platforms and instru- ments) for exploration and progress in how we manage and distribute data.
New Platforms
One of the reasons w h y an effort in ocean explo- ration is timely is that we now have a wonderful array of new platforms that were unavailable during the ear-
*This percentage was estimated by David Caress who maintains, under NSF funding, general purpose software called MB-System that enables plotting and manipulation of multibeam mapping data from all systems in general use now or in the past.
Oceanography • Vol. 15 • No. 1/2002
115
Figure 4. The M B A R I R O V Tiburon. This vehicle was first launched in 1997 and allows scientists to explore the ocean to depths o,1:4000 m. Its variable ballasting system and electric motors make it an ideal platform for silently hovering in the midwater to observe animal behavior.
Photo by David French, 01997 MBARI.
lier forays into ocean exploration. These platforms help to overcome the fact that man as a species is complete- ly unsuited to survival in the deep sea, an environment in some ways more challenging than space in terms of exploration.
Figure 5. Pyrosomes exhibit unusually bright biolumi- nescence. These passive filter feeders, about 0.3 m in length, are common near the surface, where sailors can see them shining at night. Their dead bodies become habitats for other marine organisms. Photo courtesy of Edie Widder, Harbor Branch Oceanographic Institution.
ROVs
One of the most promising tool for ocean explo- ration, in m y opinion, is remotely operated vehicles, or ROVs. These sophisticated, u n m a n n e d platforms are deployed from surface ships, and remain connected to the surface via an umbilical cord that provides power and two-way communication between the science party and the vehicle. They serve as extensions of the scientists eyes, ears, hands, and other senses in the deep sea. MBARI's Tiburon is an electric vehicle (Figure 4). Quiet, like its namesake, the shark, it can sneak up on animals in the water column. Beneath the vehicle is a tool sled custom-equipped with the sampling and observing gear needed for the type of mission at hand - - e.g., mid-water biology, benthic biology and geolo- gy, etc. Tool sleds can be easily swapped in and out in a matter of minutes to reconfigure the vehicle for another mission.
These remotely operated vehicles have a number of advantages over h u m a n occupied submersibles.
They can be much cheaper to build and operate, because it is unnecessary to equip them with the life support systems for h u m a n occupants. Second, one can take greater risks with them in terms of operations, because no lives are at stake. If a storm whips up the waves on the surface, the ROV can stay in the calm of the deep sea for days if necessary until the storm blows over, while the manned submersible probably would
not have even been launched that day with a threat of bad weather. Third, whereas human-occupied sub- mersibles carry a very limited party of observers (e.g., Alvin carries one pilot and two scientists), there is no limit to the number of "participants" in an ROV mis- sion. MBARI currently transmits the images that come up the umbilical cord to an audience at the Monterey Bay Aquarium via microwave. There is no impediment to even wider participation via the internet. And final- ly, with an ROV there are few limits to the duration of a mission. Unlike the humans in a manned sub, the ROV never gets hungry, never gets cold, and nature never calls.
So what sort of discoveries are we making with this versatile class of vehicle? As one example, we n o w know that light is the most common form of language on the planet. For decades we have been listening in the ocean, and indeed sound is the mechanism for communication and navigation by marine mammals, many fish, and even some invertebrates. By compari- son, little effort has been expended on exploring the use of light in the ocean, despite the fact that probably 90% of animals in the ocean communicate using biolu- minescence (Widder, 1997; Figure 5).
The m o d e r n generation of remotely operated vehi- cles provides a superb platform for studying the use of light in the ocean, and other examples of animal behav-
Oceanography • VoL 15 • No. 1/2002
116
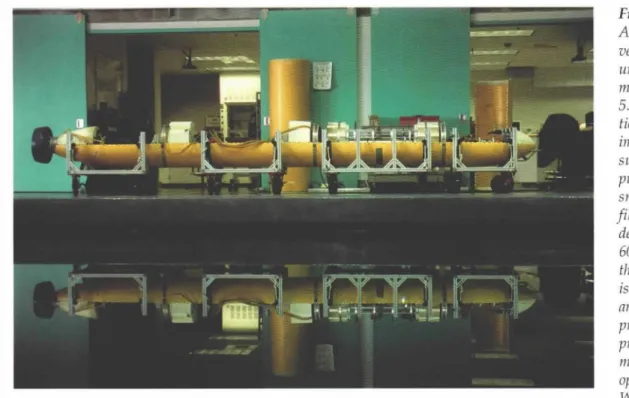
Figure 6. The M B A R I A U V Dorado. The vehicle can be config- ured in Iengths from 2.2 m (no midsections) to 5.6 m (two midsec- tions). The vehicle min- imizes the use of pres- sure housings by putting most systems in smaller, lighter, oil- filled enclosures. Its depth rating is 4500- 6000 m, depending on the payload. The vehicle is steered by a novel articulated tail cone and propelled by a ducted propeller, resulting in more robust, efficient operation. Photo by Todd Walsh, ©2001 MBARI.
ior. Based on chance observations, a number of uses of bioluminescence have been proposed, such as:
1. Counter-illumination to cancel shadows against the ocean surface in order to avoid predation;
2. Attracting a mate and indicating sex;
3. Attracting prey;
4.Attracting like species for aggregating and schooling;
5. Bringing attention to the predator in hopes that the predator will itself become a meal for its own predators (Robison, 1992).
Chance encounters with marine animals have also suggested that body language might be an important means of communication. Imagine the vocabulary pos- sible with different combinations of postures from 8 arms! Someday we might be able to read this language.
AUVs
Another very promising class of deep-sea explo- ration platform is the autonomous underwater vehicle, or AUV. Unlike the tethered ROV, AUVs are free-swim- ming vehicles that execute pre-programmed missions under battery power. They are two orders of magni- tude cheaper than ROVs and can be launched from small ships of opportunity (or potentially even from shore, helicopter, or airplane). Therefore, these vehicles are the platforms of choice when high power and real- time connection to the h u m a n brain (via the ROV umbilical) are not necessary.
MBARI's Dorado-class vehicle is m o d u l a r in design. The tail cone contains the propulsion system,
the navigation, and the batteries. The nosecone is equipped with a standard suit of water column sensors (Conductivity-Temperature-Depth, or CTD, etc.) and sonars. The midbody can be individually configured by any research team for the mission at hand. Payloads we are currently integrating include a high-resolution multibeam sonar, a fluorometer, a bioluminescence detector, etc. A research institution need only invest in a few tailcones (the expensive part) to be shared among research groups, with no limit to the number of mid- body payload sections in development at any one time.
With f u n d i n g from the National Science Foundation, this AUV is currently exploring the phys- ical oceanography and hydrography under the Arctic ice. For this mission, the Atlantic Layer Tracking Experiment, the vehicle has been equipped with two m i d b o d y sections (Figure 6). One section contains extra batteries for a two-week mission. The other sec- tion contains expendable buoys that are periodically launched to transmit installments of the data collected so far back to shore. The buoys rise under the ice, and release a chemical that allows them to melt their way up through the Arctic ice cap. Once the nose of the buoy emerges from beneath the ice, it deploys a satel- lite antenna that beams the information back to MBARI.
Vehicles such as this hold great promise for afford- able exploration of the ocean by fleets of AUVs equipped with a broad suite of physical, chemical, and biological sensors on long-term missions.
Oceanography • VoL 15 • No. 1 / 2 0 0 2
117
New Sensors for Probing the Depths
The platforms described so far are only as useful and versatile as the sensors available for equipping them. Until recently, most of the available in situ sen- sors were for monitoring the physics or the geophysics of the ocean. For example, CTDs, current meters, acoustic Doppler current profilers, hydrophones, and seismometers all represent mature technology that is widely available. By comparison, in the chemistry and biology areas, few in situ sensors are available.
Researchers are still using the technology for sampling that was used on the Challenger(!); e.g., water samples are collected in bottles, returned to shore, and then subjected to various chemical and biological assays and investigations. To be sure, the laboratory tech- niques have advanced substantially, but sampling itself is still, relatively speaking, in the Dark Ages. But all of that is changing. With the recognition that the oceans are not just a big body of water, that they are a living organism, more effort is being placed on exploring their biological and chemical properties in situ.
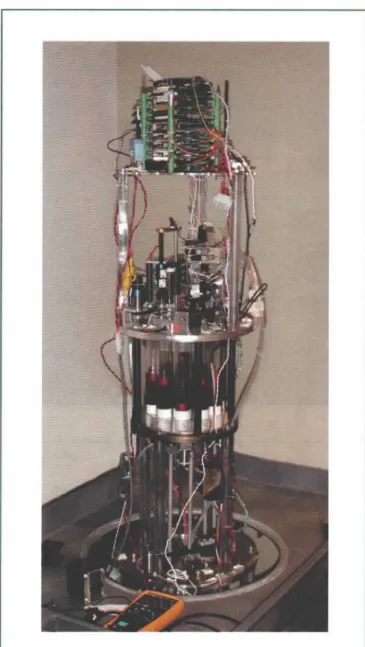
O n e of the developments of which we are most proud at MBARI is the Environmental Sample Processor, or ESP (Figure 7). This device allows con- ventional lab-bench exploratory genomics to be per- formed in the ocean. The device, which could be deployed from a ship, mooring, ROV, AUV, or cabled observatory, automatically pulls in a sample of seawa- ter on a pre-programmed schedule. The seawater is fil- tered to preserve a desired size fraction of micro-organ- isms. The cell walls of the organisms are then ruptured to release their genetic material. Spots on the filters contain molecular probes engineered to identify any of a number of species of interest. When the target is found, the probe fluoresces, and the result can be trans- mitted back to shore via satellite or microwave. A researcher sitting comfortably at his or her desk can instantly find out not only who is in the ocean, but also how m a n y of them are there. This device was original- ly designed and built by MBARI scientist Chris Scholin and engineer Gene Massion to detect the onset of harmful algal blooms. While this application is certain- ly important for understanding the health of the ocean ecosystem and those who consume its products, like us, the potential of this type of instrument for ocean exploration is limitless.
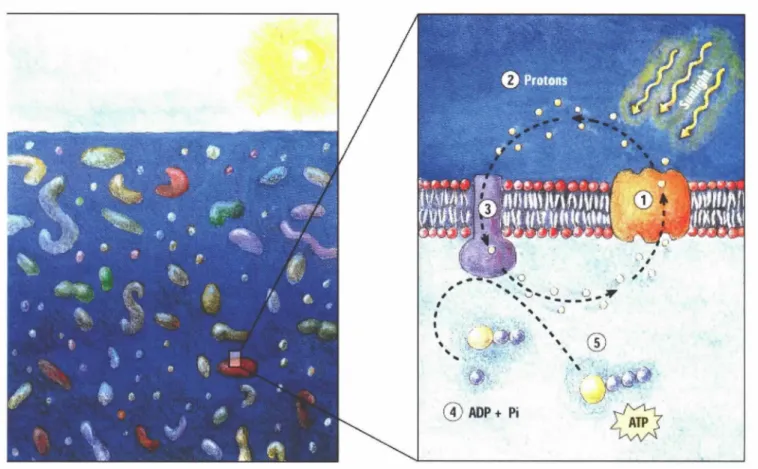
Ed DeLong, and his postdoc Oded B6jh, illustrated recently the power of genomics for exploring the microbial ocean. As m a n y as 1000 bacteria are found in each drop of seawater, but most of them are not identi- fied in terms of species or function. Furthermore, bac- teria are difficult to study, because 99% of them cannot be cultured in the lab. For example, it was thought that marine bacteria are heterotrophs living off dissolved organic matter in the ocean left over from the activity of the plant photosynthesizers.
DeLong and B6ja's study is causing the textbooks to be rewritten on this topic. They were using
Figure 7. The MBARI Environmental Sample Processor (ESP). This device is designed to conduct autonomous, preprogrammed chemical processing (such as DNA probe arrays) on material collected, filtered, and concentrated from seawater while deployed in the ocean environment.
Samples can also be preserved for later analysis in the lab- oratory after the filters are recovered. Two-way communi- cation with the shore is provided by radio modem. Photo by Todd Walsh, 02001 MBARI.
exploratory genomics to randomly search for identifi- able gene fragments in one of the most common bacte- ria in the oceans, SAR86. To their surprise, they found an unusual sequence that encodes a protein they now call proteorhodopsin (B6ja et al., 2000) This protein is morphologically and functionally very similar to bac- teriorhodopsin. Despite its name, bacteriorhodopsin had actually never been found in bacteria before. Its only previous occurrence was in the Archaean domain, in an extremophile that lives only in hypersaline envi-
Oceanography • VoL 15 • No. 1 / 2 0 0 2
118
Figure 8. Schematic showing the conversion of light energy to cellular energy by proteorhodopsin proteins in the cell wall of SAR86 bacteria. Illustration by Kirsten Carlson, ©2001 MBARI.
ronments. But the protein has an important function. It resides in the cell wall of the organism, and when hit with a photon of light, it changes shape such as to expel a proton from the cell. This then sets up a poten- tial difference across the cell that generates ATP, the currency for cellular energy (Figure 8). DeLong esti- mates that 20,000 proteorhodopsin molecules reside in each bacteria cell, enough to provide them with the energy to live and reproduce from sunlight.
We are just now beginning to imagine the possibil- ities for exploring the microbial ocean's genetic materi- al using this ESP. It can tell us not only who is there and in what numbers, but also what they are doing in the environment.
Data Management
New oceanographic sensor systems can collect in one hour more data than the Challenger collected in one year. But frankly, as a nation, we do a poor job at man- aging those data. There are some exceptions e.g., the National Geophysical Data Center for decades has kept an archive of all of the u n d e r w a y depth, magnetic anomaly, and gravity data collected by research ships.
But for the most part, data reside in the collection of the
Oceanography •
Principal Investigator (PI) who was funded to acquire them, and it is not easy to find out who has what.
Especially results that are not easily reduced to a man- ageable series of numbers are difficult to share, no mat- ter how generous the PI might be. At MBARI, we are currently developing n e w archiving strategies for video data and for information from application of molecular probes, such as the ESP, in order to make this information useful to the wider community. One of the great benefits of an ocean exploration program is the fact that it would facilitate the archiving of data and make them widely available to researchers and stu- dents who were not participants in the original data collection exercise. If done well, this treasure of data will be the fuel for hypothesis-driven research for decades to come. Anyone with access to the internet and a good idea can test his or her hypothesis.
A good example of data being used to solve a prob- lem that was not at all relevant to the problem being addressed at the time that the data were collected is provided by Ken Johnson's study of the processes that lead to the formation of submarine canyons. This is one of the oldest questions in all of marine geology, posed by Francis Sheppard himself. Most canyons lie offshore Vol. 15 • No. 1/2002
119
o
1 2 2 " 1 5 ' 122"00' 121"45' 121"30'
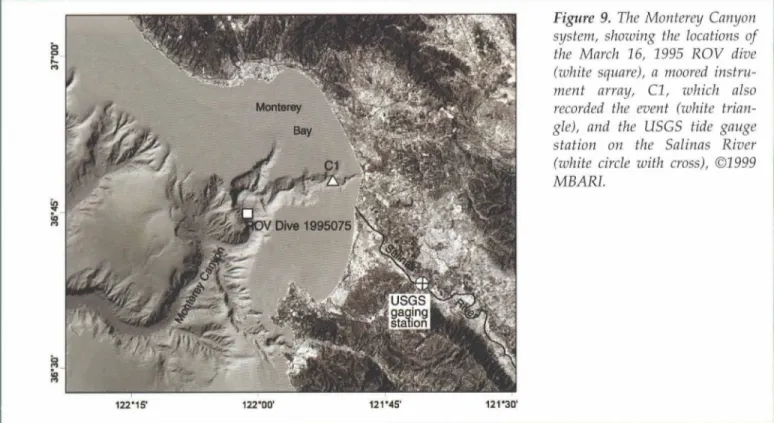
Figure 9. The Monterey Canyon system, showing the locations of the March 16, 1995 R O V dive (white square), a moored instru- ment array, C1, which also recorded the event (white trian- gle), and the USGS tide gauge station on the Salinas River (white circle with cross), ©1999 MBARL
the mouth of a river, but because river water is less saline (and often warmer) than ocean water, the river water should float on the surface, not cut a seafloor canyon by hugging the bottom. One early explanation was that the canyons were carved by subaerial fluvial processes during the Pleistocene when glaciers covered the continents and sea level was lower. However, it became clear that canyons are well developed far below what was the lowest stand of sea level during the ice ages. Other hypotheses proposed forces related to internal waves, tides, and ongoing mass wasting of the walls followed by downslope movement. One of the more interesting suggestions is that canyons are formed by infrequent but high energy hyperpycnal flows created during flood events. The idea is that these flows entrain so much suspended sediment that they move along the bottom of the ocean despite being fresher and warmer than the ambient seawater. It is an interesting idea, but hard to test. No one had ever doc- umented a hyperpycnal flow associated with a river system the size of the Salinas River. Although current meters had been deployed along the axis of the canyon, they did not survive long enough to tell the story of what might have happened.
Ken Johnson knew that MBARI had more than 10 years of records of ROV dives in Monterey Bay, m a n y of those dives for the purpose of exploring Monterey Canyon (Figure 9). These dives are annotated in a rela- tional database that includes the day, time, year, lati- tude, longitude, depth, temperature, salinity, oxygen content, density, transmissivity, as well as annotations and frame grabs of any significant observations seen in Oceanography 120
the accompanying video, such as marine life, geologi- cal formations, or samples taken. Ken asked the rela- tional database to find all dives that descended to the bottom of Monterey Canyon within 24 hours of the Salinas River hitting flood stage as recorded by the USGS river gauge on the Highway 68 bridge.
He found an example of a dive that occurred as the Salinas River reached flood stage in March of 1995. The instruments on the ROV recorded a profile that showed the temperature in the water column dropping as the ROV descended through the thermocline, but then mysteriously rising again just above the floor of the canyon (Figure 10). The salinity was low on the sur- face, presumably due to the high influx of fresh river water from winter rains, climbed to normal values in the midwater, and mysteriously dropped again at the base of the canyon. The transmissometer showed high levels of light transmission in the upper water column, with values plummeting to zero once the ROV plunged below the shoulders of the canyon wall at 1-km depth.
The frame grabs from the video cameras told the whole story. The ROV encountered a mudflow so thick that the video cameras could not detect the energy from their o w n lights. The meaning was apparent to Johnson: he had found a hyperpycnal flow actively eroding Monterey Canyon (Johnson et al., 2001). The ROV was diving into the Salinas River, except that it was flowing more than a kilometer deep 30 km off- shore Monterey Bay.
Although the researchers out in the canyon that stormy day back in 1995 felt that the dive was a bust, Johnson's study 5 years later was made possible
• VoL 15 • No. 1/2002
Z
O
6 g o
700
800
grin
1 riOri
1 100
1200
% Transience
I"1 20 40 60 80 100
2710 27ll 27.2 27.3 27.4
, . . . . , .... , .... , .... , . . . . Salinity
34.0 34.1 34.2 34.3 34.4
Temperature °C
3 4 5
g
%T Temp. a 0 Salin
Figure 10. Record from MBARI's R O V Ventana as it descended into Monterey Canyon on March 16, 1995.
The physical parameters show a near-bottom inversion as the R O V entered what appears to be a hyperpycnal flow from the Salinas River.
Sciences. Participating in these meetings was a fasci- nating experience, and during those years I spent some time reflecting on the occasions when one group of researchers had a difficult time communicating to another group from a different discipline. One session from a number of years ago I recall vividly. A group of seismologists had debated the question of whether earthquakes are fundamentally predictable. The reac- tion of some of the meeting participants was utter amazement. "Why," some of them asked, "doesn't an unbiased person perform the definitive experiment to determine which of the two competing hypotheses is right: are earthquakes predictable or not?" Comments such as this typically came from researchers address- ing systems that could be isolated on a lab bench and subjected to experimentation that would be completed before the current grant cycle ended (e.g., a cell, a laser beam, etc.). Questions such as this never came from astronomers or astrophysicists. They knew exactly what the geoscientists were up against. That they were dealing with large, complex systems that cannot be recreated in the lab. That they were dealing with time scales in many cases much longer than the time to tenure decision for an assistant professor, or even than the tenure of man on this planet. For the astronomers and astrophysicists, novel observations of the universe provided by new platforms and instruments fuel great leaps forward in u n d e r s t a n d i n g , especially when they do not neatly fit into the prevailing cosmol- ogy. Therefore, for the same reason that we need a space exploration program, we need an ocean exploration program. I ~
because the MBARI database didn't pass judgement on that dive. Although the dive was soon aborted, the video was annotated and the data archived in same w a y as every clive before and every dive since.
This last point is important to keep in mind in put- ting forth an ocean exploration program. It must be led by explorers, not researchers engaged in hypothesis testing. Sometimes the best researchers do not make the best explorers. The explorers must be willing to pass on the fruits of their efforts to the widest possible audience, and sit back as others profit from their labors. This might be one reason w h y philosophers of science have tended to discount new observations as the impetus for advancement. Most data are not col- lected by explorers. They are instead gathered by those engaged in hypothesis testing, who tend not to see pat- terns and trends that they do not expect or that are not relevant to the questions they are addressing. And it is not always easy to get the observations into the hands of the people who will be able to read the story that the data have to tell.
Concluding Remarks
For a number of years I was involved in the Frontiers of Science symposia originated by Frank Press and organized by the National Academy of
References
B6ja, O., L. Aravind, E.V. Koonin, M.T. Suzuki, A.
Hadd, L.P. Nguyen, S.B. Jovanonich, C.M. Gates, R.A. Feldman, J.L. Spudich, E.N. Spudich and E.E DeLong, 2000: Bacterial rhodopsin: Evidence for a new type of phototrophy in the sea. Science, 289, 1902-1906.
Johnson, K.S., C.K. Paull, J.P. Barry and E P. Chavez, 2001: A decadal record of underflows from a coastal river in the to the deep sea. Geology, 29, 1019-1022.
National Oceanic and Atmospheric Administration, U.S. Department of Commerce, 2000: Discovering Earth's Final Frontier: A U.S. Strategy for Ocean Exploration.
Robison, B.H., 1992: Bioluminescence in the ben- thopelagic holothurian Enypniastes eximia. J. Mar.
Biol. Assoc. U.K., 72, 463-472.
Widder, E.A., Bioluminescence - - Shedding light on plankton distribution patterns; evolution of instru- mentation; underutilized oceanographic tool. Sea Technology, 38 (3), 33-39.
Oceanography. VoL 15 • No. 1/2002
1 2 1