1 INTRODUCTION
Sustainability of reservoirs and downstream reaches below dams are threatened by reservoir se- dimentations. The objective of water and sediment incorporation is to manipulate the river- reservoir system to achieve sediment balance while maximizing the beneficial reservoir storage and minimizing downstream environmental impacts. Several methods for sediment management are available and have been implemented in practice. At the same time, an attempt to return the excavated and dredged sediment to the downstream river (hereafter we all ‘sediment replenish- ment’) has been undertaken aiming at balancing sediment inflow and outflow sediment budget.
An understanding of channel geomorphic responses to various sediment replenishment tech- nique and natural disturbances is important for effective management, conservation, and reha- bilitation of rivers and streams to accommodate multiple, often conflicting, needs. For example, channel changes may have implications for various needs including water supply, infrastructure, navigation, and habitat. Possible geomorphic responses of a channel to disturbances include channel-bed erosion or deposition, channel widening or narrowing, and channel straightening.
1.1 Sedimentation rates
Today’s worldwide annual mean loss of storage capacity due to sedimentation is already higher than the increase of the capacity by construction of new reservoirs (Boillat et al., 2003). Thus, sustainable use of the reservoirs is not guaranteed on the long term. The time evolution over the last century of the water storage capacity and volume losses due to reservoir sedimentation in
Sediment Management Strategies for Sustainable Reservoir
T. Sumi & S.A. Kantoush
Disaster Prevention Research Institute, Kyoto University, Goka-sho, Uji-shi, 611-0011, Japan
ABSTRACT: The worldwide sediment management techniques consist of three basic strategies:
sediment yield reduction, sediment routing, and sediment removal. The paper focuses on reser- voir sustainability by considering the following points. One is how we should choose suitable sediment management options under the consideration of each sedimentation conditions. In that case, annual water and sediment inflow volumes comparing to reservoir storage volumes are the key factors for the selections. The other is how we can design suitable volumes to be discharged from dam reservoirs. Combination of excavation and sediment replenishment option is now be- coming common in Japan. But it is still necessary to define target volumes to be excavated from reservoirs and supplied to downstream river channels for river restoration. Currently these pro- jects are still in trial stage with limited percentages of sediment replenishment ranging between 0.1 to 10 % of annual reservoir sedimentation volume and supplying grain sizes are mainly sandy materials. Case study at Nunome dam is a good example of comprehensive sediment management in upper Kizu river basin, Japan, and field survey shows that it contributes posi- tively to rebuilt sand bars and mitigate the armouring of river bed which create suitable habitats for aquatic species.
Japan, Switzerland and France are presented in Figure 1(a). These reservoirs are now facing a critical question of sedimentation. To maintain the existing dams and their facilities over the long term becomes an essential policy issue. Because of the following reasons: sedimentation is proceeding more than expected in many dams; the share of the dams having a design life of more than 50 years, such as multi-purpose dams where maintaining storage capacity is abso- lutely necessary, will rapidly increase in the future; and due to social changes in environment- conscious trend and an era of low-growth economy. Figure 1(a) shows the relationship between the changes in the reservoir storage capacity and the storage capacity loss due to sedimentation in Japan. While the storage capacity is being increased by the construction of new dams, it is be- ing lost by an average rate of 0.24 %/year. The figure shows that the average in Switzerland about 0.2% of the storage capacity and in France is 1.08%.
0 5000 10000 15000 20000 25000 30000 35000
1900 1950 2000 2050 2100
Storage Capacity(MCM)
Time (Years) Storage Capacity in Japan
Reservoir Sedimentation in Japan Storage Capacity in Switzerland Reservoir Sedimentation in Switzerland Storage Capacity in France Reservoir Sedimentation in France
France: sedimentation rate 1.08%/yr Japan: sedimentation rate 0.24%/yr
Switzerland: sedimentation rate 0.20%/yr
Figure 1. (a) Development and estimated evolution of installed water storage capacity and volumes lost due to reservoir sedimentation; (b) Global reservoir sedimentation rates (Basson, G. 2009).
There are no accurate data on the rates of reservoir sedimentation worldwide, but it is com- monly accepted that about 1–2% of the worldwide storage capacity is lost annually (Jacobsen, 1999). A detailed collection of sedimentation rates in regions all over the world can be found in Figure 1(b). The volumes of water-storage capacity lost due to reservoir sedimentation and the volumes of installed water-storage capacity in the world are presented in Figure 1(b). The graph shows the evolution over the last century, and the predicted future development.
1.2 Influences of sediment deficit on downstream reaches below dams
Reservoir construction and operation can have a substantial effect on the stability of the river channel downstream from the dam (Sumi and Kantoush, 2010). Reservoirs can trap and perma- nently store virtually the entire sediment load delivered from the upstream basin (Petts, 1979;
Williams and Wolman, 1984). Thus, immediately downstream from a dam, a river’s sediment load is greatly reduced. In addition, typical downstream changes in the flow regime include a reduction in the magnitude of peak flows and a possible increase in the magnitude of low flows (Williams and Wolman, 1984). In response, the downstream river may adjust in an attempt to re-establish an approximate equilibrium between the channel and the discharge and sediment load being transported. Possible adjustments include channel-bed erosion or deposition, channel widening or narrowing, and changes in channel pattern or shape. Downstream impacts develop through discontinuity in downstream gradients, e.g., sediment supply, water quality, tempera- ture, flow and sediment regimes. Sediment deficit is not only an environmental issue but also a socio-economic problem, for instance due to loss of reservoir capacity (e.g., Fan and Springer, 1993). Morphological effects on the river channel (e.g., Kondolf and Matthews, 1993; Kantoush et al., 2010) that includes riverbed incision, riverbank instability, upstream erosion in tributaries, groundwater over drafting, damage to bridges, embankments and levees (e.g., Kondolf, 1997;
Batalla, 2003), and changes in channel width.
(a) (b)
1.3 Objectives
The main purpose is to explain, how to select appropriate sediment management strategy in each reservoir according to sedimentation conditions within reservoir and in downstream reaches.
The other is how we can design suitable volumes to be discharged from dam reservoirs. In this paper, the results of study in Japan that used sediment replenishment strategy to investigate the geomorphic responses of channels to disturbances are presented. The examples provided dem- onstrate the use of sediment excavation and replenishing to downstream reaches to reduce sedi- mentation in reservoir and improve downstream reaches. Given that currently about 20 reser- voirs are excavated and supply the sediment to downstream rivers in Japan, the techniques described here may have utility for sediment replenishment and geomorphic response investiga- tions nationally.
2 SUSTAINABILITY OF RESERVOIRS 2.1 Concept and economical feasibility
The concept of sustainability applied to agriculture developed, ground water development, and road engineering. The essential concept of sustainable development is that the welfare of fu- ture generation should logically figure into the project decision-making. Reservoirs arguably represent today’s class of non-sustainable infrastructure. The objective of reservoir sedimenta- tion management is to minimize the adverse effect that sediment deposition in a reservoir has on its usability. The sustainability of reservoir should seek to balance sediment inflow and outflow across the reservoir while maximize the long-term benefits, the concept of sustainability is shown in Figure 2. The optimization of sediment removal methods as a dam group is inexpen- sive if a dam group was linked with each other for sediment management. This may involve strategies to minimize sediment inflow, enhance sediment release, or combination of several countermeasures for coarse and fine sediments. Examples of each facilities and proper mainte- nance sustainable reservoir management under the limited budget are presented. Technically, ef- ficient economically and environmentally countermeasures, the coordinating sediment manage- ment of multiple reservoirs in a river basin, are discussed. The main development patterns for reservoirs and sustainable development are summarized in Figure 2.
The latter essentially implies that the current generation uses resources in a consumptive manner, leaving the problems of dealing with its remains to future generations without provid- ing resources to do so. Integrated models of sediment flow and morphological dynamics in both regulated and free flowing rivers are necessary. Integration of different skills and approaches through provision of effective reservoir sediment management system to prolong the reservoir lifetime as illustrated in Figure 3, should allow the research to obtain some significant advances in the understanding of dam impacts.
Long‐term Sustainability
of reservoir Actions
Criteria
Environmental and social Economic
assessment Sedimentation
process assessment
Sediment impacts assessment
Screening of Sediment management
Implementation countermeasures Monitoring
of control measures Naming
of priority dam
Safety Maximizing sediment
release Environmental
compatibility
Food supply Biodiversity
Water quality Feasibility of
sediment strategy Cost and benefits
Habitat diversity
Figure 2. Concept of a sustainable reservoir. Figure 3. Illustration of prolongation of reservoir life- time.
Requiring a reservoir life measured in terms of thousands years instead of decades will de- mand new methods of analyzing costs and benefits. For all these reasons, developing new tech- niques to evacuate the fine and coarse sediment to maintain the functionality, and at the same time ecologically rehabilitating the involved landscape would be economically and environmen- tally beneficial for all types of reservoirs.
3 SEDIMENT CONTROL STRATEGIES
3.1 Classifications of sediment management techniques
Controlling reservoir sedimentations means in fact the control of sediment deposition in reservoir.
It consists of three basic strategies:
[1] Sediment yield reduction: to reduce sediment inflow to reservoirs. Apply erosion control tech- niques to reduce sediment yield from tributary catchments.
[2] Sediment routing: to pass sediment inflow around or through the reservoir so as not to accumu- late in reservoirs, by techniques such as partial drawdown sluicing and turbidity release.
[3] Sediment removal: to remove accumulated sediment by drawdown flushing, dredging and ex- cavation by mechanically or hydraulically techniques.
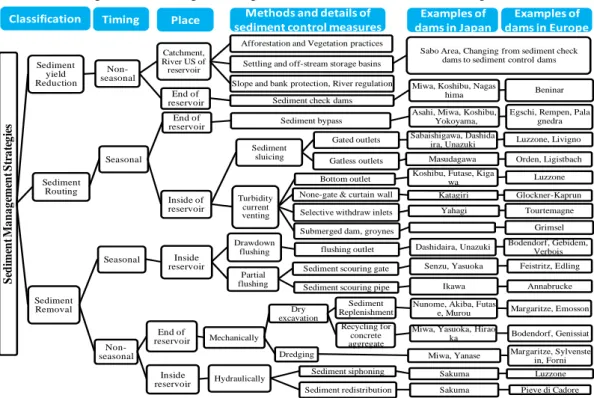
Figure 4 shows how sediment management is undertaken and classified. And some representative dams and examples from Europe and Japan, which exercise sediment management, are listed up.
Sediment Management Strategies
Sediment yield Reduction
Non- seasonal
Catchment, River US of reservoir
Afforestation and Vegetation practices Settling and off-stream storage basins
Sabo Area, Changing from sediment check dams to sediment control dams Slope and bank protection, River regulation
End of
reservoir Sediment check dams
Miwa, Koshibu, Nagas
hima Beninar
Sediment Routing
Seasonal
End of
reservoir Sediment bypass
Asahi, Miwa, Koshibu, Yokoyama,
Egschi, Rempen, Pala gnedra
Inside of reservoir
Sediment sluicing
Gated outlets Sabaishigawa, Dashida
ira, Unazuki Luzzone, Livigno Gatless outlets Masudagawa Orden, Ligistbach
Turbidity current venting
Bottom outlet Koshibu, Futase, Kiga
wa Luzzone
None-gate & curtain wall Katagiri Glockner-Kaprun
Selective withdraw inlets Yahagi Tourtemagne
Submerged dam, groynes Grimsel
Sediment Removal
Seasonal Inside reservoir
Drawdown
flushing flushing outlet Dashidaira, Unazuki Bodendorf, Gebidem, Verbois Partial
flushing
Sediment scouring gate Senzu, Yasuoka Feistritz, Edling
Sediment scouring pipe Ikawa Annabrucke
Non- seasonal
End of
reservoir Mechanically Dry excavation
Sediment Replenishment
Nunome, Akiba, Futas
e, Murou Margaritze, Emosson Recycling for
concrete aggregate
Miwa, Yasuoka, Hirao
ka Bodendorf, Genissiat
Dredging Miwa, Yanase Margaritze, Sylvenste
in, Forni Inside
reservoir Hydraulically Sediment siphoning Sakuma Luzzone
Sediment redistribution Sakuma Pieve di Cadore
Classification Timing Place Methods and details of sediment control measures
Examples of dams in Japan
Examples of dams in Europe
Figure 4. Classification of strategies of sediment control in Japanese and European reservoirs.
4 SEDIMENT REPLENISHMENT TECHNIQUE
There are two techniques to reduce the amount of transported sediment: 1) countermeasure to control sediment discharge which covers entire basin including the construction of erosion con- trol dams; and 2) countermeasure to forcibly trap sediment by constructing check dams at the end of reservoirs. In the technique with sediment trap, a low dam is constructed at the end of re- servoir as to deposit transported sediment, mainly bed load of relatively coarse grain size. The accumulated sediment can be excavated on land except for flood time, and the removed sedi- ments have been utilized effectively as concrete aggregate. As of 2000, the check dams have been constructed at 57 out of the dams under jurisdiction of Ministry of Land, Infrastructure, Transport and Tourism.
4.1 Sediment replenishment projects in Japan: Volume and grain size
In Japan, it is common practice to remove accumulated coarse sediment by excavation and dredging, and to make effective use of the removed sediment. Sediment replenishment method is one of new measures of sediment management. In this method, trapped sediment is periodi- cally excavated and then transported to be placed temporarily downstream of the dam. In a manner decided according to the sediment transport capacity of the channel and the environ- mental conditions. Therefore, the sediment is returned to the channel downstream in the natural flooding processes. The procedure of the experiments consists of four steps: (1) extracting me- chanically the accumulated sediment at check dam; (2) transporting it by truck to downstream river; (3) placing the sediment with specific geometry, and (4) monitoring flow, sediment, and environmental parameters.
Recently, sediment replenishment tests have been carried out in 20 dams in Japan. Okano et al. (2004) summarized sediment replenishment projects in Japanese Rivers. Kantoush et al.
(2010) investigated the morphological evolution and corresponding flow field during replen- ishment experiments in Uda River, Japan. Sediment treatment system is applied by Sumi et al.
(2009), to produce appropriate grain sized material with less turbidity. Seto et al. (2009) ana- lyzed sediment replenishment effects on the downstream river of Yahagi dam.
Sediment replenishment volume and grain size are recognized as key factors for a successful management in the river basin to create and maintain physical habitats, aquatic and riparian eco- systems. Figure 5 shows the relationship between the annual excavated sediment volumes from reservoirs and annual reservoir sedimentation volumes within reservoir (Sumi and Fujita, 2009).
Percentages of sediment replenishment are very limited ranging between 0.1 to 10 % of annual reservoir sedimentation since these projects are still in trial stage. Figure 6 shows the grain size distributions of replenished sediment which are very much different in each dam because of the location to take sediment out from reservoirs. In Miharu and Nunome dams, relatively fine sediments are dredged in upstream secondary reservoirs for trapping nutrient rich sediments.
Others are mainly excavating coarse sediments from conventional check dams.
1:10
1:100
1:1000
100 1,000 10,000 100,000
10,000 100,000 1,000,000 10,000,000
Annual Reservoir Sedimentation Volume(m3) Annual Sediment Replenishment Volume(m3)
Nibutani Miharu Futase Kawamata Aimata Kawaji Hachisu Yahagi Nagashima Akiba Nagayasuguchi Urayama Hitokura Shimokubo Agigawa Nunome Sagami
Figure 5. Relationship between annual reservoir sedimentation and replenishment volumes in Japan.
0 10 20 30 40 50 60 70 80 90 100
0.001 0.01 0.1 1 10 100
Grain Size(mm)
Percentage Passing(%)
Nibutani Miharu Futase Hachisu Managawa Nagashima Urayama Shimokubo Akiba Agigawa Nunome
Figure 6. Grain size distributions of sediment replenishment
4.2 Case study of Nunome dam actual sediment replenishment tests
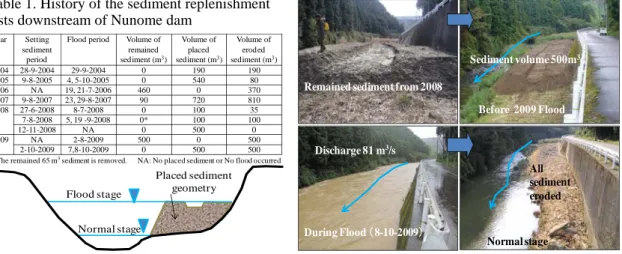
Since 2004, six experiments of sediment replenishment projects with different sediment vol- umes are undertaken below Nunome dam. Tracking the history and performance of these pro- jects is helping to understand the evolution of sandbars. Table 1 summarizes the replenishment history, flushing flow and sediments characteristics. The volume of placed sediment is limited to several hundreds of cubic meters each time. To implement this method, consideration has to be given to environmental problems in the lower river basins, to the occurrence of turbid water, and to safety risks due to sediment deposition in the channel. The data in Table 1 indicates that there is a need to increase the amount of the supplied sediments in Nunome River every year.
The replenished sediment is placed at such an elevation; in order to reduce the turbidity during normal flow period. The top of the sediment is adjusted so that the sediment is completely sub- merged during flood at several times a year and all sediment is eventually transported down- stream (Figure 7). Concrete means are being explored, taking into consideration the particle sizes of sediment, such as the scale of flood suitable for the safe implementation, and appropri- ate ways to place sediment.
Figure 7. Concept of sediment replenishment Figure 8. Evolution of replenishment experiments.
The evolving of bed topography and grain size distribution is monitored, along with water surface, velocities and rate of sediment transport at the downstream end of the Nunome River.
Figure 8 shows the remained sediment of 2008 and during the heavy rain with peak discharge of 81 m3/s. When the discharge exceeds 8 m3/s, the erosion starts and about 40 m3 of sediments are transported. Figure 8 shows the photos of field tests phases. All of the remained sediments are removed, and then new dredge sediments are placed.
Location of placed sediment (yellow area)
Newly formed sand bar after sediment rep lenishment
Under water deposition
Dep osition and vegetation after rep lenishment over point sand bar
Stream flow
Point bar and vegetation Stilling basin
Figure 9. Aerial photographs of Nunome dam with the downstream reach of Nunome River. Morphologi- cal changes and the self forming sand bar due to sediment replenishment below the dam (14-10-2009) Year Setting
sediment period
Flood period Volume of remained sediment (m3)
Volume of placed sediment (m3)
Volume of eroded sediment (m3)
2004 28-9-2004 29-9-2004 0 190 190
2005 9-8-2005 4, 5-10-2005 0 540 80
2006 NA 19, 21-7-2006 460 0 370
2007 9-8-2007 23, 29-8-2007 90 720 810
2008 27-6-2008 8-7-2008 0 100 35
7-8-2008 5, 19 -9-2008 0* 100 100
12-11-2008 NA 0 500 0
2009 NA 2-8-2009 500 0 500
2-10-2009 7,8-10-2009 0 500 500
* The remained 65 m3sediment is removed. NA: No placed sediment or No flood occurred
Placed sediment geometry Flood stage
Normal stage
Before 2009 Flood
During Flood (8-10-2009)
Discharge 81 m3/s
Normal stage All sediment eroded Remained sediment from 2008
Sediment volume 500m3
Table 1. History of the sediment replenishment tests downstream of Nunome dam
By using satellite images and aerial photos, a map of Nunome River in 2009 is constructed for 1 km below the dam. The river channel, island, point bars, and vegetation area are identified and distinguished by color as shown in Figure 9. The downstream reach of the dam, first 150 m from dam, experienced the greatest change in channel structure and loss of bars and islands. The replenishment processes are efficient to restore the bed load transport and the associated habited by coupling reintroduction with floodplain habitat restoration. In Figure 9 along the Nunome River, several cross sections are identified to survey after replenishment. Newly depositions over sand bars and in the river channel are shown in Figure 9. Moreover, a completely new sand bar is formed after 600 m from dam. With the field experiments the processes are directly visi- ble, and will be used for validation of numerical models.
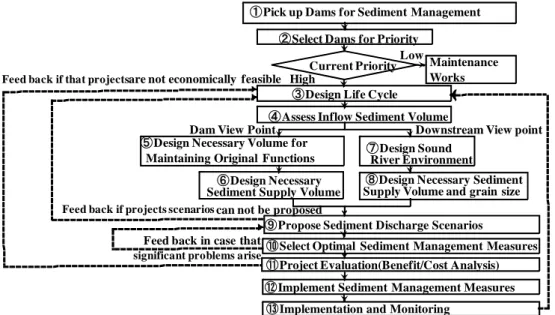
5 SUITABLE SELECTION OF SEDIMENT MANAGEMENT TECHNIQUE
Figure 10 shows flow chart for setting up sediment management strategy. Firstly, we have to pick up dams for sediment management (1) and select high priority dams (2). We should con- sider design life cycle for redevelopment project for these dams to calculate investment cost and benefit (3). Based past record of reservoir sedimentation, we can estimate future expected sedi- ment inflow (4). Here, stochastic approach considering extreme flood events is recommended to assess long term sediment yield and transport process (Sumi and Kantoush, 2010).
After that, we should consider parallel studies; one is to design necessary reservoir capacity volume for maintaining original functions of dams (5) and design necessary sediment supply volume to realize it (6). The other is to design sound river environment (7) and design necessary sediment supply volume and grain size (8).
①Pick up Dams for Sediment Management
②Select Dams for Priority
③Design Life Cycle Current Priority
④Assess Inflow Sediment Volume
⑤Design Necessary Volume for ⑦Design Sound River Environment
⑥Design Necessary Sediment Supply Volume
⑧Design Necessary Sediment Supply Volume and grain size
⑨Propose Sediment Discharge Scenarios
⑩Select Optimal Sediment Management Measures
⑪Project Evaluation(Benefit/Cost Analysis)
⑫Implement Sediment Management Measures
⑬Implementation and Monitoring
Maintenance Works High
Low
Dam View Point Downstream View point
Feed back in case that significant problems arise
Maintaining Original Functions are not economically feasible Feed back if that projects
Feed back if projects scenarios can not be proposed
Figure 10. Flowchart for setting up sediment management strategy
Finally, we should combine these two needs and decide appropriate scenario to discharge se- diment from dams (9). If there do not exist suitable scenarios, we should go back to (3). Based on the proposed scenarios, we can select optimal sediment management measures from several possible options such as reservoir flushing, sediment replenishment, bypass tunnel etc (10). If technical significant problems may arise, we should modify the scenario.
Selected sediment management measure should be evaluated by benefit/cost analysis (11) and, if the project is not economically feasible, we should revise the project from the master planning stage. Sediment management of reservoirs is very much complicated project which will affect reservoir sustainability and also maintaining downstream river health. So we should start to implement step by step basis (12) by conducting filed monitoring under the adaptive management concept (13).
6 CONCLUSIONS AND DISCUSSIONS
In case of sediment management, it is necessary to find out appropriate combination of flow and sediment release which can meet demands of various functions based on data of hydrology, water quality, river morphology and ecosystem, etc. Furthermore, the integrated sediment man- agement approach should be considered in sediment routing system which covers not only river basin but also coastal area. Since suitable sediment replenishment volumes and grain sizes are key parameters to design effective management strategy, these values should be decided from both view points of reservoir sustainability and downstream environmental improvements.
Sediment replenishing case study at Nunome dam is a part of comprehensive sediment man- agement in upper Kizu river basin containing fiver multi-purpose dams. We are now starting to clarify how to sustaining reservoir functions and how to improve river environment at the same time by coordinating operation. The replenishment directs future supplements for a more wide- spread dispersal of suitable sand for fish habitat including spawning beds. We shall intensively conduct these research and development to pursue the goal of harmony between human beings and other creatures. Regarding the continuation of this research project, the major goal is to find out which sediment geometry, volume, and feeding frequency leads to environmental and physical improvements below dams. This requires long duration tests combined with numerical modeling techniques.
7 REFERENCES
Basson, G., 2009. General Report of Q.89. 23rd Congress of ICOLD, Brasilia, Brazil.
Batalla, R.J. 2003. Sediment deficit in rivers caused by dams and instream gravel mining. A review with examples from NE Spain. Cuaternario y Geomorfología 17 (3–4):79–91.
Boillat, J.-L., Oehy, Ch. and Schleiss, A., 2003. Reservoir sedimentation management in Switzerland. 3rd World Water Forum, Japan, pp. 143 – 158.
Fan, S., Springer, F.E., 1993. Major sedimentation issues at the Federal Energy Regulatory Commission.
In: Fan, S., Morris, G. (Eds.), Notes on Sediment Management in Reservoirs. Water Resources Publi- cations, Colorado, USA, pp. 1–8.
Kantoush, S. A., Sumi, T., Kubota, A., Suzuki, T., 2010. The impacts of sediment replenishment below dams on flow behavior and bed morphology of river channel and river mouth. First International Con- ference, Coastal Zone management, River Deltas and Low Land Coastlines, Alexandria, Egypt, 2010.
Kantoush, S. A., and Sumi, T., Kubota, A., 2010. Geomorphic response of rivers below dams by sedi- ment replenishment technique. International Conference on Fluvial Hydraulics, River Flow 2010, Technische Universität Braunschweig, Germany, 8-10 September 2010.
Kondolf, G.M., 1997. Hungry water: effects of dams and gravel mining on river channels. Environmental Management 21 (4), 533–551.
Okano, M., Kikui, M., Ishida, H. and Sumi T., 2004. Reservoir sedimentation management by coarse se- diment replenishment below dams. 9th International Symposium on River Sedimentation, Yichang, China, Volume Ⅱ, 1070-1078.
Petts, G.E., 1979. Complex response of river channel morphology subsequent to reservoir construction.
Progress in Physical Geography, 3, pp 329-362.
Seto, K, Sakamoto, T., Suetsugi, T., 2009. Sediment control measures and improvement effects of physi- cal condition and environment by sediment flushing – a case study in the Yahagi dam. 23rd Congress of ICOLD, Brasilia, Brazil, Q.89-R.3.
Sumi, T., and Kantoush, S. A., 2010. Integrated Management of Reservoir Sediment Routing by Flush- ing, Replenishing, and Bypassing Sediments in Japan River Basins. 8th International Symposium on EcoHydraulics (ISE 2010), COEX, Seoul, Korea, 12-16 September 2010.
Sumi, T., and Kantoush, S. A., 2010. Stochastic sediment deposition process of large reservoirs in Japan.
11th International Symposium on River Sedimentation, Stellenbosh, South Africa,
Sumi, T., Kobayshi, K., Yamaguchi, K., and Takata, Y., 2009. Study on the applicability of the asset management for reservoir sediment management. 23rd Congress of ICOLD, Brasilia, Brazil, Q.89-R.4.
Sumi, T., Fujita, M., 2009. Current status and future challenges of sediment replenishment to downstream river. Advanced in River Engineering, JSCE, Vol.15.
Williams, G.P., Wolman, M.G., 1984. Downstream effects of dams on Alluvial Rivers. US Geological Survey Professional Paper 1286.