Low-Carbon Growth in Northeast Asian Economies:
Mirage or Reality?
Dr. Georgy SAFONOV
Invited Overseas Researcher, ERINA
National Research University-Higher School of Economics
Dr. Sh. Enkhbayar Senior Research Fellow, ERINA
January, 2017
Niigata, Japan
ECONOMIC RESEARCH INSTITUTE FOR NORTHEAST ASIA
ERINA Discussion Paper No.1701e
1
Low‐Carbon Growth in Northeast Asian Economies:
Mirage or Reality?
Dr. Georgy S AFONOV
Invited Overseas Researcher, ERINA
National Research University‐Higher School of Economics
Dr. Sh. Enkhbayar Senior Research Fellow, ERINA
Abstract
The Paris Climate Agreement established a new global target of combating global warming above 2 degrees Celsius. Over 180 countries have already committed to reduce or limit carbon emissions by 2030. This climatic goal will lead to the transformation and deep decarbonization of the global economy, with nearly zero carbon emissions soon after 2050.
Northeast Asian countries are responsible for 40% of global CO
2emissions, and they have the technological and resource potential for decarbonization both domestically and within regional cooperation projects.
Keywords: climate change mitigation; deep decarbonization pathways; low‐carbon development; Northeast Asia.
JEL codes: Q43, Q54, Q56, Q58, N15
1. Climate Change and a Deep Decarbonization Concept for Northeast Asia
Climate change poses global risks of dangerous impacts on economies, infrastructure, the environment, human health, local communities, and the well‐being of the population.
The 5th Assessment Report (IPCC, 2014) provides a comprehensive review of such impacts as well as long‐term projections by country and region.
As Stern (2007) indicated, although countries may benefit from warmer weather or increased precipitation (e.g. growth in crop productivity) in the near term, all countries will lose in the mid‐ and long‐term perspectives. In addition, the scale of the overall cost of a “no mitigation and adaptation” policy is up to 5–20% of global GDP per annum by the end of this century (Stern, 2007).
The key driver dramatically increasing the concentration of greenhouse gases in the
atmosphere in the last 150 years has been the hyperbolic growth of fossil fuel combustion
2
(primarily, coal, oil, and gas) and the associated anthropogenic CO
2emissions to date have accounted for 1.4 trillion tCO
2. In addition, rapid deforestation leads to both carbon emissions and the decrease of carbon sinks, which is especially relevant in the case of tropical forests (50% of which have already been cleared).
Mostly due to these anthropogenic impacts, the CO
2concentration has been pushed to over 400 ppm currently from 280 ppm in 1850. Recent measurements at Mauna Loa Observatory showed a record high CO
2level of 409 ppm (April 2016). The Earth has not experienced such a level of CO
2concentration for at least the last 400,000 years.
Currently, the global average temperature has increased by 0.8°C compared to the pre‐industrial level. Yet the regional distribution of warming is quite different. In Siberia and the Russian Far East the temperature has risen by 2.5–3.5°C, whereas in Japan it has increased by 1.15°C (compared to 1900). Unfortunately, the projections of further changes are all pessimistic, at various “tragic” levels: in the “good” scenarios warming will reach 2–
3°C, while in the “really bad” ones it would exceed 6°C by 2100 (IPCC, 2014).
Precipitation will also change dramatically, in some regions by over 50%, so that the hydrologic regimes will never be as normal in most of the world’s regions: more drought and dry seasons in some areas, with heavier rains in others. The tragedy of this change can be illustrated as follows: with 2°C of warming 300 million people will suffer from lack of drinking water, while with 3°C of warming more than 3 billion people will face water shortages. In any case, the migration of millions of people may have severe consequences for the global economy and well‐being of the population worldwide.
Considering the Northeast Asian region, the most important impacts of climate change include: drought with enhanced desertification and forest fires, sea level rise with the loss of sandy beaches and land, flooding with damage to infrastructure and residential areas, spread of insects and diseases northwards (including encephalitis, malaria, and yellow fever), heat and cold waves affecting human health and killing livestock, and many others (IPCC, 2014; S‐8, 2014; Roshydromet, 2014). Some impacts have already been observed, such as the loss of approximately 9 million head of livestock from the cold wave in Mongolia in 2010 (Ikegami, 2016), over 44,000 deaths from the heat waves in Russia (Revich, 2010) and over 1,800 deaths in Japan in 2010 (MOE, 2012), and billions in US dollar terms in damage from the Amur River flooding in China and Russia in 2013, etc.
The new climate agreement, signed at the UNFCCC COP21 set a new global target: “to hold the increase in the global average temperature to well below 2°C above pre‐industrial levels and pursue efforts to limit the temperature increase to 1.5°C pre‐industrial levels” (Art.
2 (a), Paris Agreement, 2015). In order to reach this “climatic” goal, the global greenhouse
gas (GHG) emissions should decrease to no less than 50% from the current level by 2050 and
reach a net‐zero level (accounting for carbon sinks in forests and land use) in the second half
of this century.
3
Ratification of the Paris Agreement by the United States and China (responsible for 38%
of global carbon emissions) in early September 2016 guarantees that the global treaty will come into force and the world economy will move towards a low‐carbon society. The faster the better for climate and human beings. The question is how?
The first attempt to model a “climate‐friendly” world economy by 2050 was undertaken under the Deep Decarbonization Pathways Project, initiated by the UN Secretary General Ban Ki Moon and supported by the Sustainable Development Solution Network and over 30 research teams from 16 countries (those responsible for 75% of global CO
2emissions).
The deep decarbonization concept assumes that global emissions should decline to a level sufficient to limit global average temperature growth by less than 2°C. In economic terms, it means that CO
2emissions should decline to roughly 1.7 tCO
2per capita by 2050 or so, and subsequently decline to almost a net‐zero.
The “clean” future of the largest economies, including China, the United States, Japan, the EU, Russia, and some others, was modeled using advanced mathematical tools.
Surprisingly, a lot of opportunities for decarbonization were found, and the costs were estimated to be in a range of 0.8–1.2% of GDP a year to deeply decarbonize these economies, with a time horizon of 2050 (Deep Decarbonization Pathways Project, 2015). An important impact of cost reductions was identified, first of all, with the declining “learning”
curves for key technologies (wind, solar, and electric vehicles, etc.) and an appropriate phasing‐out of old and amortizing equipment (coal and gas power plants), being replaced by carbon‐free alternatives.
2. Economic Development in Northeast Asia: Trends and Drivers
The Northeast Asian economies demonstrated substantial changes during the period 1990–2015: the population increased 17% from 1.47 billion to 1.72 billion; overall GDP increased 142% from US$7.2 trillion to US$17.4 trillion (at market prices, constant 2010 US$), while CO
2emissions increased four‐fold from 3.2 to 12.7 billion tCO
2per year.
At the same time, the economic development pathways of these countries were diverse, experiencing different scales of the impact of economic reforms, the global financial and economic crises of 1998 and 2008, and the world fuel and metal price drops in 2013–2016.
Overall, the well‐being of the population was rising in most of the countries during the period 1990–2015: GDP per capita (measured in purchasing power parity, PPP) in the Republic of Korea (ROK) almost reached the level of Japan in 2015, while in Mongolia it closely traced the dynamics for China. In Russia it has tripled compared to 1990 to approximately US$25,000 (PPP) per capita in 2015. However, in the Democratic People’s Republic of Korea (DPRK), the GDP per capita declined approximately two‐fold from 1990, primarily due to sanctions, economic recession, and continued population growth (Figure 1).
From 1990, the energy‐related CO
2emissions per capita decreased 30% in Russia, and
60% in the DPRK, and increased 15% in Japan, 100% in the ROK, and 250% in China, while in
Mongolia they declined by 30% and then returned to the 1991 level (Figure 2).
4
Figure 1. Dynamics of GDP per Capita in Northeast Asia GDP (PPP) international US$ per capita
Source: IEA, 2015
Figure 2. Energy‐related CO
2Emissions per Capita, tCO
2per capita
Figure 3. Kaya Decomposition for Northeast Asian Economies as a Whole,
2000–2013 (1990 = 100%)
Source: IEA, 2015 Source: Authors’ calculations based on IEA, 2015
0 10000 20000 30000 40000
1990 1992 1994 1996 1998 2000 2002 2004 2006 2008 2010 2012 2014
China Japan Russia
The ROK The DPRK Mongolia
0 2 4 6 8 10 12 14 16
19 90 19 92 19 94 19 96 19 98 20 00 20 02 20 04 20 06 20 08 20 10 20 12
Japan ROK Russia
DPRK Mongolia China
0 50 100 150 200 250
2000 2001 2002 2003 2004 2005 2006 2007 2008 2009 2010 2011 2012 2013
CO2 emissions Population
GDP per population (GDP per capita) Energy intensity (TPES/GDP) Carbon intensity: ESCII (CO2/TPES)
5
Analysis by Kaya decomposition for the Northeast Asian region allows the identification of the most important drivers of CO
2emission growth during the last 15 years: the wealth growth or growth of GDP per capita was the key driver of the CO
2rise, while other factors, such as population growth, the energy intensity and the carbon intensity of the total primary energy supply (TPES), were relatively stable and did not substantially affect the dynamics of CO
2emissions (Figure 3).
However, if the individual country pathways of the Kaya factors are considered, the importance of these drivers changes significantly. Compared to 1990 levels, meaningful energy intensity reductions were observed in Russia, Japan and Mongolia, while energy intensity dramatically dropped by approximately 30% in 2011 in the DPRK. The carbon intensity of the TPES has gradually declined by 30% in Russia, while in Japan it was relatively stable until 2011 and then it increased by approximately 20% due to the increased share of fossil fuels in the country’s energy mix following the 2011 earthquake and nuclear power plant disasters. The growth of population was another substantial driver for Mongolia and the DPRK (Figures 4a‐f).
The projections of energy‐related CO
2emissions in Northeast Asian countries to 2050, based on modeling of the individual country deep decarbonization pathways, show that even with extensive efforts on the national level aimed at decarbonizing the economies, the overall emission reduction may reach 50% by 2050 from the 2010 level. However, the dynamics of cumulative emissions were unable to be reduced below the 1990 level; this will
not allow following the pathway toward the “below 2°C target”
1(Table 1).
1
To limit the global temperature rise to 2°C, the concentration of GHGs should be below 450 ppm CO
2equivalent, which can be achieved by a GHG emission reduction below the 2010 level of 41–72% by 2050 and 78–118% by 2100 (IPCC, 2014).
The “1.5°C target” would not be met even in this scenario as a much more ambitious reduction of cumulative carbon
emissions would be required. The global “inspirational“ target for 2050 first appeared as a political target in the G8
communique released at the L'Aquila summit, stating that the G8 will collectively cut emissions by 80% below “1990 or
more later years” by 2050, and that the world should be able to cut its emissions by 50% by 2050.
6
Figures 4a‐f. Kaya Decomposition of CO
2Emission Drivers in Northeast Asian Economies, 2000–2013 (1990 = 100%)
Source: IEA, 2015
-50 100 150
2000 2001 2002 2003 2004 2005 2006 2007 2008 2009 2010 2011 2012 2013
(a) Japan
- 200 400 600 800 1 000
2000 2001 2002 2003 2004 2005 2006 2007 2008 2009 2010 2011 2012 2013
(b) China
- 20 40 60 80 100 120 140
2000 2001 2002 2003 2004 2005 2006 2007 2008 2009 2010 2011 2012 2013
(c) Russia
- 50 100 150 200 250
2000 2001 2002 2003 2004 2005 2006 2007 2008 2009 2010 2011 2012 2013
(d) Mongolia
- 50 100 150 200 250 300
2000 2001 2002 2003 2004 2005 2006 2007 2008 2009 2010 2011 2012 2013
(e) The ROK
- 20 40 60 80 100 120 140
2000 2001 2002 2003 2004 2005 2006 2007 2008 2009 2010 2011 2012 2013
(f) The DPRK
7
Table 1. Energy‐Related CO
2Emissions in 2010 and Projections for 2050, million tCO
2e Country 1990
12010
12050 2050 / 2010, % 2050 / 1990, %
China
22,184 8,152 5,201 64% 238%
Russia
32,163 1,529 200 13% 9%
Japan
41,049 1,123 180 16% 17%
ROK
3232 560 82 15% 35%
DPRK
5117 66 80 121% 68%
Mongolia
513 14 30 214% 233%
TOTAL 5,757 11,444 5,773 50% 100%
Sources:
1IEA/OECD, 2015;
2Teng, 2015;
3Deep Decarbonization Pathways Project, 2014;
4Kainuma, 2015;
5authors’ estimates.
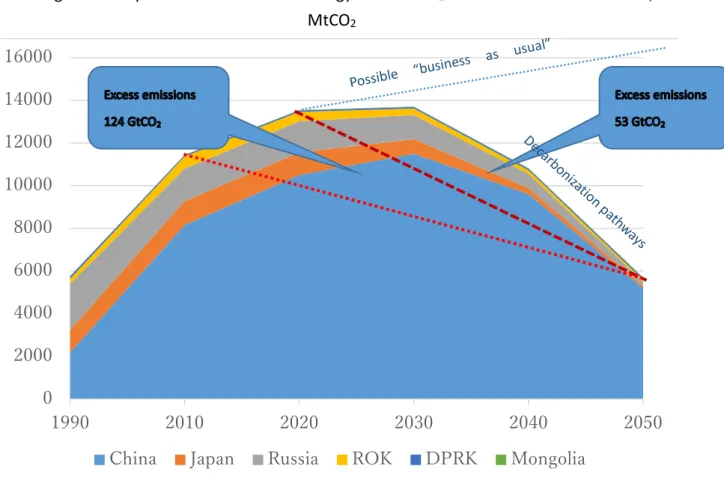
A delay in decarbonization action will cost much in terms of excess emissions of CO
2. If the downward linear decline of emissions had started in 2010, it would reduce cumulative emissions by 124 billion tCO
2from energy use compared to the deep decarbonization scenario, while the start of a linear decline in 2020 would reduce excess emissions by 53 billion tCO
2by 2050. The emission reductions are estimated to be much higher if the business as usual (BAU) scenarios are considered in comparison, as for many countries the BAU pathways would have an increasing or relatively stable level of emissions up to 2050, as is the case for the ROK, Russia, China, the DPRK and Mongolia. Japan’s nationally adopted target of an 80% reduction by 2050 (the base year is still to be determined) was adopted in the Fourth Basic Environment Plan, approved by the Japanese government on 27 April 2012 and reconfirmed in the forthcoming formal decisions, for example in Japan’s INDC submission to the UNFCCC in 2015 (Figure 5).
An early start in mitigation action in Northeast Asia would have great significance for
cumulative emission dynamics. As implementation of the Kyoto Protocol showed, the trend
in emissions did not result in a decline in the region during the period 2008–2012. The
efforts of other countries would definitely be “compensated” by the growing emissions from
the “carbon giant” China, but even without that, most countries in the region demonstrated
a continuing growth in emissions up to the present (except for the DPRK). Inertia in
8
economic development is likely to force countries toward carbon‐intensive growth until 2030 at least, increasing the risk of carbon lock‐in, when the long‐term investment in fossil‐fuel‐based assets will maintain high emission levels for the 40–50 year lifetime of power plants, industries, and transport infrastructure, etc. This risk even has global implications, as the regional economies will likely contribute to a higher share of global carbon emissions up to 2030 and beyond (up from the current 40% of the total).
Figure 5. Dynamics of Cumulative Energy‐Related CO
2Emissions in Northeast Asia, MtCO
2Source: Authors’ estimates, based on DDPP Report 2015.
3. Country Decarbonization Pathway Profiles 3.1. Japan
2Since 1990, the Japanese economy has been demonstrating a moderate rate of GDP growth: approximately 1% per year on average. To 2015 national GDP increased by 25% from its 1990 level. At the same time, the total primary energy supply increased by only 3.5%, while energy‐related CO
2emissions increased by 18%, and total national GHG emissions grew by 7%.
Japan’s energy and climate change mitigation policy was severely affected by the Great
2
In this section, the findings of the DDPP report on Japan were used in the main: Kainuma, M. et al. (2015).
0 2000 4000 6000 8000 10000 12000 14000 16000
1990 2010 2020 2030 2040 2050
China Japan Russia ROK DPRK Mongolia
9
East Japan Earthquake in 2011, the fourth most powerful earthquake in the world since 1900.
The subsequent tsunami caused accidents at three of the reactors at the Fukushima Daiichi Nuclear Power Plant complex. The World Bank estimated the economic losses to be as much as US$235 billion, the most costly natural disaster in history. Japan’s long‐term energy plans were revised, as the previous plan of 2010 assumed the expansion of nuclear power with the building of 14 new plants by 2030.
The revised Strategic Energy Plan in Japan was published in 2014 (METI, 2014), which corresponds to the Fourth Basic Environment Plan and aims at a reduction in GHG emissions of 80% by 2050. Japan’s contribution to the Paris Agreement was published in July 2015 and set a long term target of 26% below the 2013 level by 2030 (Japan INDC, 2015).
Japan’s GHG emission target of 80% below the 1990 level by 2050 can be interpreted as a total of energy‐related CO
2emissions of 2.1 tCO
2per capita in 2050 (a 75% reduction from the current level of 8.8 tCO
2per capita) and mostly corresponds to the deep decarbonization goal.
The three main scenarios for deep decarbonization in Japan were analyzed (based on the assumption of continued economic growth):
1) Mixed Scenario: decarbonization via strong action on the large‐scale reduction of energy demand through the deployment of various energy‐efficiency measures; a 97%
reduction in the carbon intensity of electricity through the large deployment of CCS (Carbon capture and storage) and renewables; and extensive diffusion of low‐carbon electricity in end‐uses, reaching 45% of final energy. This scenario considers a partial phase‐out of nuclear energy under the assumption that all plants are in operation for no more than 40–50 years, meaning the share of nuclear energy within electricity generation will be 19% in 2030 and 5% in 2050.
2) No Nuclear Scenario: decarbonization under a complete phase‐out of nuclear energy, under the assumption that no nuclear plant will be restarted after 2014.
3) Limited CCS Scenario: due to uncertainties regarding the scale of CCS technologies, this scenario considers other options for decarbonization rather than extensive CCS use (50%
less than in the Mixed Scenario).
Some general assumptions for all scenarios include:
2010 2050 2050/2010
Population (million people) 128 97 76%
Real GDP (US$ trillion) 4.65 7.04 151%
Crude steel production (million tonnes) 111 85 77%
Passenger transportation (Gpkm) 1.264 1.140 90%
10
In all scenarios, energy‐related CO
2emissions will decrease by 84% below the 2010 level by 2050, so that the 80% GHG emissions reduction target for 2050 can be achieved.
Energy sector. Fossil fuel use can be reduced substantially via the combination of a strong reduction of energy demand and the deployment of non‐fossil fuel energy supplies, primarily renewable energy sources. In the decarbonization scenarios, fossil fuel consumption falls by approximately 60% below the 2010 level by 2050.
The structure of the energy supply varies significantly among the scenarios. The share of renewable energy (including hydropower) in primary energy significantly increases, but the magnitude depends on the scenario considered. Renewables account for up to 35% of the total primary energy supply in 2050 in the Mixed and No‐Nuclear Scenarios, and significantly more in the Limited CCS Scenario (49%).
Natural gas and oil will remain mainly in the industrial and freight transport sectors, while coal should be almost fully phased out in 2050 via switching to renewables and natural gas. The role of nuclear power is significantly decreased in the Mixed Scenario and the Limited CCS Scenario, whereas renewable energy (including hydropower) increases over the mid‐ to long‐term, reaching approximately 59% and 85% of total electricity generation, respectively.
The scenario of large‐scale deployment of solar PV and wind power was considered in the No‐Nuclear Scenario, where natural gas and renewables play an increasingly important role in the absence of nuclear power, especially in the mid‐term. The share of electricity generation from natural gas with CCS rises after 2030 and reaches about one‐third of total electricity generation in 2050 in the Mixed Scenario and the No‐Nuclear Scenario. The LNG power plants without CCS act as a bridge technology in all scenarios. Electricity generation from coal without CCS will be entirely phased out by 2050 because of its high carbon intensity. Due to the large‐scale deployment of renewable energy and/or natural gas equipped with CCS, the carbon intensity of electricity falls to nearly zero in 2050 in all scenarios.
Buildings/construction. In the buildings sector, energy consumption should decrease substantially, with final energy demand being reduced by 60–70% below the 2010 level in 2050. Due to electrification and electricity decarbonization, CO
2emissions in the buildings sector (both residential and commercial) will be able to reach almost zero in 2050.
Transport. In the transport sector, CO
2emissions should decline by 82% below the 2010 level in 2050. This can be reached via a 10% decrease of overall passenger mobility as a result of the decrease in population, a 28% increase in total freight mobility and a 22%
decoupling of freight transport versus GDP. A major driver for this drop in emissions is the
69% reduction of energy demand in aggregate for transport resulting from the spread of
efficient vehicles, leading to 77% and 63% less energy content in passenger and freight
transport, respectively. These efficiency gains are associated with the switch from fossil fuels
11
to electricity and hydrogen. Electrification plays an important role, and electricity accounts for approximately half of the total final energy consumption in the passenger transport sector. In freight transport, electrification in 2050 is relatively moderate because heavy trucking is not assumed to adopt electric vehicles (EV) in this study. However, demand for liquid fossil fuels is substantially decreased thanks to improvements in fuel economy and a switch to hydrogen and natural gas.
Industries. The industrial sector is by far the largest source of residual emissions in 2050, representing almost 60% of energy‐related emissions at that time. This can be explained because fuel demand for high‐temperature heat is hard to replace using low‐carbon sources.
Energy consumption in 2050 can decrease by 35% compared with the 2010 level despite GDP growth, thanks to the deployment of energy‐efficiency measures. However, the improvement of energy efficiency is relatively moderate compared with other sectors, since industrial processes are already efficient in Japan and energy‐intensive heavy industry keeps a substantial share of total industry in 2050.
Investment costs and savings. From 2025 to 2030, annual average investments will reach around 4 trillion yen, or about 0.5%–0.7% of GDP in 2030, with marginal benefits in terms of energy savings in all three scenarios. However, on a longer time horizon, an increase of investment to 6 trillion yen is fully paid back by the energy savings leading to zero or negative costs in the Mixed Scenario between 2045 and 2050. The aggregate result of a very low or even a negative energy system cost is valid in the three scenarios. In the Limited CCS Scenario, average investments will increase compared with the Mixed Scenario, due to additional deployment of renewable energies in the long term, but energy savings are also significantly higher because of lower costs for fossil fuel imports. All deep decarbonization scenarios illustrated a very modest decrease in the average growth rate, leading to an average growth rate of around 0.93% per annum from 2010 to 2050.
3.2. China
3China’s economy has demonstrated unprecedented growth during the period 1990–
2015: annual real GDP has been increasing by approximately 10% on average, surging to the record high levels of 10–14% per year in the early 1990s and mid‐2000s. Industry (including construction) has been a leading sector in annual growth in the early 1990s (up to 23%
growth in 1992), and compatible with the service sector during the period 1997–2013 (8–
16% growth in real terms), and slowing down to around 7% in 2014–2016. Agriculture has been growing at about 3–4% per year on average (in real terms) since 1990. The slower growth rate of GDP (around 7%) is currently considered within the framework of the “new normal” for China in the longer‐term perspective.
The economic growth, demographic situation, urbanization process, the enhanced
3
This section is mostly based on the analysis presented in Teng et al., 2015.
12
capacity of the fossil‐fuel‐fired energy sector, the transportation boom, industrialization, and other factors substantially affected the national carbon emission dynamics. In 2006, China became the world leader in energy‐related CO
2emissions (IEA/OECD, 2015), and now emits about 9 billion tCO
2per year (28% of global CO
2emissions).
According to China’s INDC, its climate change mitigation policy includes the following main targets: peak GHG emissions by 2030; reduction of the carbon intensity of GDP by 60%–65% by 2030 compared to the 2005 level; a rise in the share of non‐fossil fuel primary energy (including nuclear, renewables, and hydro) to approximately 20% by 2030; and an increase in the stock of forests by 4.5 billion cubic meters by 2030 (China, 2015).
Deep decarbonization for the country is considered as a huge challenge that may conflict with on‐going development goals. China’s CO
2emissions per capita gradually increased from 1.9 to 6.6 tCO
2in 1990–2013 (IEA/OECD, 2015).
The general assumptions for the decarbonization scenarios include:
2010 2050 2050/2010
Population (million people) 1,341 1,353 101%
Real GDP per capita (2010 US$ per capita) 4,604 29,270 636%
Urbanization rate 49.3% 75% 152%
The deep decarbonization pathway was modeled with regard to the acceleration of economic structural evolution, the effective control of service demand, the promotion of low‐carbon energy development (including natural gas and non‐fossil fuels), and the deployment of low‐carbon technologies such as carbon capture, utilization, and storage (CCUS) while maintaining economic growth.
Primary energy consumption is expected to reach 4,610 MToe by 2040 (1.86 times the 2010 level) and stabilize at 4,358 MToe by 2050. The industrial sector is projected to remain the largest end‐use energy consumer over the whole period; its final energy consumption will increase by 39% by 2050 compared to 2010. Transportation and buildings will experience rapid growth in energy demand, with final energy consumption in 2050 increasing by 130% and 92%, respectively, from 2010 levels (Teng, 2015).
Energy sector. In the deep decarbonization scenario, electricity will gradually become a major energy source with a tripling of electricity consumption to 11,772 TWh by 2050, and the electrification rate reaching 34% in 2050. The electrification rate should rise from 18% in 2010 to 34% in 2050. Non‐fossil fuel electricity will be predominant due to the continued rapid growth of wind and solar, and the steady growth of nuclear and hydropower. Such targets correspond to the national commitments to reach 15% and 20% in primary energy consumption in 2020 and 2030, respectively, with further acceleration after 2030.
Coal use is projected to reach a maximum of around 4.1 billion tonnes around 2020 and
13
to stabilize by 2030 with a further decrease afterwards. The share of non‐fossil power in total power generation rises from 20% in 2010 to 34% in 2020, 43% in 2030, and 72% in 2050. The installed hydropower capacity is projected to reach 500 GW; nuclear capacity is expected to grow to 320 GW; wind power capacity can reach 1,200 GW, and solar power capacity over 1,200 GW in 2050. The use of CCS technologies is very important for China:
about 75% of the coal‐fired power plant capacity will apply them, and the annual storage of CO
2should reach 1.8 GtCO
2.
Other sectors. Industrial emissions should decrease by 52% below the 2010 level by 2050, but this sector will remain the largest source of emissions (53% of the total). Emissions from the transportation sector will increase by 67% over the period 2010 to 2050, although electric and fuel‐cell vehicles are expected to be commercialized by 2030 and to account for 60% of the passenger car stock in China in 2050, with electricity consumption in transport growing 20‐fold by 2050. Emissions in the building sector will decrease by 30% by 2050.
The analyzed scenarios show that CCS transformation toward deep decarbonization of national economies is feasible and its goals can be aligned with development priorities, such as: 1) reduction of national energy consumption; 2) improvement of the energy structure; 3) limiting coal consumption and advanced control of its use; 4) increase of natural gas and non‐fossil fuel energy sources to 35% of TPES; 5) stabilizing production of energy‐intensive products after 2020; 6) improved energy efficiency, and more efficient and cleaner industrial production; and 7) high energy‐saving standards for new buildings and for public consumption.
In the deep decarbonization scenario, China’s energy‐related CO
2emissions will increase to a peak level of 11.5 GtCO
2by 2030 with a gradual decline to 5.2 GtCO
2by 2050 (37%
below the 2010 level). Although this is a very ambitious scenario, it does not lead to the 50%
emission reduction below the 1990 level that is consistent with the “2°C target”.
3.3. Russia
4Russia is the biggest country in the world by land area, and occupies 1.6 billion hectares.
It has the largest forest area in the world, covering 871 million hectares (51% of the country’s territory) or 20.1% of the global forested area. In terms of the share of global wood reserves, Russia is second after Brazil, with 81.5 billion cubic meters (approximately one‐quarter of global reserves). The agricultural land area is 220.6 million hectares (10% of global plowed land).
From 1990, national GHG emissions (excluding land use and forestry) declined by 29%:
from 3,940 MtCO
2e in 1990 to 2,812 MtCO
2e in 2014, primarily due to the deep restructuring of the Russian economy after the crisis in the 1990s, structural and
4
This section is mostly based on the analysis presented in Deep Decarbonization Pathways Project, 2014; Safonov, G.
et al., 2016; and Safonov, G., Stetsenko, A., and Shishin, M., 2016.
14
technological changes in industrial production (a decline in the military sector, heavy industries, and the modernization of the technological base), and the growth of low‐carbon sectors (services rose from nearly 20% to over 50%).
Fossil fuels extraction, transportation, and consumption constitute the leading source of GHG emissions in the country. In 2014, GHG emissions from the energy sector amounted to 2,355 MtCO
2e (84% of total GHG emissions), including fuel combustion (51%) and fugitive methane emissions (33%). CO
2emissions predominate in total GHG emissions, totaling 59.5% in 2014. The land use and forestry sector is very important for the country. Carbon sequestration in the LULUCF sector stood at 513 MtCO
2of net‐removals in 2014.
The economic modeling of Russia’s CO
2emissions was carried out for power and heat production, industries (metallurgy, cement, chemical and petrochemical), residential and commercial buildings, and transportation.
The general assumptions for the decarbonization scenarios included:
2010 2050 2050/2010
Population (million people) 142 120 96%
Real GDP per capita (2010 US$ per capita) 13,169 40,833 243%
Real GDP (2010 US$ billion) 1,870 4,900 262%
Total primary energy supply (million tce) 700 521 74%
Final energy consumption (million tce) 561 448 80%
The targeted emission level for decarbonization scenarios was set as 1.7 tCO
2per capita by 2050 (84% below the average level of 10.8 tCO
2per capita in the period 2010–2013). The analysis was based on the RU‐TIMES model developed by a research team from RANEPA and the Higher School of Economics.
The main decarbonization scenario showed a sharp decline in energy‐related CO
2emissions from 1,422 MtCO
2in 2010 to 200 MtCO
2in 2050. Reaching this goal will require a decline of the TPES by 27% during 2010–2050, while the structure of energy production will substantially change: coal use must drop down to 3% of the TPES (half of it with CCS);
natural gas should reach 36% of the TPES (half of it with CCS); petroleum will decline to 7%;
and the share of renewables should rise to 33% and nuclear to 22%.
Final energy consumption (FEC) declines from 20 EJ in 2010 to 15 EJ in 2050, and should also be transformed substantially: coal use decreases to 2%; gas to 23%; and liquid fuel (including biofuels) will be 17% of FEC. The share of renewables, except large hydro, in the energy balance must rise to 10% in 2050 from nearly 0% in 2010.
The electric power sector is key in the decarbonization of the Russian economy. The
Russian electric power sector has 700 heat and power plants (mostly combined). The total
installed capacity totals approximately 255 GW, of which the zero‐emission capacity includes
15
46 GW from hydro and 23 GW from nuclear power plants. However, only about 150 GW of that capacity is used at peak times.
The envisaged retirement of the majority of natural gas and coal‐fired power plants and boiler houses (70% of which are over 40 years old) in the coming decades constitutes a huge challenge for the industry, as well as unique opportunities. Modernization based on up‐to‐date highly efficient technologies, primarily with carbon‐free options, would not only improve energy efficiency, but substantially reduce GHG emissions in the sector in the long‐term perspective. Otherwise Russia may get into the carbon lock‐in situation, where newly installed fossil fuel‐based energy facilities would have to operate for 40–50 years, sustaining the industry’s high carbon footprint.
A range of long‐term development options are envisaged to decarbonize the domestic power sector, including the possible increase of nuclear and large hydropower (planned by the “Rosatom” and “RusHydro” corporations, but lacking investment resources currently) as well as a growth of renewables’ share in the energy mix. The analysis showed that the growth of renewables can primarily be made in wind and solar PV, while small hydro, tidal, and geothermal may play a more modest role in the overall national energy mix (although being very important for local energy supplies).
Based on the IEA technology perspectives review (IEA, 2014), it is assumed that CCS can be commercially feasible and applicable in the power sector beyond 2030. Most of the fossil fuel‐fired power plants will use CCS technology by 2050 to achieve the deep decarbonization target in Russia.
Industry. The output of energy intensive industries is expected to grow significantly over the next four decades, by 26% for iron and steel production (from 66 Mt to 83 Mt), by 41%
for cement (from 49 Mt to 69 Mt), and by 10% for others. Improvements in iron and steel production can lead to a more than 33% energy efficiency improvement, mainly due to the adoption of blast‐furnace gas recycling technologies for directly reduced iron by natural gas.
The processes of other energy‐intensive industries are very diverse, and a moderate decarbonization potential for the remaining industries is considered, mainly by means of electrification of the industries and improvement in energy efficiency.
Buildings/construction. The commercial and residential housing sector has enormous potential for energy efficiency improvement in Russia. 75% of the heat supply is provided by centralized heat pipeline networks, 70–80% of which are currently fully amortized. The decarbonization scenario assumes a 30% growth in living space area per capita by 2050 (growing close to the EU average living space). The decline of population by 2050 will be an important factor in this sector. The energy consumption of buildings is assumed to decline by at least 6 times, while the energy mix should change in favor of biomass, electrification, and the extensive use of heat pumps.
16
Transport. The low‐carbon technology options for transport include liquefied petroleum gas (LPG) engines in the mid‐term and increasing biofuel use in the long‐term. Electric vehicles are experiencing much slower expansion in Russian regions with cold conditions, although may get a boost if the technology improves. Plug‐in hybrids with internal combustion engines using LPG or biofuel may be more competitive. Aviation can benefit from biofuel use and energy efficiency improvement. Domestic innovative technologies for the production of second generation liquid biofuels are available, but still not commercialized. Freight transportation is expected to rise by 80% by 2050, and could be decarbonized using liquefied gas in the mid‐term and biofuels in the long‐term, as well as hybrid and electric engines. The largest GHG emitter in this sector is pipeline transport, due to technological energy consumption and methane fugitive emissions.
Forestry and land use. This sector is assumed to play an important role in Russian decarbonization strategy. Currently, the net‐removal of CO
2is approximately 500–600 MtCO
2.However, due to the over‐maturing of forests, increased timber harvesting, forest wild fires, and plant diseases, CO
2removal is expected to decline to 100 MtCO
2in the 2040s. Therefore urgent forest management and adaptation policies and measures are required to maintain the carbon sequestration capacity of Russian forests.
3.4. The ROK
5The ROK’s economic development has demonstrated spectacular results in recent decades: from one of the poorest countries in the world, the ROK became a high‐income country ranked in the most advanced countries in the OECD and G20. It remains a fast growing country globally. With almost no endowment of natural resources and a relatively small territory, the ROK effectively implemented an export‐oriented strategy for economic development and has now become the seventh largest exporter and seventh largest importer in the world.
The structure of the ROK’s economy is represented as follows: agriculture 2.6%, industry 39.2%, and services 58.2% (as of 2010). The ROK’s economy is heavily dependent on fossil fuels (85% of the TPES
6). 97% of fossil fuel is imported in the country. Nuclear energy accounts for 13% of the total primary energy supply (as of 2010).
The ROK demonstrated substantial and fast growth in GHG emissions: from 260 to 637 MtCO
2e during 1990–2012 (including LULUCF), which constitutes a 2.5‐fold increase. In 2012 the GHG emissions from fuel combustion reached 600 MtCO
2e (87% of total emissions, excluding LULUCF). The net carbon sequestration in forestry and land use amounted to 50 MtCO
2e in 2012. Power generation and industry have been the main sources of
5
This section is mostly based on the analysis presented in the chapter on the ROK by Young Soogil et al in Deep Decarbonization Pathways Project, 2014 .
6
TPES stands for “total primary energy supply”.
17 energy‐related carbon emissions.
The country launched a number of policy initiatives aimed at green economic development and climate change mitigation. In 2008 the ROK government launched the National Strategy for Green Growth (2009–2050), supported by the first Five‐Year Plan for Green Growth (2009–2013). These long‐term plans have three main objectives: 1) climate change mitigation and enhancing energy independence, 2) enhancing new incentives for economic growth via investments in green technologies and industries, and 3) improving environmental performance and the “greening” of transport, lifestyles, and expanding the modern service sector by 2050. The subsequent second Five‐Year Plan for Green Growth (2014–2018) focused on specific GHG emission reduction measures, a sustainable energy system, and adaptation to climate change.
The Framework Act on Low‐Carbon, Green Growth (April 2010) set a national voluntary target of reducing GHG emissions by 30% below the BAU level by 2020. In July 2011 the government finalized sectoral and annual emission targets. In 2012 the ROK adopted the Act on the Allocation and Trading of Greenhouse Gas Permits and launched the GHG and Energy Target Management System (TMS) for selected sectors. In January 2014 the National Greenhouse Gas Emissions Reduction National Roadmap was announced, followed by the launch of a nationwide Emission Trading Scheme in 2015, which covered 525 business entities (68% of national GHG emissions).
The ROK’s INDC provided a national target of reducing GHG emissions by 37% below the BAU level by 2030 (536 MtCO
2e, 106% above the 1990 level). In the longer term perspective, the ROK considers this 2030 target consistent with the global target of a 40–70% emission reduction by 2050 (Republic of Korea, 2015).
Analysis of the decarbonization pathways was based on the following main assumptions:
2010 2050 2050/2010
Population (million people) 50 48 96%
Real GDP per capita (2010 US$ per capita) 20,159 49,000 243%
Share of industries in GDP 27.2% 35.3% 130%
With the global benchmark of 1.7 tCO
2per capita in 2050, the illustrated decarbonization pathway for the ROK’s economy requires an 85.4% reduction of energy‐related CO
2emissions: from 560 MtCO
2in 2010 to 82 MtCO
2in 2050.
7Energy sector. A drastic decrease in energy consumption (−37.2% of final energy consumption) was found possible via wide‐scale improvements in energy efficiency and changes in the fuel mix: oil and coal use must be almost completely phased out over that
7