• 検索結果がありません。

Clinicopathological Significance of FOXP3 Expression in Esophageal Squamous Cell Carcinoma

N/A
N/A
Protected

Academic year: 2021

シェア "Clinicopathological Significance of FOXP3 Expression in Esophageal Squamous Cell Carcinoma"

Copied!
10
0
0

読み込み中.... (全文を見る)

全文

(1)

Clinicopathological Significance of FOXP3 Expression in Esophageal Squamous Cell Carcinoma

Yusuke W

ADA1,2)

, Yuko D

ATE1)

, Nobuyuki O

HIKE1)

, Genki T

SUKUDA1)

, Kunio A

SONUMA1)

, Toshio M

OROHOSHI1)

, Kentaro M

OTEGI2)

, Takeshi Y

AMASHITA2)

, Tomotake A

RIYOSHI2)

,

Satoru G

OTO2)

, Koji O

TSUKA2)

and Masahiko M

URAKAMI2)

Abstract : The expression of transcription factor forkhead box protein 3 (FOXP3) , a master control gene for regulatory T cells, has been reported to influence patient survival. However, there have been few reports of the relationship between FOXP3 positive cells and esophageal squamous cell carcinoma (ESCC) . The aim of this study was to clarify the prognostic value of FOXP3 expression in ESCC.

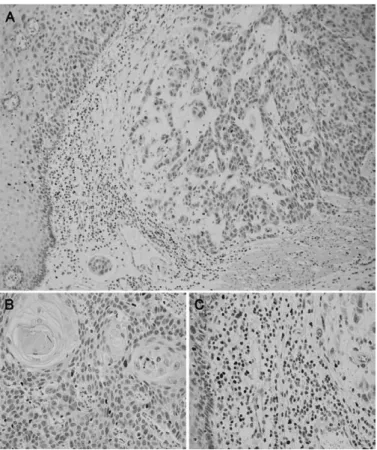
Ninety-five patients who were diagnosed with primary ESCC and underwent sub- total esophagectomy during 2009 and 2010 were retrospectively analyzed. Deepest sections from each tumor were selected for immunohistochemistry and the number of FOXP3 positive cells was counted. The median number was used as a cutoff to divide into FOXP3 positive and FOXP3 negative subgroups. Relationships between FOXP3 expression and clinicopathological features, disease-free survival

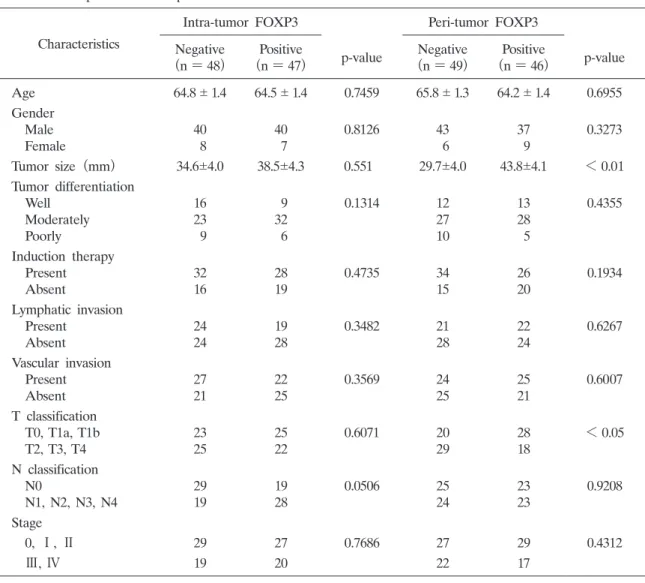
(DFS) and overall survival (OS) were determined. Statistical values of p < 0.05 were considered significant. FOXP3 positive cells were found in all 95 cases and the number of FOXP3 positive cells was significantly higher in the peri- tumor compartment than in the intra-tumor compartment (p = 0.0006) . For this reason, the peri-tumor compartment numbers were used for all of the association studies. Results showed that the FOXP3 positive group had a significantly larger mean tumor size (43.8 4.1 mm vs 29.1 4.0 mm, p = 0.0055) , and the FOXP3 negative group had a significantly higher percentage of deep invasion (T2, T3, T4)

(p = 0.0399) . There was no significant association for DFS, however, for OS the FOXP3 positive group demonstrated a significantly better prognosis (p = 0.0024) . Multivariate analysis showed that peri-tumor FOXP3 expression is an independent prognostic factor for OS (p = 0.0035) . Peri-tumoral FOXP3 expression is an inde- pendent and favorable prognostic factor for ESCC.

Key words : FOXP3, esophageal cancer, squamous cell carcinoma, immunohistochem- istry, prognostic factor

Original

1)

Department of Pathology, Showa University School of Medicine, 1—5-8 Hatanodai, Shinagawa-ku, Tokyo 142-8555, Japan.

2)

Department of Surgery, Division of General and Gastroenterological Surgery, Showa University School of Medicine.

(2)

Introduction

 Tumor-infiltrating lymphocytes (TILs) may play an important role in the host immune response to cancer in the tumor microenvironment. Many studies have shown a clear associa- tion between TILs and patient survival in several types of human cancers. Regulatory T cells, in particular, have been reported to inhibit the antitumor response in mice

1,2)

and the depletion of regulatory T cells can result in an effective antitumor response

3,4)

. Additional studies report that the regulatory T cell population is increased in peripheral blood and tumor tissues in patients with different types of human cancer

5-8)

.

 In 2003, the transcription factor forkhead box protein 3 (FOXP3) was reported to be a mas- ter control gene for thymically derived naturally occurring regulatory T cells

9)

. Since then, many studies have shown an association between a high density of tumor-infiltrating FOXP3 positive cells and poor prognosis in various human cancers. These include ovarian

7)

, pancreatic

10)

, lung

11)

, and hepatocellular carcinomas

12)

. In contrast, other studies have found that a high density of tumor-infiltrating FOXP3 positive cells may be associated with improved patient survival in colorectal cancer

13)

.

 There have been few reports describing the relationship between tumor-infiltrating FOXP3 pos- itive cells and esophageal squamous cell carcinoma (ESCC) and the issue remains controversial.

Yoshioka et al suggested that the number of tumor-infiltrating FOXP3 positive regulatory T cells is not a predictive factor for patient survival in ESCC

14)

, whereas Xue et al reported that the expression of FOXP3 in ESCC closely correlates to lymphatic invasion and pathological stage.

They concluded that FOXP3 expression might play an important role in cancer progression

15)

. The aim of this study was to clarify the prognostic value of FOXP3 expression in ESCC.

Methods

Patients and specimens

 A series of 100 consecutive unselected patients who were diagnosed with primary ESCC and underwent video-assisted thoracic subtotal esophagectomy during 2009 and 2010 at the Depart- ment of Surgery, Division of General and Gastroenterological Surgery, Showa University School of Medicine, were retrospectively analyzed. Five cases that underwent subtotal esophagectomy after endoscopic submucosal dissection (ESD) were excluded from the current study. All of the surgically obtained tumor tissues were stained using hematoxylin-eosin and the histopathologic classification and grade were determined according to the Japanese Classification of Esophageal Cancer (10

th

edition, April 2008, The Japan Esophageal Society) . The clinicopathological data for each patient was recorded and filed at the Department of Pathology, Showa University School of Medicine.

Follow-Up

 The most recent collection of data to determine disease-free survival (DFS) and overall sur-

vival (OS) was performed on July 31, 2012. DFS was defined as the interval between the date

(3)

of surgery and recurrence or most recent follow-up. OS was defined as the interval between the date of surgery and death. The diagnosis of recurrence was based on an elevated serum SCC and typical imaging appearance. Patients with confirmed recurrence received further treatment, such as surgery, radiotherapy, chemotherapy (CT) or chemoradiotherapy (CRT).

Immunohistochemistry

 For immunohistochemistry analysis, one of the deepest sections from each tumor was selected for evaluation. Formalin-fixed and paraffin-embedded specimens were deparaffinised and dehy- drated. Monoclonal FOXP3 antibody (clone 236A/E7 ; Abcam, Cambridge, UK ; dilution 1 : 100)

was used. Staining was performed using a fully automated Ventana Benchmark XT slide stainer

(Ventana Medical Systems, Inc., Tucson, Arizona, USA) .

Evaluation of FOXP3 positive cells

 The number of FOXP3 positive cells was counted in each specimen using an optical micro- scope (Olympus Optical Co. Ltd., Tokyo, Japan) . Two scorers were blinded to the clinical information and the mean number of FOXP3 positive cells was determined for each slide. Cells were counted in two different compartments in each tumor : within the intra-tumor compartment, defined as tumor cell nests ; and within the peri-tumor compartment, defined as the stromal region surrounding the tumor cell nests within a distance of 5 mm. In each compartment, FOXP3 positive cells were counted at a magnification of 400 . The median number of FOXP3 positive cells in each compartment was used as a cutoff to divide into FOXP3 positive group and FOXP3 negative subgroups.

Statistical analysis

 Statistical analysis using the Studentʼs t test or the Mann-Whitney U test was performed where appropriate. The Kaplan-Meier method was used to estimate OS and DFS, and differ- ences were compared using the log-rank test. Multivariate analysis of prognostic factors was performed using the Cox proportional hazard model. Values of p < 0.05 were considered statisti- cally significant.

Results Characteristics

 Patient characteristics are shown in Table 1. The study population consisted of 80 males and 15 females, and the mean age was 64.6 years (range 41 to 90 years) . There were 60 cases that received CT using either 5-fluorouracil and Nedaplatin alone, or CRT before the operation. Fif- teen patients had not received any induction therapy.

Immunohistochemistry staining

 Examples of immunohistochemistry staining are shown in Fig. 1. We found FOXP3 positive

cells in all cases. As a control, we also examined a distant compartment. This was defined as a

(4)

normal epithelial stromal compartment sufficiently distant from the tumor nests. Both intra- and peri-tumor compartments expressed significantly higher numbers of FOXP3 positive cells than the distant compartments (p < 0.0001) (Table 2) , and the number of FOXP3 positive cells in the peri-tumor compartment was significantly higher than in the intra-tumor compartment (p = 0.0002) .

Table 1.  Patient characteristics and         clinicopathological parameters

Characteristics n = 95

Age

Mean value SD 64.6 0.9

Range 4.1-9.0

Gender

Male 80

Female 15

Tumor size (mm)

Mean value SD 36.5 2.9

Range 0-165

Tumor differentiation

Well 25

Moderately 55

Poorly 15

Induction therapy

Present 60

Absent 35

Lymphatic invasion

Present 43

Absent 52

Vascular invasion

Present 49

Absent 46

T classification

T0 6

T1a 9

T1b 33

T2 10

T3 32

T4  5

N classification

N0 48

N1 11

N2 27

N3 8

N4 1

Pathological stage

0 15

Ⅰ 20

Ⅱ 21

Ⅲ 34

Ⅳ  5

SD, standard deviation

(5)

Relationship between FOXP3 expression and patient characteristics

 The relationships between FOXP3 expression and the clinicopathological characteristics of the patients are shown in Table 3. In the peri-tumor compartment, the FOXP3 positive group had a significantly larger mean tumor size (43.8 4.1 mm) than the FOXP3 negative group (p = 0.0055) , whereas there was no significant association between tumor size and FOXP3 subgroup in the intra-tumor compartment. Also, in the peri-tumor compartment, the FOXP3 negative group had a high percentage of deep invasive tumors (T2, T3, T4) compared to the FOXP3

Fig. 1.  Representative immunohistochemical staining A) Tumor nests (intra-tumor compartment) and surrounding

stroma (peri-tumor compartment) (40 magnification) . B) FOXP3 positive cells in the intra-tumor compartment

(400 magnification) .

C) FOXP3 positive cells in the peri-tumor compartment

(400 magnification) .

Table 2.  The number of FOXP3 positive cells counted in each compartment.

P-value is estimated by the Wilcoxon matched-pairs signed-rank test.

Compartment Range Mean SD Median p-value

Intra-tumor 1-233 63.6 5.1 50

0.0002

< 0.0001

Peri-tumor 5-413 88.9 7.6 70

Distant stroma 0-161 27.4 2.5 20

SD ; standard deviation

(6)

positive group (p = 0.0399) . Other clinicopathological parameters such as patientʼs age, sex, tumor differentiation, lymphatic and vascular invasion, lymph node metastasis and pathological stage showed no significant differences between subgroups in both the intra- and peri-tumor compartments.

Disease-free survival and overall survival analysis

 Fig. 2 shows DFS for both FOXP3 expression subgroups. There were no significant differences in DFS in either compartment. In contrast, Fig. 3 shows that in OS, the FOXP3 positive group had a significantly better prognosis compared to the FOXP3 negative group (p = 0.0024) .

Multivariate analysis

 Table 4 shows the multivariate analysis which indicates that only peri-tumor FOXP3 expression is an independent prognostic factor for OS (p = 0.0035) . Other factors, such as age, gender,

Table 3.  Relationship between clinicopathological features and FOXP3 expression in intra- and peri-tumor compartments

Characteristics

Intra-tumor FOXP3 Peri-tumor FOXP3

Negative

(n = 48) Positive

(n = 47) p-value Negative

(n = 49) Positive

(n = 46) p-value

Age 64.8 1.4 64.5 1.4 0.7459 65.8 1.3 64.2 1.4 0.6955

Gender

Male 40 40 0.8126 43 37 0.3273

Female  8  7  6  9

Tumor size (mm) 34.6 4.0 38.5 4.3 0.551 29.7 4.0 43.8 4.1 < 0.01

Tumor differentiation

Well 16  9 0.1314 12 13 0.4355

Moderately 23 32 27 28

Poorly  9  6 10  5

Induction therapy

Present 32 28 0.4735 34 26 0.1934

Absent 16 19 15 20

Lymphatic invasion

Present 24 19 0.3482 21 22 0.6267

Absent 24 28 28 24

Vascular invasion

Present 27 22 0.3569 24 25 0.6007

Absent 21 25 25 21

T classification

T0, T1a, T1b 23 25 0.6071 20 28 < 0.05

T2, T3, T4 25 22 29 18

N classification

N0 29 19 0.0506 25 23 0.9208

N1, N2, N3, N4 19 28 24 23

Stage

0, Ⅰ, Ⅱ 29 27 0.7686 27 29 0.4312

Ⅲ, Ⅳ 19 20 22 17

(7)

tumor size, depth of invasion, lymphatic and vascular invasion, lymph node metastasis, pathologi- cal stage, presence or absence of induction therapy, and intra-tumor FOXP3 expression had no significant association with prognosis.

Discussion

 There are many studies evaluating FOXP3 expression by immunohistochemistry in different tissue compartments. Sahar et al evaluated FOXP3 expression in intra-tumor, peri-tumor and dis- tant stromal compartments in human breast cancer, and reported that FOXP3 positive cells were seen more often in distant stromal compartments

16)

. Another study evaluated FOXP3 expression in intra-tumor and peri-tumor regions in hepatocellular carcinoma and reported that the number of FOXP3 positive T cells in the intra-tumor region was significantly higher than that in the peri-tumor region

17)

. In contrast, our study showed a significantly higher number of FOXP posi-

Fig. 2.  Disease-free survival (DFS) rates for intra- and peri-tumoral FOXP3 expression were estimated by the Kaplan-Meier method. The log-rank test was applied to compare between groups.

Fig. 3.  Overall survival (OS) rates for intra- and peri-tumoral FOXP3 expression were estimated by the

Kaplan-Meier method. The log-rank test was applied to compare between groups.

(8)

tive cells in the peri-tumor compartment. This difference may result from differences in methods and evaluation strategies. Previously, only one study has evaluated FOXP3 expression in fresh esophageal squamous cell carcinoma tissue

15)

, however that study did not discriminate between compartments. Our study is the first study to evaluate FOXP3 expression in different tumor microenvironments in ESCC and found higher numbers of FOXP3 positive cells in the peri- tumor compartment.

 Previous studies indicate that FOXP3 expression is significantly decreased after chemo- therapy

18)

. Our study includes 60 patients who underwent either CT or CRT induction therapy.

Our study also showed significantly lower FOXP3 positive expression in the induction therapy group, supporting the previous study. Our additional analysis indicates that prognosis for the FOXP3 positive group was significantly better than for the FOXP3 negative group regardless of the absence or presence of induction therapy (Fig. 4) . However, the mechanism of how induc-

Table 4.  Multivariate analyses and clinicopathological features

Variables Hazard ratio 95% Cl p-value

Age ( 65 vs < 65) (years) 0.333 0.088-1.047 0.0603

Gender (male vs female) 0.884 0.195-6.198 0.8835

Tumor size ( 30 mm vs < 30 mm) 1.424 0.453-4.586 0.5438

Induction therapy (present vs absent) 1.050 0.215-5.729 0.9514

Lymphatic invasion (present vs absent) 1.057 0.243-5.000 0.9416

Vascular invasion (present vs absent) 0.938 0.292-3.101 0.9141

Depth of invasion (T0/T1a/T1b vs T2/T3/T4) 0.702 0.083-13.237 0.7735 Lymph node metastasis (present vs absent) 0.632 0.070-5.715 0.6903

Pathological stage (0/ Ⅰ /Ⅱ vs Ⅲ/Ⅳ) 0.297 0.010-4.740 0.4115

Intra-tumor FOXP3 (negative vs positive) 0.790 0.244-2.542 0.6889 Peri-tumor FOXP3 (negative vs positive) 7.991 1.877-56.516 0.0035 Cl, confdence interval.

Fig. 4.  The FOXP3 positive group had a significantly better prognosis regardless of the absence or presence

of induction therapy.

(9)

tion therapy affects the expression of FOXP3 is still unclear and further study is necessary.

 We also analyzed how differences in induction therapy, such as CT or CRT, affected FOXP3 expression. There were 36 cases of CT, 21 cases of CRT and 3 cases in which the therapy regimen was unknown. Comparing CT and CRT, the CT group had a significantly higher percentage of FOXP3 positive cases and CRT had significantly higher percentage of FOXP3 negative cases in both the intra-tumor (p = 0.0008) and peri-tumor (p = 0.0003) compartments.

However, the differences between CT or CRT did not affect DFS (p = 0.3570) or OS (p = 0.1322) . This result may indicate that CRT has a greater regulatory effect on FOXP3 expression than CT, but still further study is necessary.

 With respect to the relationships between FOXP3 expression and clinicopathological character- istics, our study showed significance in tumor size and the depth of invasion (Table 3) . In the peri-tumor compartment, the FOXP3 negative group had a high percentage of deep invasive (T2, T3, T4) tumors and poorer prognosis in OS, but contrary to our expectations, it had a smaller mean tumor size. We speculate that the reason for this discrepancy is that we did not exclude some cases of so-called superficial spread-type ESCC in this study, and this is reflected in the tumor size.

 The log-rank test revealed that ESCC patients with high numbers of FOXP3 positive T cells in the peri-tumor compartment had a better prognosis. A previous study showed a similar result, but multivariate analysis showed no significance

14)

. In contrast, our multivariate analysis indicates that the density of peri-tumoral FOXP3 positive T cells may be an independent prognostic factor for OS in ESCC. Our literature search indicates that this is the only study to report FOXP3 expression as an improved and independent prognostic factor for esophageal squamous cell carcinoma.

 Although further study is necessary, FOXP3 expression can be used as an independent prog- nostic factor for ESCC ; high numbers of FOXP3 positive T cells in the peri-tumor compartment predict a better prognosis.

Acknowledgements

 The authors gratefully acknowledge the Showa University Research Grant for Young Researchers which supported this study.

References

1) Onizuka S, Tawara I, Shimizu J, et al. Tumor rejection by in vivo administration of anti-CD25 (interleukin-2 recep- tor alpha) monoclonal antibody. Cancer Res. 1999;59:3128-3133.

2) Shimizu J, Yamazaki S, Sakaguchi S. Induction of tumor immunity by removing CD25+ CD4+ T cells: a com- mon basis between tumor immunity and autoimmunity. J Immunol. 1999;163:5211-5218.

3) Sutmuller RP, van Duivenvoorde LM, van Elsas A, et al. Synergism of cytotoxic T lymphocyte-associated antigen 4 blockade and depletion of CD25 (+) regulatory T cells in antitumor therapy reveals alternative pathways for suppression of autoreactive cytotoxic T lymphocyte responses. J Exp Med. 2001;194:823-832.

4) Tanaka H, Tanaka J, Kjaergaard J, et al. Depletion of CD4+ CD25+ regulatory cells augments the generation of specific immune T cells in tumor-draining lymph nodes. J Immunother. 2002;25:207-217.

5) Liyanage UK, Moore TT, Joo HG, et al. Prevalence of regulatory T cell is increased in peripheral blood and

(10)

tumor microenvironment of patients with pancreas or breast adenocarcinoma. J Immunol. 2002;169:2756-2761.

6) Bates GJ, Fox SB, Han C, et al. Quantification of regulatory T cells enables the identification of high-risk breast cancer patients and those at risk of late relapse. J Clin Oncol. 2006;24:5373-5380.

7) Curiel TJ, Coukos G, Zou L, et al. Specific recruitment of regulatory T cells in ovarian carcinoma fosters immune privilege and predicts reduced survival. Nat Med. 2004;10:942-949.

8) Wolf AM, Wolf D, Steurer M, et al. Increase of regulatory T cells in the peripheral blood of cancer patients. Clin Cancer Res. 2003;9:606-612.

9) Hori S, Nomura T, Sakaguchi S. Control of regulatory T cell development by the transcription factor Foxp3. Sci- ence. 2003;299:1057-1061.

10) Hiraoka N, Onozato K, Kosuge T, et al. Prevalence of FOXP3+ regulatory T cells increases during the progres- sion of pancreatic ductal adenocarcinoma and its premalignant lesions. Clin Cancer Res. 2006;12:5423-5434.

11) Peterson RP, Campa MJ, Sperlazza J, et al. Tumor infiltrating Foxp3+ regulatory T-cells are associated with recur- rence in pathologic stage I NSCLC patients. Cancer. 2006;107:2866-2872.

12) Gao Q, Qiu SJ, Fan J, et al. Intratumoral balance of regulatory and cytotoxic T cells is associated with prognosis of hepatocellular carcinoma after resection. J Clin Oncol. 2007;25:2586-2593.

13) Salama P, Phillips M, Grieu F, et al. Tumor-infiltrating FOXP3+ T regulatory cells show strong prognostic signifi- cance in colorectal cancer. J Clin Oncol. 2009;27:186-192.

14) Yoshioka T, Miyamoto M, Cho Y, et al. Infiltrating regulatory T cell numbers is not a factor to predict patientʼs survival in oesophageal squamous cell carcinoma. Br J Cancer. 2008;98:1258-1263.

15) Xue L, Lu HQ, He J, et al. Expression of FOXP3 in esophageal squamous cell carcinoma relating to the clinical data. Dis Esophagus. 2010;23:340-346.

16) Mahmoud SM, Paish EC, Powe DG, et al. An evaluation of the clinical significance of FOXP3+ infiltrating cells in human breast cancer. Breast Cancer Res Treat. 2011;127:99-108.

17) Huang Y, Wang FM, Wang T, et al. Tumor-infiltrating FoxP3+ Tregs and CD8+ T cells affect the prognosis of hepatocellular carcinoma patients. Digestion. 2012;86:329-337.

18) Xu T, Duan Q, Wang G, et al. CD4+ CD25 high regulatory T cell numbers and FOXP3 mRNA expression in patients with advanced esophageal cancer before and after chemotherapy. Cell Biochem Biophys. 2011;61:389-392.

[Received January 11, 2013 : Accepted february 5, 2013]

Table 1.  Patient  characteristics  and             clinicopathological  parameters Characteristics n = 95 Age Mean  value SD 64.6 0.9 Range 4.1-9.0 Gender Male 80 Female 15 Tumor  size  (mm) Mean  value SD 36.5 2.9 Range 0-165 Tumor  differentiation Well
Fig. 1.  Representative  immunohistochemical  staining  A)   Tumor  nests  (intra-tumor  compartment)   and  surrounding
Table 3.  Relationship  between  clinicopathological  features  and  FOXP3  expression  in  intra-  and  peri-tumor  compartments
Fig. 2.  Disease-free  survival  (DFS)   rates  for  intra-  and  peri-tumoral  FOXP3  expression  were  estimated  by  the  Kaplan-Meier  method
+2

参照

関連したドキュメント

The data presented here suggest that SEMA3A has a tumor suppressor function in OPC because our Kaplan–Meier survival analysis showed that low SEMA3A expression significantly

reported that gemcitabine-mediated apoptosis is caspase- dependent in pancreatic cancers; Jones et al [14] showed that gemcitabine-induced apoptosis is achieved through the

NELL1 (a) and NELL2 (b) mRNA expression levels in renal cell carcinoma cell lines OS-RC-2, VMRC-RCW, and TUHR14TKB and control HEK293T cells were analyzed using quantitative

Abbreviations: DSBs, DNA double-strand breaks; ESCC, esophageal squamous cell carcinoma; γ H2AX, H2AX phospho rylation; HDACs, histone deacetylases; HR, homologous

As it is involved in cell growth, IER3 expression has been examined in several human tumors, including pancreatic carcinoma, ovarian carcinoma, breast cancer, and

The present results also provide in situ hybridization evidence that at least chief cells and possibly both chief cells and sustentacular cells of the carotid body express NGF mRNA..

Here, cell surface localization of MT1-MMP and activation of MMP-2 were clearly induced in mesothelioma cells even when expression of integrin 1 was substantially abolished..

 Quantitative analysis by real-time Reverse transcription-polymerase chain reaction (RT-PCR) of chronological change in the expression of hepatocyte growth factor (HGF),