Trade Liberalization and Wage Inequality : The Case of Sri Lanka
著者 KARUNARATNE Hettige Don
出版者 法政大学経済学部学会
journal or
publication title
経済志林
volume 75
number 2
page range 1‑48
year 2007‑10‑15
URL http://doi.org/10.15002/00003079
Trade Liberalization and Wage Inequality:
The Case of Sri Lanka*
Hettige Don Karunaratne**
* The author would like to express his sincere gratitude to Prof. Esho Hideki, former Dean Faculty of Economics, Hosei University, Japan for inviting him to take up a visiting professorship and providing facilities to undertake this study. He would like to express his thanks to the editorial board also.
** V isiting Professor, Faculty of Economics, Hosei University, Tokyo, Japan ,and Professor, Faculty of Management and Finance, University of Colombo, Sri Lanka, e-mail: hdkaru@
yahoo.com
Abstract
The main purpose of this paper is to analyze the impact of trade liberalization on wage inequality in Sri Lanka. For this purpose, both micro and macro level labour income and wage data were used. After explaining the special features of the economy, attempts were made to examine wage trends and causes of inequalities in terms of ownership of firms, gender, occupation, skill levels and sector of production. Mean income of the male legislators, senior officials and managers was two times higher than the national average income and females in the same categories. Generally, real wage increases in exporting sector in comparison to other sectors and number of government employees decline with trade liberalization activities. Sri Lanka has shown contrary situation during the past 30 years.
On the other hand, longitudinal analysis on sectoral wage inequalities indicated an increasing wage gap among the income earners in different economic activities, and also by gender, and skill levels. Male-female wage gap has been widening in many occupational categories that were
1. Introduction
Trade liberalization is one of the influential factors affecting the short- term and long-term behavior of nominal and real wage inequalities in specially developing countries. Although literature on the relationship between trade liberalization and wage inequality has significantly increased since 980s, case studies regarding South Asian countries are still not adequate. Even though the trade liberalization has been practicing some countries in the region since late 970s, long-term data on wages are not widely available. In this context Sri Lanka is a special case. General research papers on income inequality trends in Sri Lanka and their determinants have been published since early 970s, but very limited number appeared on wage inequality. Similarly, there have been many research articles on trade liberalization in Sri Lanka, but very few attempted to present analysis on its impacts on wage inequality. This paper attempts to fill this lacuna.
Sri Lanka implemented trade liberalization policies as the first South Asian country in 978, and since then it has been the most liberalized economy in the region. According to Kelegama (006), there were two associated with tea, rubber, and coconut producing sectors. However, skill level has been recognized as an important factor in determining wage gap in construction sector. Wage behavior has been favorable for strong labour union members, politically influential groups and a limited number of professionals in some fields or industries. Finally, high inflation rate led to decline real wages and that has been acted as another major (push) factor contributing for massive increase of Sri Lankan migrant workers in other countries, regardless of gender, sector, occupation, skill level or professional category of employee in Sri Lanka.
main waves of trade liberalization in Sri Lanka. The first wave of trade liberalization has taken place from 977 to988. The second wave occurred during the period of 988-993. Even after these two waves successive governments have been undertaking privatization, deregulation and various, other free market promotion activities. Therefore, it is worth to investigate how trade liberalization activities influenced on wage inequalities in Sri Lanka during the past 30 years.
Sri Lanka is one of the first developing countries to understand the importance of investing in human resources and promoting gender equality (World Bank, 000, P.). In the transition years following colonial rule, Sri Lankan policy makers introduced a social policy package of free health and education services and subsidized food, which dramatically improved women’s quality of life. Compared to the rest of the South Asia, Sri Lankan women are very well-off, enjoying high life expectancy (74 years), nearly universal literacy, and access to economic opportunities, which are nearly unmatched in the rest of the subcontinent (Asian Development Bank, 999, P. ix). In this regard, it is interesting to evaluate trend of male-female wage inequality in Sri Lanka during the post-liberalized period.
Attempts made to capture this trend by using both formal and informal sector wages during the concerning period.
Sri Lanka came to be known as an exception among developing countries in improving its physical quality of life-achieved by an extensive social welfare programs (providing free education, free health, food subsidies for poor people), which cost between 8 and 0 percent of the GDP from mid- 950s to 980s (Sanderatne, 997). As pointed out by Kelegama (006), these achievements caught the attention of many economists in the late 970s and early 980s. The economic growth versus equality debate Sri Lanka has been analyzed by many of these economists. One school of
4
thought believes that high achievements in basic needs indicators came at a cost to economic growth (Bhalla and Glewwe, 986). The other school of thought believes Sri Lanka achieved a reasonable rate of growth with equity (Isenman, 980; Sen, 98). This debate is often re-visited by economists (Osmani, 994, Karunaratne 000, 004, and 006) and remains far from settled (Kelagama, 006, P.). Therefore, it is worth to investigate what happens to upgraded human capital in terms of financial benefits in Sri Lanka. In this regard, it will be very important to investigate causes of trends and structural changes in wages in Sri Lanka during the past thirty years. This paper fills this lacuna.
Trade liberalization, deregulation and privatization affect the level and trends of wage inequality in developing countries in several ways. First, when government removes quantitative restrictions, tariff briers, and other restrictions on international trade, domestic firms have to face international competition within the domestic markets (so called infant industry argument in standard trade theory) and as a result (at least for a short time period) some firms needs to restructure their employment by reducing workers, re-arranging economic activities and cutting down labour costs.
Usually at the initial period of trade liberalization activities wage inequality increases while generating high unemployment rate in the economy.
Second, majority of state-owned firms are inefficient and ruining on loss due to several main reasons like unbearable number of workers, subsidized- low prices of final products, and political appointments, link-with politicians, and corruptions. When government implements privatization programs, unemployment rises while supply prices of final products of those firms are rising at least during the initial period. Since, many utilities such as electricity gas, water, irrigation, transportation and telecommunication activities, are handling by the state-owned firms in
majority of developing countries, soon after the introduction of privatization programs prices of these services are raising. As a result, inflation rate increases into substantial number at least in urban sector. So it is important to investigate how high inflation rate adversely affected on real wage distribution in developing countries.
Third, when deregulation activities are undertaking first in the trade and financial arena, consumption patterns of the people are subjected to change and inflation rate increases due to sudden increases in the aggregate demand. If nominal wages are not increasing par with the inflation rate, workers tend to unionize and take union actions against relevant authorities. Those activities normally adversely affect on production, productivity, consumption, exports and imports. With respect to labour unionization and labour union actions, Sri Lanka has shown a typical behavior during the liberalized regime rather than the inward-looking policy period. On the other hand if nominal wages are increasing with inflation rate, the economy is getting trap into wage-price spiral inflation and beggar-thy neighbor situation in terms of foreign currency devaluation.
As a result of these reasons, Sri Lanka has endowed slower growth rate in exports while generating long-term deficit in the balance of payment. Since investor confidence has lost due to internal and external shocks, domestic employment creation has been very slow and real wages have come down in some industries. However, if government is acting by implementing right policies in right times, these fluctuations in business cycle can be minimized to at least to a certain extent. Therefore, it is important to understand recent trends in government policies to address those wage inequalities in Sri Lanka.
The aim of this paper is to analyze how trade liberalization, privatization and deregulation programs influenced on wage inequalities in Sri Lanka
6
during the past thirty years. Wage inequality in terms of age, gender, region, skilled level of the employees, place of the work, business ownership, across the time is very important to understand. The data availability is one of the most important issues with respect to inequality studies in developing countries. This paper utilizes two types of data. First, available data in annual reports of the Central Bank of Sri Lanka can be extended to analyze formal and informal sector wage inequalities in Sri Lanka. By using formal sector wages real wage indices have been calculated from 978. It is possible to evaluate real wage differences across the various sub-groups of employment. In addition, wage inequalities in sub-sectors of agricultural sector and construction sector are also analyzed.
Second, data available in the Report of Consumer Finances and Socio- economic Surveys conducted by the Central Bank of Sri Lanka in various years have also used to explain trends and structural changes in Labour income during the past thirsty years.
The outline of the paper is as follows. Section is devoted to introduce the economy of Sri Lanka. Since this paper is writing for a non-Sri Lankan Journal, first, the author wishes to provide a wide understanding on the economy of Sri Lanka. Section 3 summarizes actions taken by the Sri Lankan economy for trade liberalization. Section 4 provides explanation on data and methodology used in the paper. Section 5 analyses the causes behind the trends and structural changes in wage inequalities in Sri Lanka.
Concluding remarks are given in the final section.
2. Introduction to the Economy of Sri Lanka
Sri Lanka has not been a typical developing country since regaining its political independence in 948. It was under the colony of Portuguese
(505-668), The Netherlands (969-798) and British (798-948) over four hundred years. As a result of this long-held colonialism, people, politics and economy of Sri Lanka have been linked to the rest of the world in all the possible ways such as, trade, financial, technology, human capital flows, as well as, terrorism, fine arts, and sports. It has never been a closed economy or away from the international trends of policy changes and behavior of macroeconomic variables.
Sri Lanka has been practicing five star democracy since independence.
All elected governments have endeavored to develop the country and improve the living standard of the people. Two notable features of the Sri Lankan political system have been the welfare bias in policy formation during the 948-977 period and the changes in the government policy depending upon which of the two major political parties was in power. Of the two major political parties, the United National Party (UNP) has been favorable towards outward-looking development policies, while the Sri Lanka Freedom Party (SLFP), along with its leftist coalition members, was favorable to public sector led, inward-looking development policies until late 970s. In this background, failure of SLFP led leftist government policies in mid 970s led to establish strong UNP government with 5/6 parliamentary power in 977. As a result, outward-oriented liberalized trade policies were introduced since December 977. Subsequently, the SLFP has also been supporting growth-oriented, outward looking development policies since mid 980s.
The welfare orientation of government policies was a outcome of factors such as the great depression (99-933), the malaria epidemic, World War II, the Korean war, Terawada Buddhism and cultural influences, the International request for improvement of living standards of Tamils working in Plantation estates, influence from British welfarism, free
8
election system and implementation of three major policies call free education, free health and free nutrition programs throughout the post independence period regardless of differences in industrial and trade policies (See Snodgrass (966), Jayawardena (974), Isenman (980), Oshima (987), Bhalla and Glewwe (986), Jayasundara (986), Bhalla (988), Anand, and Kanbur (99) and Bruton (99), Lakshman (997), Corea (998), and Kalegama (004), for further analysis of these factors).
During the past five decades, Sri Lanka has used various types of welfare and equity oriented policies which varied in their influence. See Karunaratne 997 for more detail explanation of these policies. However, as a result of implementation of state-led social welfare policies in longer period, and freer trade policies since 977, the following features appeared in the economy of Sri Lanka during the past few decades. Apart from those policies, deep-rooted ethnic conflict, natural disasters such as flooding, Tsunami, and drought as well as trends in the world economy and politics have influenced to appear those features in the economy of Sri Lanka.
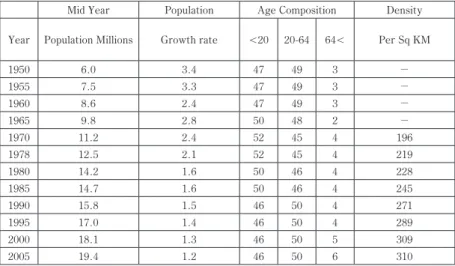
As the first feature of the economy of Sri Lanka, it is possible to understand changing pattern of the total population and its rate of change.
The total population has increased in almost three fold, while population growth rate have come down by /3 during the past 50 years.
Implementation of free education, free health and free nutrition policies as well as adaptation of family planning methods since early 970s led to generate this situation. As shown in the Table . population aging problem has also been emerging due to low birth rate appeared in early period, and changes in age composition of the total population have also influenced this situation. Population density has also increased to a substantial number from 96 persons per squire Kilometer in 970 to 30 in 005.
As the second feature of the economy of Sri Lanka it is important to
understand trends in the labour market and related variables. As shown in the statistics given in Table Total labour force increased from 6 million in 990 to 7.5 million in 006. Total employment rate as a percentage of labour force increased from 84.% to 93.4% in the same period. In other words, unemployment rate decreased from 5.9% in 990 to 6.6% in 006.
This is a remarkable achievement of the economy during the past few years. There were three main reasons behind the sizeable decline in unemployment rate; the first, declining population growth rate since 970s caused to reduce average family size in Sri Lanka and less number of people in the labour force. According to Consumer Finances and Socio- economic Survey data, number of individual per household declined form 5.75 in 963 to 4.3 in 004. This declining trend has been drastic in urban sector. Second reason for considerable decline in unemployment rate has been the increasing foreign employment opportunities for Sri Lankan workers in Middle East countries. For example, estimated number of Sri
Table 2.1 Population in Sri Lanka- 1950-2005
Mid Year Population Age Composition Density Year Population Millions Growth rate <0 0-64 64< Per Sq KM
950 6.0 3.4 47 49 3 −
955 7.5 3.3 47 49 3 −
960 8.6 .4 47 49 3 −
965 9.8 .8 50 48 −
970 . .4 5 45 4 96
978 .5 . 5 45 4 9
980 4. .6 50 46 4 8
985 4.7 .6 50 46 4 45
990 5.8 .5 46 50 4 7
995 7.0 .4 46 50 4 89
000 8. .3 46 50 5 309
005 9.4 . 46 50 6 30
Source: CBSL, Annual Reports of Various Year
0
Lankan workers in foreign countries increased from 70,000 people in 997 to . million in 004. Total number of Sri Lankan migrant workers accounted to 5 percent of total labour force in Sri Lanka in 004. As a result domestic unemployment rate declined in considerable proportion.
Third, reason for this phenomenon has been the increasing labour demand in service sector-led economic activities such as tourism, hotels, restaurant, wholesale and retail trade, transportation, real state, construction, cleaning etc. As observed from the data given in Table ., services sector employment share increased from 33.8 percent in 990 to 43.8 percent in 003 due to rapid expansion of domestic informal services.
Third feature of the economy of Sri Lanka has been the use of alternative policies during the various periods and sub-periods of past fifty-nine years.
Statistics on population, gross domestic production and per capita income with respect to various policy regimes during the post independence period is presented in Table .3. Eventhough population, population growth rate has been decreasing irrespective of the policy regime, as indicated above total population has doubled from 7.5 million in 955 to 5 million in 989.
Sri Lanka could produce only 0 percent of domestic rice requirement when it obtained political independence from United Kingdom in 948.
Under these conditions, the achievement of self-sufficiency in rice production in 980s has one of the most important land marks Sri Lanka reached due to all these policy regimes. The Mahaweli river development scheme, implemented by Sri Lanka governments with help of Japan, United Kingdom, Germany, Canada and Sweden contributed much towards the agricultural development of Sri Lanka.
One of the important characters observed in the economy of Sri Lanka has been the relatively high economic growth rates in out-ward oriented economic policy regimes in comparison to in-ward looking policy regimes.
Table 2.2 Labour Force, Employment and Unemployment in Sri Lanka, 1990-2006 YearTotal Labour Labour Force EmploymentPercentage of Employment by IndustryUnemploy ment Rate- %
Force inParticipation RateAgricultureIndustryServicesTotalMaleFemale NumberRate-%%%%%%%% 990600485.984.47.09.333.85.9.83.4 9958779849.885.34.0.36.34.70.3.0 9958080648.85.44.09.838.4.60.7.9 99360338349.86.4.59.738.83.89.7.7 994607886348.786.939.49.840.73.9.70. 9956063847.987.736.7.4..39.08.7 9966488948.688.737.4.940.6.38.7.7 9976666048.789.539.34.39.60.57.76. 9986660505.790.839.3.936.99.6.54.0 999667348750.79.4.8.84.88.96.73.0 000687350.39.436.03.640.37.65.8.0 0067783448.89.3.63.943.57.96..5 007453850.39.34.4.443.8.86.6.9 00376537648.99.634.03.043.08.46.03. 00480635448.69.733.44.4.48.36.0.8 00575800748.39.330.75.643.77.75.5.9 0067985..93.433.6.340.66.64.99.8 Source: Department of Census and Statistics of Sri Lanka, (990-006) Labour Force Survey
As a result Sri Lanka has been a good case study for a small country argument in the commercial policy regimes. As Sanderatne (005), pointed out a small country with few raw materials, inadequate capital and technology and a very small domestic market, cannot produce quality industrial products at competitive prices. Widespread import substitution can only lead to worse balance of payments problems than those it attempts to solve by such a strategy (P.5). In this respect, economic situation in 970s, provide good example for other small developing countries also.
Fourth feature of the economy of Sri Lankan economy has been the moderate growth rate in Gross Domestic Production during the 950-977 period, and substantial growth rate after the introduction of liberalized trade policies in 977. Even if it is not numerically comparable with economic growth rates appeared in East Asian countries in recent history, achievements were substantial, when someone considers domestic and international problems faced by the Sri Lanka during this period, including domestic civil war and tsunami disaster. Sri Lanka has been the only country reached substantial economic growth while facing civil war in longer period. Statistics on national production related variables are given in the Table .4.
There has been a debate on reasons behind the slow economic growth Table 2.3 Periodization of Development Policy Regimes in Post Independence
History of Sri Lanka Policy
Period Policy Regimes Average growth rate of
Population -% GDP-% Per capita GDP-%
950-55 Colonial Policy .7 4.3 .6
956-65 First Wave of ISI Policy .6 3. 0.6
966-69 Partial Outward-looking Policy .4 5.5 3.
970-77 Second Wave of ISI Policy .6 .9 .3
978-06 Outward-looking Policy .3 4.9 3.6
Source: Ratnayake, P. (004), Lost Opportunities: Sri Lanka’s Economic Relationship with Japan, P.6. and Updated by using Annual Report (006) of the Central Bank of Sri Lanka.
rate appeared in Sri Lanka before 977. Some people believe that implementation of free education policy, free health policy and provision of nutrition subsidies for poor people made additional burden on government budget in Sri Lanka during that period. As a result, government implemented export taxes on primary products and attempts made to regulate income and consumption of the rich people in the country. This situation became worse during the 970-977 period. However, as pointed out by Sen (98) and many others, substantial investment in human capital during this period caused to develop social development level in Sri Lanka in later years. As shown in the Table .5, social development in Sri Lanka is quite impressive during the early stage of development.
One important advantage of the high social development level has been the low population growth rate since early 970s. As a result, first, Sri Lanka has been showing the highest per capita income level among the South Asian countries. Second, according to the World Bank classifications, Sri Lanka was able to move from Low Income Country Group to Lower-middle Income Country Group since 997.
Sri Lanka was the first country to enter into lower-middle country Table 2.4 Economic Growth by Decades and Semi-decades
Decade Annual Average
GDP growth-% Semi decade Annual Average GDP growth-%
95-59 3.0 95-54
955-59 3.9
.5
960-69 4.7 960-64
965-69 4.5
4.8
970-79 3.9 970-74
975-79 .9
4.9
980-89 4.3 980-84
985-89 5.4
3.
990-99 5. 990-94
995-99 5.5
4.9
000-06 4.3 006 7.4
Source: CBSL, Annual Reports of Various Years.
4
category from South Asia. In order to understand these movements, GDP figures for South Asian countries during the past few decades have summarized in Table .6. As we have already discussed one of the most important factors behind the differences in per capita income growth rate among these countries, have been the population growth rate differences.
Sri Lanka recorded the lowest population growth among these countries during the entire post independent period.
Fifth important character of the economy of Sri Lanka is very large services sector while experiencing a declining share of agricultural sector both in terms of output and employment. Table .7 summarizes statistics on sectoral composition of GDP in 950, 977 and 005. Services sector expansion in Sri Lanka has been accelerated since introduction of the Table 2.5 Some Demographic Information about Sri Lanka, Value and Rank of
Human Development Index Year Birth Rate
(per '000) Death Rate (per '000)
Infant Mortality (per '000 Live
births)
Life Expectancy at Birth Male Female
Years
Value of (rank)
HDI
990 0.8 6 9.3 0.694
99 .7 5.8 7.7
99 .5 5.9 7.9 69.5 74.
993 0.8 5.7 6.3 -
994 0.8 5.9 6.9 -
995 9.9 6 6.5 - 0.74
996 9.5 7 7.3 -
997 8.8 6.4 5.9 70.7 75.4
998 8. 6. 4. -
999 8. 6.3 3.4 -
000 8.4 6. 3.3 - 0.735
00 8.9 5.9 . -
00 9. 5.8 . 7.7 76.4 0.740
003 8.9 5.9 . -
004 8.5 5.8 .0 -
005 8. 6.5 .0 -
Source: Source: CBSL, Annual Report, and UNDP, Human Development Reports in Various Years
liberalized trade policies in 977. Agricultural sector share in the GDP has declined from 46.3% from 950 to 7.% in 005. Meanwhile a substantial expansion was recorded in the services sector. Services sector contribution to GDP remarkably increased from 36.9 % in 950 to 55.8 % in 005.
Services sector has not only been the largest sector in the economy, but also has been the main contributor to the GDP growth during the past few years. For example, services sector contributed to GDP growth by 59.3%, while that of Agricultural (4.4%), and manufacturing (36.3%) sectors were less than half of the GDP growth in 005. Wholesale and retail trade item has been the highest contribution sector to the GDP in recent past. (see Karunaratne 003/004. and Kelegama 00 for more details about services sector expansion and its impacts on the economy of Sri Lanka).
Table 2.6 Per Capita GDP in Selected South Asian Countries*, 1990-2005
970 980 990 000 00 00 004
Sri Lanka 83 73 469 88 86 858 ,355
Inda 07 45 36 460 473 478 797
Pakistan 88 86 366 50 467 5 830
Bangladesh 78 44 94 363 364 376 45
Nepal 76 39 98 4 45 4 339
Bhutan - - 73 657 685 740 54
*Since total population of the Maldives is very small, we excluded it from our analysis. All Values are in US$
Source: World Bank, World Development Report publishes in Various Year &
Table 2.7 Sectoral Composition of GDP and Employment*
Sector 950 977 005
. Agriculture 46.3 30 7.(30.7)
. Manufacturing 9.6 8.7 7.0(4.5)
3. Services 36.9 40.6 55.8(44.8)
3.. Wholesale .6
3.. Transportation 5.5
3.3. Real estate & financial .7
*Employment figures are in within brackets.
Source: CBSL, Annual Reports of Various Years.
6
Sixth important character of the economy of Sri Lanka has been the growing regional income inequality since introduction of the liberalized trade policies since 977, and expanding regional diversity of the production structure. In order to elaborate this character, statistics on industrial structure of Sri Lanka by province is presented in Table 8 and land share and population shares by province is presented in Table 9. By using data available from Report on Consumer Finances and Socio- economic Surveys conducted in 003/004, Lorenz curves for nine provinces in Sri Lanka are drawn Figure .. As depicted in Table .8 and .9 almost 50 per cent of GDP is contributing from the Western Province of Sri Lanka and its services sector share was as high as 3 percent of the total production of Sri Lanka. Since labour migration from the Western Province to other countries has been the highest, it is possible to assume that contribution of international migration (through remittances) to regional disparity in production and consumption as sizable one in Sri Lanka. With respect to widening regional income inequalities in Sri Lanka, Karunaratne (007a), and (007b) provide comprehensive analysis.
Table 2.8 Regional and Sectoral Shares of GDP in Sri Lanka, 2004
% Share of Gross Domestic Production
Province Agriculture Industry Services GDP
. Western .68 6.00 3.0 49.70
. Southern 3.47 .67 4.6 9.30
3. Sabaragamuwa .73 .8 .6 6.4
4. Central .83 .54 4.45 8.8
5. Uva .7 0.60 .66 4.4
6. Eastern .5 .30 .94 5.48
7. North Western .47 3.00 4.00 9.47
8. North Central .66 0.33 .96 3.94
9. Northern 0.78 0.8 .75 .7
0. Sri Lanka 9.03 6.4 54.56 00.00
Source: Karunaratne (007b),
Table 2.9 Provincial Land Share, and Population Share in Percentage Province Land
Share Population Share
946 953 963 97 98 996 00 004
Western 5.7 8. 7.3 6.8 6.8 6.4 5.7 8.6 8.4
Southern 8.6 4.4 4. 3.5 3. .7 3.0 . .
Sabaragamuwa 7.8 . .0 0.6 0.3 0.0 9.7 9.6 9.5
Central 8.9 7. 6.6 6.0 5.4 3.5 .7 .9 .9
Uva 3.3 5.6 5.8 6. 6.4 6. 6. 6.3 6.3
Eastern 4.9 4. 4.5 5. 5.7 6.6 7. 7.6 7.9
North Western .0 0.0 0.8 0.9 . .5 .8 .5 .4
North Central 5.5 . 3.0 3.7 4.4 5.7 6. 5.9 5.9
Northern 3. 7. 7.0 7.0 6.9 7.5 7.6 5.6 5.8
Sources: (i). Department of Census and Statistics, Sri Lanka, Various published documents (ii). Central Bank of Sri Lanka(005) Economic and Social Statistics of Sri Lanka
Figure 2.1 Provincial Level Lorenz Curves for Sri Lanka in 2003/2004
0 10 20 30 40 50 60 70 80 90
%of Income100
%Income Receivers
0 10 20 30 40 50 60 70 80 90 100
Western Province Eastern Province Central Province Southern Province Norhern Province Norh Western Province Norh Central Province Uva Province
Sabaragamuwa Province Sri Lanka
Source: Based on Authorʼs Calculations, Data were obtained from Report on Consumer Finances and Socio-Economic Survey published by the Central Bank of Sri Lanka in 2005.
8
Different degrees of changes in industrial structure in difference province after introduction of liberalized trade policies have contributed to increase provincial income inequality in Sri Lanka. In addition, widening regional gap in sources of income has also contributed to this situation.
Seventh important characteristic of the economy of Sri Lanka is that the growth and diversification of the international trade activities during the past few decades. In order to understand trends of total exports and total imports of Sri Lanka during the past five decades, absolute values in US dollar terms have been plotted in Figure .. As shown there in, the both variables have shown remarkable growth since 978. However, the value of imports has been higher than the value of exports after the introduction of open door policies in 977. Widening trade gap has been financed by utilizing remittances from migrant workers, official development assistance
Source: Central Bank of Sri Lanka (2006), Annual Report 2005 Total Exports
1950 0 1000 2000 3000 4000 5000 6000 7000 8000 9000
1955 1960 1965 1970 1975 1980 1985 1990 1995 2000 2005 Figure 2.2 Total Exports and Imports of Sri Lanka in US Dollar Terms
Total Imports
given by some countries and loans obtained from international organizations and some donor countries such as Japan, USA, Republic of China, countries in EU and East Asian region. Promotion of Foreign Direct Investment (FDI) has been one of the main objectives of the trade liberalization programs in Sri Lanka.
However, this was not realized to the expected level due to widely known internal civil war in Sri Lanka, rapidly increasing cost of production, shortage of domestic raw materials, quota issues in garment industry, limited capacity in domestic market, and competition came from the newly liberalized countries such as India, china, Vietnam and Bangladesh.
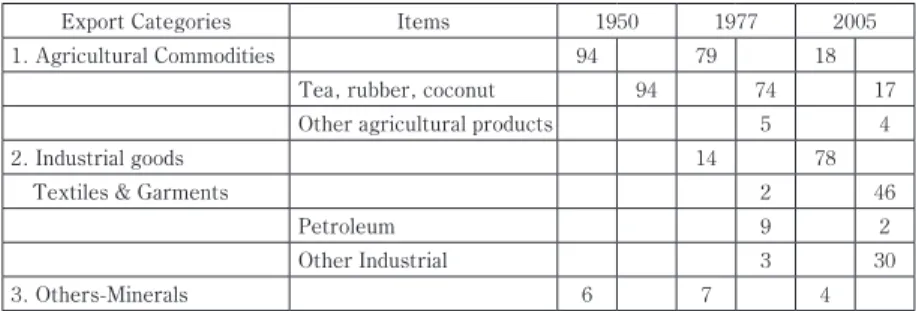
Table .0 and present statistics on export structure of Sri Lanka during the post independence period. Export Structure of Sri Lanka has undergone significant diversification during the concerning period.
Especially, agriculture contributed to 94 percent of total exports in 950 and that has decline to only 7 percent in 005. Eventhough quantity of tea export has been continuously increasing, declining price of primary product in the world market caused to decline agricultural share in the total exports of Sri Lanka. On the other hand category of industrial goods increased from 4 percent to 78 percent from 977 to 005. Rapid expansion of garment
Table 2.10 Export Structure of Sri Lanka, 1950,1 977, 2005 All figures are in percent of total exports
Export Categories Items 950 977 005
. Agricultural Commodities 94 79 8
Tea, rubber, coconut 94 74 7
Other agricultural products 5 4
. Industrial goods 4 78
Textiles & Garments 46
Petroleum 9
Other Industrial 3 30
3. Others-Minerals 6 7 4
Source: CBSL, Annual Reports of Various Years.
0
industry after introduction of trade liberalization policies was the main reason behind this phenomenon.
Expansion of Garments industry in Sri Lanka has vividly captured by Kelegama (004b) as follows:
“Since the late 970s, Sri Lanka’s garment sector has grown rapidly and by 00 the sector contributed approximately 5 per cent of export earnings, 44 percent of industrial output, and provided employment for roughly 6 per cent of total labour force.” (P.6). The expansion of garments industry can be considered as one of the main reasons behind the rapid decline in unemployment rate in Sri Lanka during the past few decades.
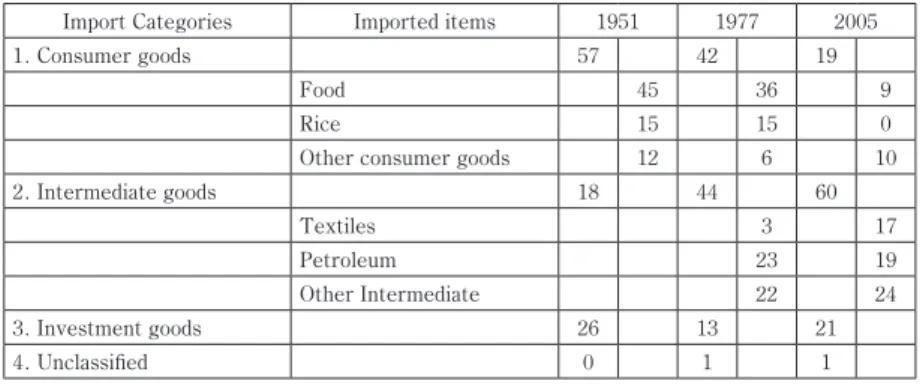
Especially, as we have seen from data given in Table ., female unemployment rate has significantly declined from 3.4 percent in 990 to 9.4 percent 004. Apart from the foreign employment opportunities, garment sector played a crucial role in this regard. However, there are some criticisms with respect to garment sector as high dependency on imported raw materials, lack of linkages with other parts of the economy, and labour exploitation by paying very low wages for females and high wages for white collar workers etc. Table . presents data on import structure of Sri Lanka in selected years from 950 to 005. Import structure of the country has also diversified remarkably during the past fifty-five years. Importation of consumer goods contributed to 57 percent of total imports in 95, and it has come down to the level of 9 percent in 005. Especially, as a result of various agricultural development programs undertaken by the Government of Sri Lanka, domestic production of rice increased to the level of self sufficiency during this period. Meanwhile, importation of intermediate goods such as oil, gas, fertilizer and chemicals for agriculture and row materials for garment industry increased from 8 percent in 95 to 60 percent in 005. This has been mainly due to
increasing domestic crude oil consumption and escalating raw materials importation for garment industries. However, there has been a sizeable fluctuation in importation of investment goods to the country. Importation of vehicles has been the only steadily growing item within the category of investment goods.
Apart from above mentioned characteristics, trends in imports and exports, behavior of trade dependency ratio have shown very peculiar pattern during the post independence period. The total value of exports and imports as a percentage of GDP often cited as trade dependency ratio. Sri Lanka’s trade dependency ration has been declining from 7.4 percent in 950 to 7.7 percent in 97. However, it has been marginally increasing during the 973-977 period. The increase of trade dependency ratio from 36.5 percent in 977 to 68.9 percent in 978 was a remarkable changed achieved by trade liberalization. Thereafter, it was fluctuating and reached the maximum value as 86.6 percent in 000. The openness in Sri Lanka has been widening in year by year during the past few decades. As a result, Sri Lanka became the most liberalized country in South Asia. Therefore, it is
Table 2.11 Import Structure of Sri Lanka 1951, 1977, 2005 All figures are in percent of total exports
Import Categories Imported items 95 977 005
. Consumer goods 57 4 9
Food 45 36 9
Rice 5 5 0
Other consumer goods 6 0
. Intermediate goods 8 44 60
Textiles 3 7
Petroleum 3 9
Other Intermediate 4
3. Investment goods 6 3
4. Unclassified 0
Source: CBSL, Annual Reports of Various Years.
worth to evaluate wage behavior during the past few decades in Sri Lanka.
3. Trade Liberalization and Labour Income Inequality in Sri Lanka
This section is devoted to present an overview of labour income inequality by gender, employment sector, industry and occupation in Sri Lanka in 004. Data available in latest Consumer Finances and Socio- economic survey is used to explain labour income inequality in above- mentioned three dimensions. Data on monthly average income from main occupation by sector and gender in Sri Lanka is given in Table 3.. Trends and causes behind these data were interpreted by the Central Banak of Sri Lanka (005) as follows: “It was seen that in both the formal private sector and informal private sector, the mean income of males was higher and over twice that of females. It should be noted , however, that the male-female difference in the mean income form any sector can be arise due to two reasons, namely, (i). different wages paid for the same job/skill, and (ii).
Different wages paid for different jobs/skills within the same occupation.
Hence the difference in gender-wise mean incomes recorded in even the
Table 3.1 Monthly Average Income from Main Occupation by Employed Sector and gender in Sri Lanka, 003/004
Employment Sector Male Female All Male income as % in Sri Lanka Rupees of Female income
. Government 0,863 9,87 0,463
. Semi government ,635 7,36 0,57 6
3. Formal Private Sector ,805 5,370 9,000 0
4. Informal Private Sector 7,48 3,337 6,406 7
Total 8,370 5,036 7,455 66
Source: Central Bank of Sri Lanka (005) The Consumer Finances and Socio Economic Survey Report 003/004.
government sector, which is an equal opportunity employers and does not discriminate gender-wise in its wages structure, reflected the different levels of jobs handled by males and females in all employment sectors.”
(CBSL, 005, P. 66 and 7).
Table 3. presents data on distribution of income receivers and one month occupation income levels by production sector in Sri Lanka. As depicted in data given in Table 3., income receivers belonging to agricultural sector was 9.4 percent and their average monthly labour income was 4,449 Rupees in 004. However it was only 60 percent of national average income in the same year. Contrary, percentage of income receivers in manufacturing sector was 7.5 and their average income was
Table 3.2 Distribution of Income Receivers and One Month Occupation Income Levels by Production Sector in Sri Lanka in 2003/2004
Production sector % of Income Receivers
Income Receivers Average Income
in Rupees
% of Income From national average income
. Agriculture, Forestry, Fishing 9.4 4,449 60
Agriculture 7.6 4,353 59
Forestry 9.4 6,67 85
Fishing .4 5,84 79
. Industry 7.5 7,33 99
Mining and quarrying .3 6,03 8
Manufacturing 8 7,008 95
Electricity, Gas and water 0.6 5,4 05
Construction 7.5 7,650 03
3. Services 40.6 9,846 33
Trade, Hotels & Restaurants 5.3 0,07 36
Transportation & communication 7.7 9,968 35
Financial services 3 3,63 84
Public administration 4.6 8,77 8
4. Activities not defined .5 3,60 49
All 00 7,405 00
Source: Central Bank of Sri Lanka (005) The Consumer Finances and Socio Economic Survey Report 003/004
4
7, 33 Rupees. It was more or less same value with national average figure.
Interestingly, income receivers belong to service sector represented 40.6 percent while their average monthly income was recorded as 9,846 Rupees in 004. It was a 33 percent of national average monthly income.
Therefore, as a result of trade liberalization workers associated with the expanded service sector were better-off while workers in agricultural sector suffered with low monthly average income in Sri Lanka. Since urbanization and service sector employment rates have been very slowly changing, income inequality has been widening. in Sri Lanka during the past three decades.
Average monthly mean income by gender and occupation category is given in Table 3.3. The highest male-female average labour income gap was recorded among income receivers in occupation category of legislators, senior officials and managers. Male average labour income was more than twice in comparison to female average income in those occupational categories. Further, average labour income of the females in occupation categories in professionals, craft and related works, and elementary occupations has been substantially lower than the males in those categories.
According to above analysis it was possible to understand widening labour income inequality by gender, occupation, and production sector in Sri Lanka. However, above analysis was depended on labour income data available in from the consumer finances and socio-economic data. Since micro-data can be questioned at macro angle, attempts made to use existing macro level time series data to provide a similar kind of analysis in next section. After defining simple concepts relevant to labour, importance of wage income for Sri Lankans is explained in the initial part of the section 4.
The latter part of section 4 presents analysis wage inequality by sectoral
Table 3.3. Distribution of Income Receivers and One Month Labour Income Levels by Main Occupation and Gender in Sri Lanka. 2003/2004 Main OccupationMale FemaleAllMale income
% of Income Receiv
ers
Mean income in Rupees
% of Income Receiv
ers
Mean income in Rupees
% of Income Receivers
Mean income in Rupees
as % of female income
. Legislators, Senior Officials & Managers0.38,40878,59.36,353 . Professionals3.45,99,3505.8,8706 3. Technicians & Associate Professionals5.83,4968,475.8,0764 4. Clerks3.49,887,8954.68,94 5. Service Workers and Sales Workers7.57,98555,486.67,5646 6. Skilled Agricultural & Fishery Workers0.85,4700,7070.64,780 7. Craft and Related Workers5.67,5693,0966.66,543 8. Plant and Machine Operators9.08,73575,0358.57,8773 9. Elementary Occupations3.74,3357,949.84,04447 0. Armed Forces0.6,0600,050.5,050 . Unidentified0.3,690,750.03,960 . All00.08,3005,0900.07,40566 Source: Central Bank of Sri Lanka (005) The Consumer Finances and Socio Economic Survey Report Part , 003/004.
6
industry, occupational and gender at macro level in Sri Lanka.
4. Trade Liberalization and Wage Inequality in Sri Lanka
Wage is defined as a reward for labour in less than one month period, say for hourly basis or weekly basis. If wages are paid on monthly basis, it is called as salaries. However, this paper considers both as wages. There are various concepts relevant to wages in economics. Nominal absolute wage is the widely known simple concept. It is the financial reward for physical or mental labour within a given time period. Although, in modern societies, majority of the people receive wages in nominal terms, some people, particularly in agricultural societies, receive at least part of wages in kind.
When people receive wages in kind, inflationary impact is excluded and it is easy to measure the living conditions by using it. However, for the comparison purposes it is possible to use nominal wages by converting into relative wages. Relative wages can be defined as wages of an individual, a firm or an industry with respect to others. The most common form of comparison is taking place with the real wages, which are calculated by eliminating price increases in the nominal wages. Real wages can be used to compare across the units, place or time.
Nominal wages are determined as a result of individual and collective negotiations between the employees (and their representatives) and, the management (and the owners) of firms. Howere, in public bodies, laws and negotiations decide wages. Firms and organizations pay wages to employees usually depending on working time and/or on results (production made or objectives reached). Nominal wages often depends on occupied position in the organization as well as on education level, cumulated experience and seniority, labour productivity level, profitability of the firm,
sales and employment perspectives of the firm, past and forecasted inflation trends, existing laws, rules and regulations, strength of the labour unions, etc. However, for certain jobs in advanced countries, international levels of wages and immigration may be additional determinants, with a large pool of emigrants being the source of international remittances, on the one hand, and downward pressure on current domestic wages in advanced countries, on the other.
It may be useful to set out why it is essential to investigate wages and earnings in Sri Lanka. First, Sri Lanka as a labour abundant country and it has followed a various types of economic policies during the past fifty-nine years to absorb surplus labour to industrial sector production process. It is important to see how wages have changed for different groups of people during this period. Attempts have been made to investigate wage behavior in terms of industry, male-female, and skill levels in formal and informal sectors during the past decade. Second, since there has been a substantial male-female unemployment rates gap in Sri Lanka during the entire period concerned, it is essential to investigate causes behind the trends of male- female wage inequality by sector and occupation wise in Sri Lanka. Third, trade liberalization policies have been utilizing since 970s in Sri Lanka.
Under these policies, privatization process and deregulation activities have been taking place and foreign investment projects were accepting.
Therefore, it is worth while to investigate the trend, determinants and structural changes in various concepts relevant to wages in Sri Lanka during this period. Finally, since construction sector has been a volatile sector after the introduction of trade liberalization in Sri Lanka, it is important to investigate wage behavior that sector by skill levels, However, lack of literature and micro level data are two main obstacles to undertake rigorous study on wage behavior in Sri Lanka. However, by
8
using available secondary data, this section investigates two dimensions of wage behavior in Sri Lanka. First, wage behavior in formal institutions affiliated to government and private sector in nominal and real terms are investigated. Second, informal sector wage behavior is investigated with the help of selected industries and occupational categories from mid 980s to 005.
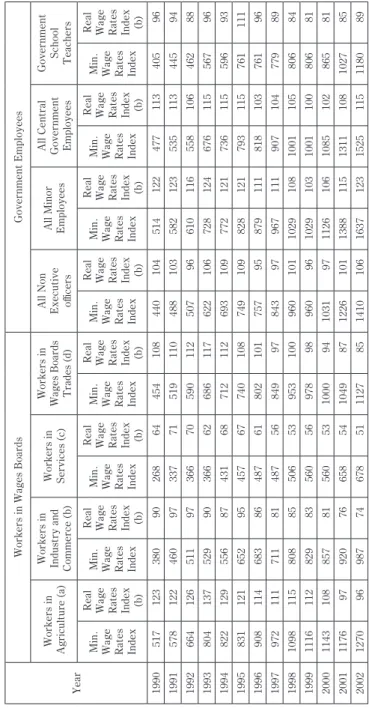
Table 4. presents the data regarding minimum nominal wage index and real wage index for formal sector in Sri Lanka. These data were obtained from the Annual Reports of the Central Bank of Sri Lanka for 990-00 periods. By using these data, the following features of wage behavior can be observed in formal sector in Sri Lanka. First, irrespective of the industry or sector, minimum nominal wages has substantially increased during the post 977 period. As shown in the minimum nominal wage rate columns in Table 4., it has increased more than three times during 990-00 periods. There were several reasons behind this significant growth in nominal wages. First and the most important reason has been the existence of double digit inflation rate in Sri Lanka since 978. This has been due to large expenditure and substantial budget gap in the government sector. On one hand, each and every government budget proposed higher wages for all government sector employees in almost every year, and urged private sector organizations also to be par with government wage increases. On the other hand, as a result of high inflation rate, employees were lobbing for higher wages by taking union actions and subsequently increases in nominal wages led to increase price level repeatedly. As a result of these activities, there has been a nominal wage- price spiral in Sri Lanka during this period. Second, both import prices and import volume have been increasing while export sector recording a very slow growth since later 970s. One of the main reasons for this situation is
Table 4.1 Wage Rate index Number - 1978 December = 100 Year
Workers in Wages BoardsGovernment Employees Workers in Agriculture (a)Workers in
Industry and Commerce (b)
Workers in Services (c)Workers in Wages Boards Trades (d)
All Non Execut
ive officers
All Minor Employees All Central Gov
ernment Employees
Gov
ernment School Teachers
Min. Wage
Rates Index
Real Wage
Rates Index (b)
Min. Wage
Rates Index
Real Wage
Rates Index (b)
Min. Wage
Rates Index
Real Wage
Rates Index (b)
Min. Wage
Rates Index
Real Wage
Rates Index (b)
Min. Wage
Rates Index
Real Wage
Rates Index (b)
Min. Wage
Rates Index
Real Wage
Rates Index (b)
Min. Wage
Rates Index
Real Wage
Rates Index (b)
Min. Wage
Rates Index
Real Wage
Rates Index (b)
990573380906864454084400454477340596 9957846097337759048803583535344594 9966465973667059050796606558064688 99380437599036666867606784676556796 9948955687436876930977736559693 99583659545767740087490988793576 99690846838648768007579587988037696 99797784875684997843979679070477989 998098580885506539530096000908000580684 99968983560569789896096090300008068 000430885785605300094039760608508658 007697907665854049876038853080785 007096987746785785400663735558089 Source: http://www.cbsl.lk/cbsl/index.html