1. Introduction
International experience suggests that rapid urbanization pace and economic growth coin-cide with conversion of land from agricultural sector to industry, infrastructure and residential uses (Ramankutty, Foley & Olejniczak, 2002). Azadi, Ho & Hasfiati (2010) discuss the debate on whether farmland should be maintained or converted to other uses. Such a debate can be
viewed from both pro−rural and the pro−urban perspectives. According to the pro−rural view, farmland acquisition has detrimental impacts in terms of loss of fertile farmland, which threat-ens traditional agricultural livelihoods and food security. As a result, pro−ruralists conclude that farmland should be maintained. Conversely, pro −urbanists argue that farmland conversion is an indispensable corollary of urban growth. In ad-dition, they argue that the decline of agricul-tural production can be solved by applying ad-vanced technology and farming intensification.
Vol.46, No.1, 19-48, 2011
Tuyen, Tran
University of Economics and Business, Vietnam National University, HanoiSteven Lim
1 Economics Department, the University of Waikato, New ZealandFarmland acquisition and livelihood choices of
house-holds in Hanoi s peri-urban areas
Abstract
The relation between land and rural livelihood has been a topic of interest for many researchers and development practitioners. In the context of rising farmland loss due to the escalated urbanization and in-dustrialization in Vietnam’s developed provinces, several researchers have tried to address how farm households respond to farmland loss in peri−urban areas (e.g., Do, 2006 ; Ngo, 2009 ; S. V. Nguyen, 2009 ; Phong, 2007 ; Vo, 2006). However, no studies have quantified the impacts of farmland loss on peri −urban households’ livelihood choices. Using a dataset collected by the lead author from Hanoi’s peri−ur-ban areas in 2008, this paper is the first attempt to apply econometric methods to quantify effects of farm-land loss on households’ activity choices in Hanoi’s peri−urban areas. The results reveal that households have actively adapted to the new context by adopting livelihood strategies based on manual jobs and non −farm self−employment activities. In addition, although larger owned farmland per adult stimulates house-holds to specialize in farming, emerging non−farm job opportunities make rural young workers less inter-ested in farming activities. The paper concludes with some proposed policy implications that may help peri−urban households to effectively change and diversify their livelihoods.
Farmland shrinkage due to urbanization has negative impacts on livelihood strategies that largely or partially depend on farmland or other natural resources. In China, an immense area of farmland has been encroached by urbaniza-tion and such encroachment raises special con-cerns about rural livelihoods.(J. Chen, 2007 ; Deng, Huang, Rozelle & Uchida, 2006 ; Xie, Mei, Guangjin & Xuerong, 2005). Consequently, farmland shrinkage has significantly affected livelihoods of rural dwellers. It is estimated that in China from 1987 to 2000, an amount of culti-vated land equivalent to around 10 million hec-tares was converted for urban development or devastated by natural disasters, and about 74 percent of total urban land was converted from arable land. Every year, this process has in-duced 1.5 million farmers who live in the popu-lous suburban areas to lose their traditional ag-ricultural livelihoods (Tan, Li, Xie & Lu, 2005).
Indian rural households’ livelihoods have faced the challenge of farmland loss on a large scale. Between 1955 and 1985, approximately 1.5 million hectares of farmland were converted for urban sprawl in India (Fazal, 2000). This process resulted in huge impacts on rural liveli-hood in this country. Nevertheless, the scenario seems to be more severe because India’s large population puts great pressure on food supply. To cope with this hardship, technological ad-vances are likely to push up agriculture produc-tivity ; such an increase, however, may be off-set by cropland shrinking and increasing popu-lation. In addition, due to cultivated land de-cline, job generation for rural labour could be a great challenge for the country with around 67% of its total workforce engaging in the agricul-ture sector and about two thirds of the total population living in rural areas (Fazal, 2001).
A large scale study on many African coun-tries suggests that over the past decades, ur-banization and the underperforming industrial sector has been unable to absorb a huge num-ber of rural surplus workers. Meanwhile the in-creasing population density in rural areas has led to a rapid decrease in farmland size per household, posing severe challenges on rural livelihoods (D. F. Bryceson, 1996). A study in South Africa indicates that arable land plays a key role in rural livelihoods. Farmers pursued different land−based livelihood strategies such as arable farming and livestock husbandry. The study concluded that income from farm activi-ties is probably greater than the total of other income sources, including transfers from formal employment and state pensions (Shackleton, Shackleton & Cousins, 2001). Furthermore vari-ous studies point out the role of land in rural poverty eradication and the small and declining farm size is one of the severe constraints that the majority of rural households have already confronted in Malawi (F. Ellis, Kutengule & Nyasulu, 2003), in Tanzania (F. Ellis & Mdoe, 2003) and in Uganda (F. Ellis & Bahiigwa, 2003). A similar reality could be seen in Central America where households with small landhold-ings or landless farm workers have become the most vulnerable group among the rural poor (Siegel, 2005).
non−farm livelihood opportunities for farmers (W. Chen, 1998 ; Parish, Zhe & Li, 1995). In addition, improved infrastructures facilitate pro-ductivity growth and farm product diversifica-tion. The evidence in China shows that a large share of high value farm production is made in urban and peri−urban areas (Xie et al., 2005). In the event of land shortage, infrastructure im-provement and better transportation facilitated rural−urban migration in the Philippines (Kelly, 1999) and Sub−Saharan Africa (Tacoli, 2004). Especially in some parts of Africa and South-east Asia, farmers abandoned their farmland to take up more lucrative non−farm employment in urban areas (D. Bryceson, 1997 ; F Ellis, 2000 ; Kabeer & Tran, 2000 ; Kato, 1994). Therefore, farmland has lost its crucial role in shaping rural livelihood and its role has been gradually replaced by non−farm activities that require education, skills, and networks, rather than farmland endowment.
In Vietnam, the escalating urbanization and industrialization have encroached on enormous areas of agricultural land over the past decade. Nationally, around 500,000 hectares of farmland have been taken for urban expansion, construc-tion of industrial zones and infrastructure, which has affected around 630,000 farm house-holds between 2000 and 2007 (Ministry of Natural Resources and Environment [Monre], 2009). Such a phenomenon has been wide-spread and intense in Vietnam’s developed cit-ies, especially in Hanoi and Ho Chi Minh City. Over the past ten years in Hanoi’s peri−urban areas, urbanization and industrialization en-croached on a huge area of agriculture land. According to the land use plan for the city from 2000 to 2010, 11,000 hectares of land, mainly farmland, have been converted for industrial
and urban development, which caused approxi-mately 150,000 farmers to lose their job (S. V. Nguyen, 2009). In addition, a plan of massive farmland revocation has been making thou-sands of farm households concerned about their future livelihoods. From now to 2020, Ha-noi will be expanded to both banks of the Red river. It is estimated that approximately 12,000 households will be relocated and nearly 6,700 farms will be removed (Hoang, 2009).
village of Hanoi. Her findings indicate the land loss has resulted in the loss of natural capital in the form of arable land, traditional on−farm skills, food supply and agricultural income re-sources. In addition, to adapt to the new con-text, some households diversified their liveli-hood strategies by utilizing the liveliliveli-hood re-sources such as compensation money, residen-tial land, human capital, and other assets. Be-sides, the high but unstable income from wage −employment is becoming the main income source for many households. Her research re-veals that compensation money of agrarian loss was emerging as a big financial capital which helps land losing households cope with shocks and engage in profitable non−farm activities.
Results from other related studies (e.g., D. M.
Nguyen, 2008 ; Q. V. Nguyen, Nguyen,
Nguyen, Pham & Nguyen, 2005) indicate that farmland conversion for urban expansion has been bringing about positive changes in rural livelihoods. A recent report on the impact of ur-banization on agriculture in Hanoi indicates that beside the negative influences, urbanization cre-ates economic favorable conditions for peri−ur-ban households. Many farmers who live near in some newly urbanized areas have been receiv-ing better livreceiv-ing conditions thanks to improved infrastructures, and chances for higher cash−in-come jobs. Many land losing households en-gage in non−farm jobs in industrial zones and urban areas, earning higher and more stable in-comes (Q. V. Nguyen et al., 2005). During the past decade in Hanoi, farmland shrinkage has been accompanied by urban expansion to pe-ripheral zones of the city, bringing about a host of opportunities for peri−urban households to improve their livelihoods. In a study on the ru-ral−urban linkages in a Hanoi village, Nguyen
(2008) found that the majority of households took full advantage of urbanization to improve their livelihood and reduce their dependence on farmland. Many households pursued liveli-hood strategies based on nonagricultural activi-ties or diversification. Such livelihood strategies allow households to utilize their assets in non− farm activities with higher incomes than agri-cultural activities. Another case study of house-hold livelihoods in a peri−urban commune of Ho Chi Minh City (Vo, 2006) shows that most agrarian land was converted into non−farm use purposes, especially for industrial zones and residential land. Farmers there changed their mode of cultivation to adapt to the new context. A popular feature of the conversion, which can be easily observable, is a switch−over from the paddy cultivation to husbandry and horticulture. In addition, the non−farm activities were in-creasing in company with accelerated urbaniza-tion and industrializaurbaniza-tion. Accordingly, such lu-crative non−farm jobs in industrial and commer-cial sectors no longer make the young rural generation interested in farming activities.
The above discussion suggests that farmland acquisition has caused mixed impacts on rural livelihoods. So far, although there have been a few studies that investigate farmland loss and its impacts on peri−urban households in Viet-nam, no study has quantified the various im-pacts of farmland revocation on household live-lihood choice. This gap in the current literature has motivated us to conduct a study to answer the following questions : First, what are the current livelihood strategies of households in Hanoi’s peri−urban areas? Second, what are the impacts of the farmland acquisition on households’ livelihood strategy choices?
section presents the research design which de-scribes the conceptual framework for analysis, the background to the research site and data collection, statistical procedures for cluster analysis, and the specification of the economet-ric model. Section 3 reports empieconomet-rical results from the econometric analyses. A discussion is presented in Section 4, and the final section concludes with some policy implications.
2. Research design
2.1. Analytical frameworkUp to now, there have been a growing num-ber of livelihood studies using “the sustainable livelihood approach” as a framework of analysis (e.g., Alwang, Jansen, Siegel & Pichon, 2005 ; Babulo et al., 2008 ; F Ellis & Bahiigwa, 2003 ; IFPRI, 2006 ; International Food Policy
Re-search Institute [IFPRI], 2000 ; Siegel, 2005 ; Soini, 2005 ; Van den Berg, 2010). The sustain-able livelihood framework concentrates on households’ ownership of or access to various types of livelihood assets namely human, social, natural, physical and financial capitals (Beb-bington, 1999 ; DFID, 1999 ; Hussein & Nel-son, 1998 ; Reardon Stephen, 1995 ; Scoones, 1998 ; Siegel, 2005). As a result, households’ ability to engage in different livelihood strate-gies depends on their possession of or access to these livelihood assets from which various livelihood strategies are pursued and livelihood outcomes are derived. In fact, many theoretical and empirical studies on livelihood choices have pursued this causal relationship (Babulo et al., 2008).
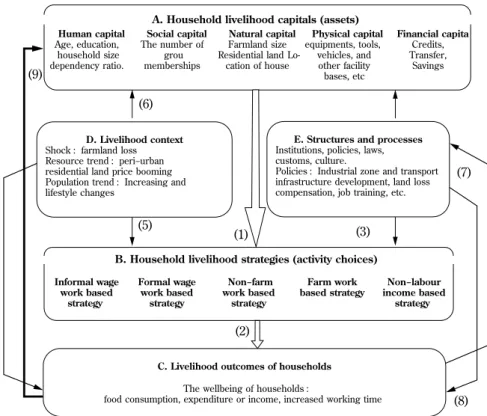
Figure 1 displays the analytical framework Figure 1 : Conceptual framework for analysis of Hanoi peri-urban household livelihoods
Financial capita Credits, Transfer, Savings Physical capital equipments, tools, vehicles, and other facility bases, etc Natural capital Farmland size Residential land
Lo-cation of house Social capital The number of grou memberships Human capital Age, education, household size dependency ratio.
A. Household livelihood capitals (assets)
D. Livelihood context Shock : farmland loss Resource trend : peri−urban residential land price booming Population trend : Increasing and lifestyle changes
E. Structures and processes Institutions, policies, laws, customs, culture.
Policies : Industrial zone and transport infrastructure development, land loss compensation, job training, etc.
Non−labour income based strategy Farm work based strategy Non−farm work based strategy Formal wage work based strategy Informal wage work based strategy
B. Household livelihood strategies (activity choices)
C. Livelihood outcomes of households The wellbeing of households :
food consumption, expenditure or income, increased working time
that is adapted to the specific context of the study. In this paper, we focus on box B : the determinants of household livelihood choices. As shown in Figure 5, households’ activity choices are determined by their endowments of or access to five types of livelihood assets (ar-row (1)). However, other exogenous factors such as shocks (farmland loss) or locations (households that are located close to towns and industrial zones) may directly affect livelihood choices of households (arrows (2,3)). Accord-ingly, such factors must be taken into account in the model of household livelihood choices. Besides, arrows (4,6) show that such exoge-nous factors may indirectly influence livelihood choices of households through their impacts on household livelihood assets. Similarly, an inter-dependent relationship is observed between livelihood assets and outcomes in the frame-work. Consequently, livelihood assets them-selves are endogenously affected by other ele-ments such as livelihood outcomes or shocks, and policies. The sustainable livelihood frame-work is constituted by dynamic and interde-pendent elements that together influence household livelihood over time. Therefore, given the limitations of cross−sectional data, one cannot address fully the influence of institu-tional and policy processes on other elements in this framework (IFPRI, 2006). Furthermore, based on such data, empirical analyses only ex-amine the static impacts of household liveli-hood assets on liveliliveli-hood choices (Babulo et al., 2008).
In fact, such static models have often been employed for quantifying factors affecting households’ livelihood choices and outcomes by many studies (e.g., Alwang, et al., 2005 ; C. Barrett, Brown, Stephens, Ouma, & Murithi,
2006 ; C.B. Barrett, Bezuneh, & Aboud, 2001 ; International Food Policy Research Institute [IFPRI], 2000 ; Jansen, Pender, Damon, Wiele-maker, & Schipper, 2006 ; Mutenje, Ortmann, Ferrer, & Darroch, 2010 ; Simtowe, 2010 ; Woldenhanna & Oskam, 2001). Following this approach, our study focuses only on static de-terminants of households’ livelihood strategies and outcomes with a particular interest in the context of farmland revocation and rapid ur-banization in Hanoi peri−urban areas.
2.2. Empirical implementation
2.2.1. Research site and data collection
The study was conducted in Hoai Duc Dis-trict − a peri−urban disDis-trict of Hanoi. Prior to 1st
August 2008, Hoai Duc District belonged to Ha Tay province, a neighbouring province of Hanoi Capital, which was merged into Hanoi on 1st August 2008. The district covers 8,247 hectares of land, of which farmland makes up 4,272 hec-tares and 91 percent of this area are used by households and individuals (Hoai Duc People’s Committee, 2010a)2. Administratively there are
20 units under the district, consisting of 19 communes and 1 town. Hoai Duc has approxi-mately 50,400 households with a population of 193,600 people. On a district scale, the propor-tion of employment in agriculture declined by around 23 percent over the past decade. How-ever, a significant share of employment has re-mained in agriculture, accounting for around 40
percent of the total employment in 2009. The corresponding figures for industrial, services sectors are 33 and 27 percent, respectively (Sta-tistics Department of Hoai Duc District, 2010). Before having been a district of Hanoi, Hoai Duc used to be the richest district in Ha Tay Province (Monre, 2007). In 2009, Hoai Duc GDP per capita reached VND 15 million (Hoai Duc People’s Committee, 2010b), which is less than half of Hanoi’s average (32 million versus 15 million) (Vietnam Government Web Portal, 2010)3
.
Hoai Duc is located in the western part of Hanoi, 16 km from Hanoi Centre. The district is surrounded by various important roads such as Thang Long highway (the country’s longest and most modern highway), National Way 32, and in close proximity to industrial zones, new urban areas and Bao Son Paradise Park (the biggest entertainment and tourism complex in North Vietnam). In such an extremely favour-able location, a huge area of farmland in the district has been taken for above projects in re-cent years. In the period 2006−2010, around 15,600,000 m2
of agricultural land have been re-voked for 85 projects (LH, 2010)
A questionnaire is designed to collect quanti-tative data on livelihood asset holdings (differ-ent types of capitals : human, social, financial, physical, natural capitals), economic activities (data on time allocation for activities) and liveli-hood outcomes (income and expenditure). The survey with a total number of 480 households was conducted in Hoai Duc District from April to June 2010 in 6 communes using the dispro-portionate stratified random sampling method.
First, 12 communes with farmland revocation were clustered into 3 groups based on their main socio−economic characteristic. The first group was represented by purely agricultural communes ; the second one was characterized by communes with a combination of both agri-cultural and non−agriagri-cultural production and the third one consists of purely non−agricul-tural communes. From each group, 2 munes were randomly selected, yielding 6 com-munes. Then, 80 households in each commune, including 40 households with farmland loss and 40 households without farmland loss, were ran-domly selected, producing a sample of 480 households.
In fact, 477 households were successfully in-terviewed, of which 237 households lost their farmland at different levels. Some lost little, some lost partially and others lost totally. Among farmland loss households, 113 house-holds reported that their farmland was revoked in the early 2009 and 124 households reported having farmland loss in the first half of 2008. These households’ farmland was revoked ac-cording to various decisions issued by Ha Tay People’s Committee in 2006, 2007 and 2008. As a result, around 1,636,000 m2
of farmland in Hoai Duc District had been revoked for various projects relating to the construction of highway, new urban areas and other non−farm use pur-poses in the period 2008−2009 (Ha Tay People’s Committee, 2006, 2007b, 2008b). In the remain-der of this paper, households who lost their farmland by the farmland acquisition are called affected households (AHs) and households whose farmland was not revoked by the farm-land acquisition are called non−affected house-holds (NAHs). In addition, the term “affected households” will be interchangeably used with 3 Exchange rate between VND and USD in 2009 : 1
the term “landloss households” in this study.
2.2.2. Clustering household livelihood strate-gies
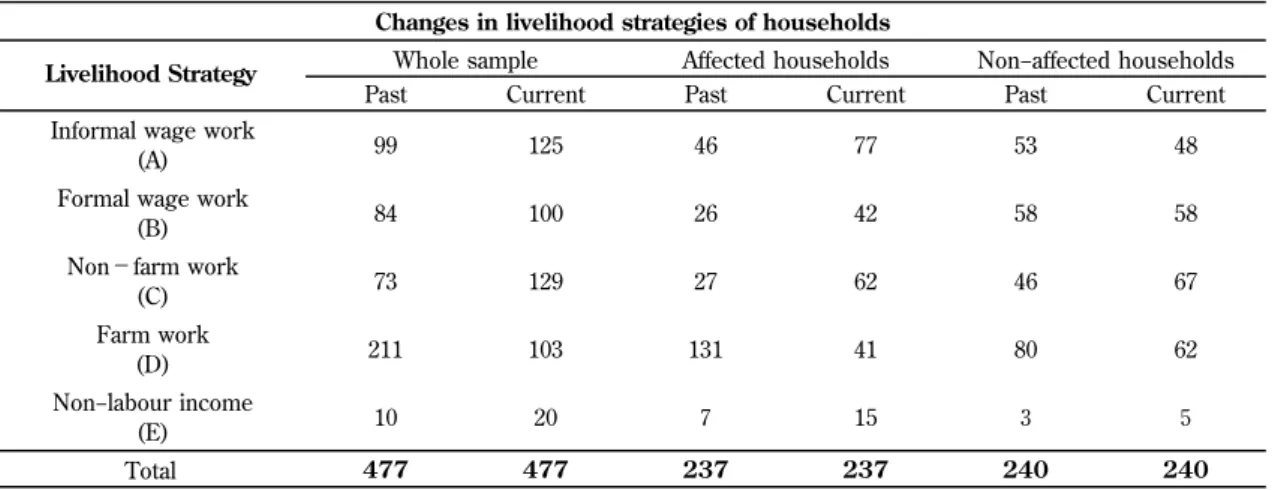
In order to gain an insight into the changes of household livelihoods, the previous and cur-rent household livelihood choices were identi-fied via cluster analysis. Table 1 shows the number of the past and current livelihood strategies that were identified via cluster analy-sis techniques. As shown in this table, four main types of labour−income based strategies were classified before and after farmland acqui-sition. The informal wage work−based strategy is characterized by households who largely de-pend on manual paid jobs as the main income source. The common types of such paid jobs are building workers, carpenters, painters and various kinds of casual paid jobs, which are often hired by individuals, households or some-times enterprises or other organizations with-out labour contracts and unstable income. Households pursuing the formal wage work− based strategy are represented by those who derive income mainly from formal wage work.
Formal wage earners are those who work for state offices, enterprises or other organizations with labour contract and highly remunerated paid jobs. This implies that such jobs requires employees a high level of education or appro-priate vocational skills.
Regarding the non−farm work−based strategy, while about 40 percent of surveyed households reported engaging more or less in non−farm work, 27 percent of them depended on these activities as the dominant livelihood and the vast majority of activities were made up of mi-cro−units with an average size of 1.7 jobs. The majority of business premises are located at households’ own houses or residential land plots which are convenient locations for open-ing a shop, a workshop or a restaurant. Surpris-ingly, about 80 percent of households still re-mained farming but only 22 percent among them derived their main income from this work. Among them many households continued rice cultivation as a source of food supply while oth-ers grew vegetables and fruits to supply for Ha-noi’ urban customers. The popular crop plants include cabbages, tomatoes, various kinds of
Source: Own calculation from author’s survey
240 240 237 237 477 477 Total 5 3 15 7 20 10 Non−labour income (E) 62 80 41 131 103 211 Farm work (D) 67 46 62 27 129 73 Non−farm work (C) 58 58 42 26 100 84
Formal wage work (B) 48 53 77 46 125 99
Informal wage work (A) Current Past Current Past Current Past
Livelihood Strategy Whole sample Affected households Non−affected households
Changes in livelihood strategies of households
beans, water morning glory, oranges, grape-fruits, guavas, etc. The majority of animal hus-bandry is undertaken by pig or poultry breed-ing small−size farms or cow grazbreed-ing households. However, this activity has been significantly shrunk due to the spreading cattle diseases in recent years.
Finally, the number of households depending on transfers as the dominant livelihood doubled after the farmland acquisition but this number accounts for a negligible proportion (about 4 percent of the sample). Households following this strategy have a very small size and high dependency ratio, consisting of very old and less well−educated members. Majority of them are landloss elderly farmers and live separately from their offsprings with income sources de-rived from remittances, social welfare allowance and interest earnings, etc. These households are not included in the econometric analysis be-cause of their small number of observations. Such exclusion, however, is a limitation
be-cause changes in this strategy may reveal some important policy implications. Hence, some dis-cussion on this issue will be made in the con-clusion section.
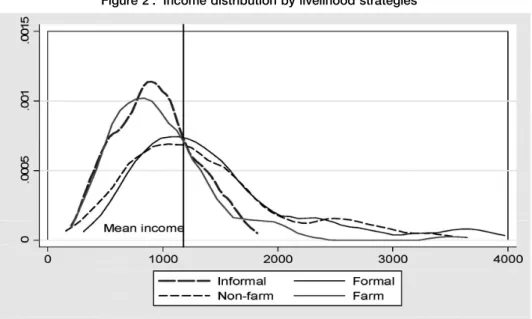
Figure 2 illustrates the income distribution
by various types of livelihood strategies. The distributions for the agriculture−based the infor-mal wage work−based strategies are clearly shifted to the left of the other strategies and the mean income. This suggests that there are some significant disparities in the well−being among distinct strategies and that household businesses as well as formal wage work are more lucrative livelihood strategies. According to the survey data, monthly per capita income is estimated at around VND 1,176,000 for the whole sample but a considerable disparity among groups can be shown in the figure. Those who rely mainly on manual paid jobs and farming reached at only 930,000 and 980,000, respectively, which are much lower than that of those pursuing strategies that based on formal
Figure 2 : Income distribution by livelihood strategies
wage work and non−farm work (1,457,000 and 1,354,000).
2.3.3. Specification of the econometric model
Once livelihood strategies are identified, a multinomial logistic model will be used to quan-tify the determinants of the livelihood strategy selection of households. As indicated by Train (2003), the multinomial logit (MNL) model is the most widely used discrete choice model. This model assumes that the decision makers make their choice on the basis of maximizing their utility and therefore it is called a “random utility model” (RUMs).
Based on the argument in section 2.1, we as-sume that households’ current activity choices are conditioned on asset−related variables and other variables relating to policies or geo-graphic locations. However, a problem that may arise is that in fact, some households might not change their livelihood strategies after farmland acquisition and therefore their current liveli-hood choices had been determined prior to farmland acquisition. In such cases, current out-comes may be affected by past decisions ; cur-rent behaviors may be explained by inertia or habit persistence (Cameron & Trivedi, 2005). Accordingly, the past livelihood strategies should be included as regressors in the analy-sis model of households’ strategy choice. The inclusion of past livelihood choices among other regressors not only directly reflects the changes of livelihood strategy over time but also picks up unobservable households attrib-utes affecting livelihood choices such as skills, social networks, occupational preferences (C. B. Barrett, Reardon & Webb, 2001).
Following van den Berg (2010), H. Jansen et al. (2006) and IFPRI (2004), we also assume
that households’ current livelihood choices are determined by slowly changing factors, includ-ing location variables, farmland size and resi-dential land size owned by the households, and human capital of households. Other variables, including physical, financial and social capitals are not considered as determinants of liveli-hood strategies because such types of capitals may be jointly determined with, or even deter-mined by, the livelihood choices. By excluding such types of variables, the model will minimize the potential endogeneity problem (Babulo et al., 2008 ; Jansen et al., 2006). For instance, a household that opens a motorbike repair work-shop as their livelihood strategy will invest and therefore accumulate an amount of productive assets such as tools, equipment and facility. Ac-cordingly, it would be not appropriate to con-sider these accumulated productive assets as a determinant of their current livelihood choice. However, one can make a similar argument that the households’ endowment of human capi-tal is more likely to be the result than the de-terminant of livelihood choice. Nonetheless, while households pursuing lucrative livelihood strategies tend to have a greater investment in education and higher schooling attainments, this mainly influences the education level of younger household members and not of the working household members, which we use as proxy for human capital. The inclusion of the average education of working members as an explanatory variable instead of all household members (including children) helps avoid the “ reverse causality” (WB, 1998).
few studies have tried to quantify the impact of social capital on rural livelihood choices. This is because data on social capital is rarely available and not easily collected (Davis, 2003 ; Siegel, 2005). With our data on social capital merely measured in the form of the number of group memberships, it cannot adequately reflect the content and dimensions of social capital. In ad-dition, in terms of group memberships, social capital is more likely the result of livelihood strategies than the determinant of livelihood choices. For example, households with a higher number of formal group memberships are often the result of their choice of paid jobs in state sector, enterprises or other organizations. Once a household member is recruited as a formal wage worker in these organizations, he or she will soon become a member of several formal groups such as communist party or trade union members. For this reason, social capital is not included in the model.
2.3.4. Description of the explanatory vari-ables
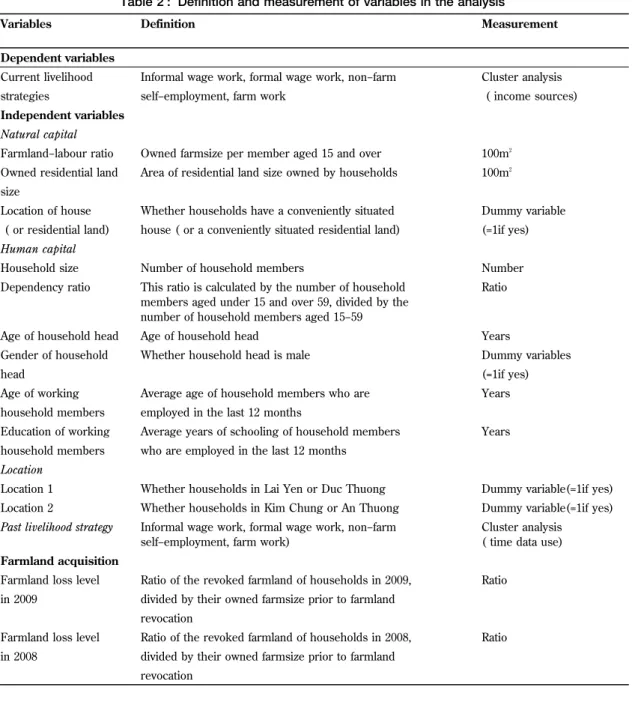
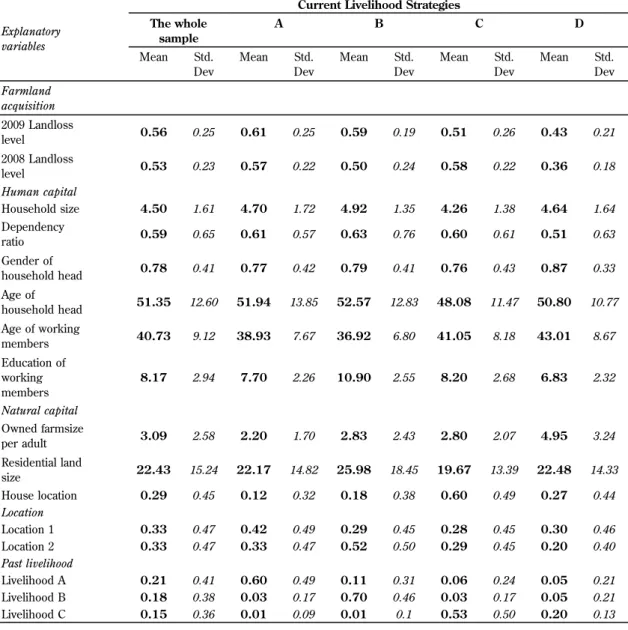
Table 2 provides the information about the
definition and measurement of variables in the analysis. As farmland is the main input in agri-cultural production, the owned farmland size per adult or “the farmland − labour ratio” is used as a predictor of household activity. As a priori expected, households with a higher farm-land−labour ratio tend to be more likely to take up farm work. In most studies on determinants
of rural livelihood strategies, residential land or location of houses has not been regarded as a determinant of household livelihood choices. In this study, we included the size of residential land and the location of houses (or residential land) in the model as determinants of peri−ur-ban household livelihood strategies. Within the context of urban or peri−urban livelihoods, a house as well as a plot of residential land is of much importance to urban and peri−urban households (Baharoglu & Kessides, 2002 ; Mo-ser, 1998 ; S. V. Nguyen, 2009). Households with conveniently situated houses (or residen-tial land plots)4 can use them for opening a
shop or for renting, while other households owning larger sizes of residential land can sell parts or use them as collateral for credit to in-vest in profitable activities.
Regarding human capital, both household size and dependency ratio were included in the model. Larger household size tends to have more family labour while a low dependency ra-tio may be indicative of labour endowment. As a result, both these indicators were expected to influence livelihood strategy choices of house-holds. Gender and age of household head are included but we did not include the education of household head in the model. This is be-cause a high multicollinearity existed between the education of household heads and the edu-cation of working age members. As we ex-pected, the average education of working household members would have a significant impact on livelihood choices, which means that households whose working members have higher education level are more likely to en-gage in better remunerated occupations or more profitable non−farm self−employment ac-tivities.
Rural livelihood strategies may be affected by many factors at village−levels such as the qual-ity of land, access to markets, population den-sity and opportunities for non−farm employ-ment (Pender, Jagger, Nkonya, & Sserun-kuuma, 2004 ; Siegel, 2005). Hence, we include dummy variables for the location in which households reside. Communes with similar
general characteristics should be combined into groups and then used as location variables. Lo-cation 1 consists of two communes named Lai Yen and Duc Thuong. These communes have a longstanding history of traditional careers relat-ing to fields such as mason, paintrelat-ing and wor-shipping object production. As expected, house-holds in these communes have more chances revocation
divided by their owned farmsize prior to farmland in 2008
Ratio Ratio of the revoked farmland of households in 2008,
Farmland loss level
revocation
divided by their owned farmsize prior to farmland in 2009
Ratio Ratio of the revoked farmland of households in 2009,
Farmland loss level
Farmland acquisition
Cluster analysis ( time data use) Informal wage work, formal wage work, non−farm
self−employment, farm work)
Past livelihood strategy
Dummy variable(=1if yes) Whether households in Kim Chung or An Thuong
Location 2
Dummy variable(=1if yes) Whether households in Lai Yen or Duc Thuong
Location 1
Location
who are employed in the last 12 months household members
Years Average years of schooling of household members
Education of working
employed in the last 12 months household members
Years Average age of household members who are
Age of working
(=1if yes) head
Dummy variables Whether household head is male
Gender of household
Years Age of household head
Age of household head
Ratio This ratio is calculated by the number of household
members aged under 15 and over 59, divided by the number of household members aged 15−59 Dependency ratio
Number Number of household members
Household size
Human capital
(=1if yes) house ( or a conveniently situated residential land)
( or residential land)
Dummy variable Whether households have a conveniently situated
Location of house size
100m2
Area of residential land size owned by households Owned residential land
100m2
Owned farmsize per member aged 15 and over Farmland−labour ratio
Natural capital
Independent variables
( income sources) self−employment, farm work
strategies
Cluster analysis Informal wage work, formal wage work, non−farm
Current livelihood
Dependent variables
Measurement Definition
Variables
to work as wage workers for household enter-prises or individuals with careers mentioned above. Location 2 represents two communes namely Kim Chung and An Thuong. These two communes have more comparative advantage over other communes in terms of geographic location. Both these communes are close to the town center, entertainment centers and indus-trial zones where there have existed a wide range of job opportunities for job seekers. Con-sequently, households’ livelihoods in this loca-tion are expected to have a higher likelihood of specializing in both the informal and formal wage sectors. The remaining communes named Song Phuong and Van Con are used as the ref-erence group (or the base group). Households in these communes have a longstanding tradi-tion of trade in local farm products. Such loca-tion variables were expected to capture differ-ences in inter−commune in terms of farmland fertility, educational tradition, local infrastruc-ture development and geographic attributes, and other community level factors that affect households’ livelihood choices.
Past livelihood strategies are included as in-dependent variables in the model, including three dummy variables : (i) informal wage work based livelihood ; (ii) formal wage work based livelihood ; (iii) non−farm self−employ-ment based livelihood and the reference group is the farm work based livelihood. As discussed earlier, these variables are of much importance to the prediction of households’ activity choices because they indicate dynamics of household
livelihood changes over time, and capture other unobservable factors that influence households’ livelihood choices (C. B. Barrett et al., 2001).
Lastly, farmland acquisition was considered as the variable of interest. The farmland acqui-sition took place at different times ; therefore, landloss households are divided into two groups namely (i) those who lost their land in 2008 and (ii) those who lost their farm-land in 2009. The reason for this division is that the length of time since farmland acquisition was expected to be highly related to the prob-ability of livelihood changes. In addition, the level of farmland loss was quite different among households. Some lost little, some lost partially while others lost totally. Hence, it would be ap-propriate to consider the impact of farmland loss intensity on household livelihood choices at different times of farmland acquisition. As a consequence, the landloss level in 2008 and the landloss level in 2009 are expected to ade-quately reflect the influence of farmland acquisi-tion on households’ activity choices.
3. The estimation results
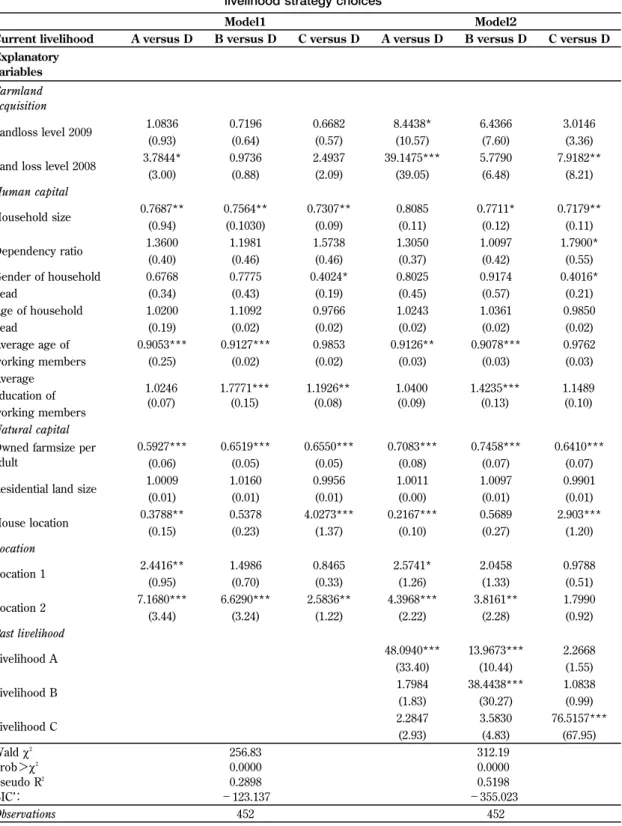
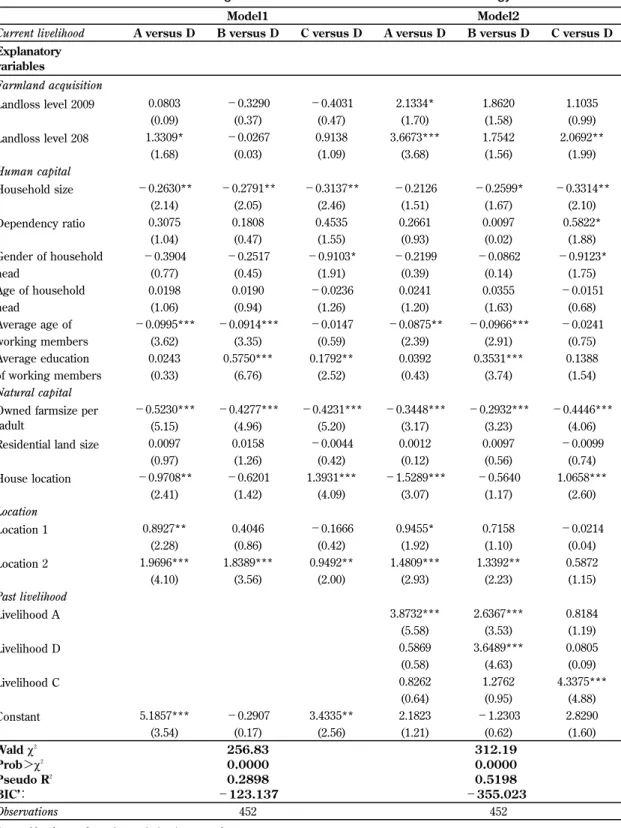
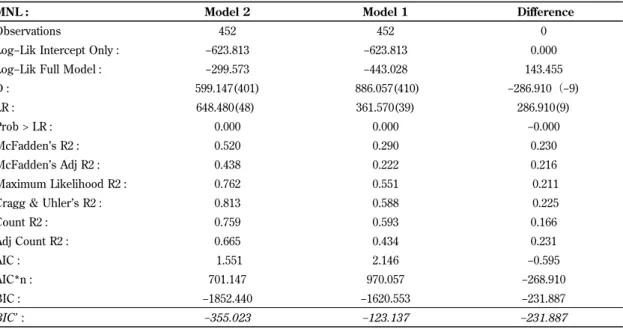
Table 3 reports the estimation results from
the Multinomial Logit Model, with and without the past livelihood strategy. As revealed in Ta-ble 4, Model 2 has much more negative BIC’ than Model 1, suggesting that Model 2 is much more preferred5
. In addition, the estimation re-sults from Model 2 show that many explanatory variables are statistically significant at 10 per-cent or lower, with their signs as expected. Fi-nally, the Pseudo−R2
=0.52 and is highly sig-nificant, indicating that this model has a strong explanatory power6
.
Farmland acquisition
5 See the detailed test in Table 11 and other tests in Ta-ble9and Table 10, Appendix1
6 An extremely good fit of the model is confirmed if the value of the Pseudo−R2ranges from 0.2 to 0.4 (Louviere,
Note: Absolute value of z statistics in parentheses. Statistically significant at 10 %(*), at 5% (**) and at 1% (***)
A : Informal wage work ; B : Formal wage work ; C : Non−farm self−employment ; D : Farm work (base group)
452 452 Observations 312.19 0.0000 0.5198 −355.023 256.83 0.0000 0.2898 −123.137 Waldχ2 Prob>χ2 Pseudo R2 BIC’: (67.95) (4.83) (2.93) Livelihood C 2.2847 3.5830 76.5157*** (0.99) (30.27) (1.83) Livelihood B 1.7984 38.4438*** 1.0838 (1.55) (10.44) (33.40) Livelihood A 48.0940*** 13.9673*** 2.2668 Past livelihood (0.92) (2.28) (2.22) (1.22) (3.24) (3.44) Location 2 7.1680*** 6.6290*** 2.5836** 4.3968*** 3.8161** 1.7990 (0.51) (1.33) (1.26) (0.33) (0.70) (0.95) Location 1 2.4416** 1.4986 0.8465 2.5741* 2.0458 0.9788 Location (1.20) (0.27) (0.10) (1.37) (0.23) (0.15) House location 0.3788** 0.5378 4.0273*** 0.2167*** 0.5689 2.903*** (0.01) (0.01) (0.00) (0.01) (0.01) (0.01)
Residential land size 1.0009 1.0160 0.9956 1.0011 1.0097 0.9901
(0.07) (0.07) (0.08) (0.05) (0.05) (0.06)
Owned farmsize per adult 0.6410*** 0.7458*** 0.7083*** 0.6550*** 0.6519*** 0.5927*** Natural capital 1.1489 (0.10) 1.4235*** (0.13) 1.0400 (0.09) 1.1926** (0.08) 1.7771*** (0.15) 1.0246 (0.07) working members education of Average (0.03) (0.03) (0.03) (0.02) (0.02) (0.25) working members 0.9762 0.9078*** 0.9126** 0.9853 0.9127*** 0.9053*** Average age of (0.02) (0.02) (0.02) (0.02) (0.02) (0.19) head 0.9850 1.0361 1.0243 0.9766 1.1092 1.0200 Age of household (0.21) (0.57) (0.45) (0.19) (0.43) (0.34) head 0.4016* 0.9174 0.8025 0.4024* 0.7775 0.6768 Gender of household (0.55) (0.42) (0.37) (0.46) (0.46) (0.40) Dependency ratio 1.3600 1.1981 1.5738 1.3050 1.0097 1.7900* (0.11) (0.12) (0.11) (0.09) (0.1030) (0.94) Household size 0.7687** 0.7564** 0.7307** 0.8085 0.7711* 0.7179** Human capital (8.21) (6.48) (39.05) (2.09) (0.88) (3.00)
Land loss level 2008 3.7844* 0.9736 2.4937 39.1475*** 5.7790 7.9182**
(3.36) (7.60) (10.57) (0.57) (0.64) (0.93) Landloss level 2009 1.0836 0.7196 0.6682 8.4438* 6.4366 3.0146 Farmland acquisition Explanatory variables C versus D B versus D A versus D C versus D B versus D A versus D Current livelihood Model2 Model1
The farmland acquisitions in both years influ-enced significantly households’ likelihood of switching to the informal wage work−based strategy. However, those with farmland loss in 2008 have much higher probability of adopting this strategy than those in 2009, with the corre-sponding relative risk ratios being respectively 39.15 and 8.44. This phenomenon might be ex-plained such that landloss households in 2008 have more time to respond to the shock of landloss and therefore they have a higher chance of taking up an alternative livelihood based on manual paid jobs. In addition, while the farmland acquisition in 2008 has a substan-tial influence on the likelihood of adopting a strategy that is based on household businesses, such an impact is not observed for the farmland acquisition in 2009. This is probably because the time since the farmland acquisition is not long enough for landloss households to change their traditionally farming to household busi-nesses as their dominant livelihood. Finally, the farmland acquisition in both years did not influ-ence the possibility of pursuing the formal wage work−based strategy. Normally, involving in the formal wage sector requires employee’s appropriate vocational skills and higher educa-tion levels. This may be indicative of the fact that landloss households are faced with a higher entry barrier to this activity.
4. Discussion
The results reveal some typical patterns of livelihood transition under the impact of farm-land acquisition. A first pattern shows that the farmland acquisition in both years have
re-sulted in a profound transition from a tradition-ally agricultural strategy to strategies based on manual paid jobs. Under the impact of farmland acquisition, the most common and easily ob-served conversion is a switch−over from farm-ing to a strategy relied on informal wage work. This is in line with the previous finding by Do (2006) who conducted a case study on a Ha-noi’s peri−urban village. Her result revealed that, the majority of landloss households en-gaged in casual and manual paid jobs soon after their farmland was revoked. On the one hand, this is indicative of high availability of manual paid jobs in Hanoi’s peri urban areas. On the other hand, the easy switch−over from farming to manual paid jobs reflects a very low entry barrier to these activities. According to a survey on the informal sector in Hanoi, this sector of-fers the main job opportunity for most of both unskilled self−employed workers and wage workers. Such job opportunities are also more often found in Hanoi’s rural and peri−urban ar-eas and those working in this sector have much lower level of education than other sectors (Cling et al., 2010 ; GSO−ISS, 2009).
informal wage work−based strategy increases with the rising farmland loss level in 2009 ; such an impact is not recorded for the likeli-hood of choice of the non−farm work−based strategy.
A third pattern as we expected has not oc-curred. The farmland acquisitions have not re-sulted in a livelihood transition from farming to highly remunerative jobs in new industrial zones, factories, and recreational centers, etc. This phenomenon stems from some main rea-sons. First, the farmland has been largely con-verted for the construction of high way, urban areas and housing development rather than in-dustrial zones and factories. Therefore, few jobs have been generated by these projects. As re-vealed by the survey, among 237 landloss households, only 10 percent of them reported having at least one member being recruited by these projects. A similar result was also re-corded in the whole district. Among 3,700 hec-tares of farmland that had been converted for projects, about 2,900 hectares were reserved for new urban area and housing projects (Viet, 2009). As consequence, only 300 landlosing farmers have been recruited in industrial zones and factories as compared to 11,445 rural re-dundant workers due to farmland acquisition (Toquoc.gov.vn, 2009). Second, most landlosing farmers are old and do not have appropriate educational background or vocational skills to engage in more well paid jobs. According to the survey, about half of the landlosing households reported that old age and lack of education and skills are the main barriers that hinder them from being recruited in industrial zones, facto-ries and offices. Finally, it normally takes inves-tors a few years or longer to complete the con-struction of an industrial zone, a factory or an
office. Hence, local people may be only re-cruited after the completion of construction, which suggests that the impacts of farmland ac-quisition on local labour may be insignificant in the short−term but more significant in the long −term.
Regarding the role of farmland size in shap-ing livelihood strategies, the result shows that farmland endowment has still acted as an im-portant factor in determining peri−urban liveli-hood strategies. Farming has been an appropri-ate livelihood choice for households with eld-erly members and those who have been tempo-rarily unable to find alternative strategies. While the size of residential land does not af-fect households’ activity choices, the location of house or residential land has a considerable in-fluence on their livelihood strategy choices. Conveniently situated houses (or residential land) have been optimized by their owners for business purposes. This reflects partially that many households have seized actively emerg-ing market opportunities in a rapidly urbanizemerg-ing area. However, while such a livelihood strategy seems to be more easily adopted by some households who are endowed with a conven-iently located house (or residential land), it may be impossible for households without this endowment. Consequently, such differences in access to emerging livelihood opportunities may result in social differentials among house-holds.
pursued by more elderly members than those in wage work−based strategies, which implies that emerging non−farm jobs make rural young generations no longer interested in farming ac-tivities. Young rural workers have benefited from losing farmland to urbanization, because they are more well−educated relative to their parents, and young enough to utilize new non− farm opportunities. A similar trend is also found in Hanoi’s peri−urban areas by Do (2006), Lee, Binns & Dixon (2010), and in Ho Chi Minh City’s by Vo (2006). More popularly in many rural areas, young workers abandoned their rice fields to migrate to big cities in search of urban and industrial jobs, leaving farm work to the elderly (Paris et al., 2009). Accordingly, it is estimated that about 44 percent of the Vietnam-ese elderly are still working, mostly in farming activities (UNFPA, 2010).
The education of working members has a significant impact on taking up a strategy based on more remunerative jobs, meaning that households who are less well−endowed will be hindered from undertaking this strategy. This also helps partially explain that landlosing households without appropriate educational background or vocational skills were unable to engage in more remunerated jobs. The same phenomenon is found in several localities where landlosing farmers with poor human capital had limited access to high−paid jobs (Ngo, 2009 ; Q. V. Nguyen, et al., 2005 ; S. V. Nguyen, 2009). Nonetheless, human capital is found not to be related to non−farm self−em-ployment and manual paid jobs, suggesting that in terms of formal education, there has been relative ease of entry into these activities. Non− farm household businesses may not require a high level of formal education and investment
because the majority of non−farm activities are very small−scale units, using family labour and specializing in small trade or service provision. In addition, a wide range of manual paid jobs have been available within the district as well as in Hanoi city, which offer local people a di-versified portfolio of livelihood choices.
As reported in the estimation results, geo-graphic location plays a crucial role in house-hold activity choices. The inclusion of Location 1 helps explain how socio−economic factors at the commune−level affect households’ probabil-ity of choosing a strategy based on informal wage work. As discussed earlier, households dwelling in Lai Yen and Duc Thuong Com-munes can find it easy to get paid jobs such as masons, carpenters, painters and worshipping− object workers. Employers are often villagers who undertake a contract for building, painting a house, or run a workshop. Thanks to the in-terpersonal trust and close relationships among villagers, dwellers in these villages can be eas-ily hired for such jobs. The inclusion of Loca-tion 2 as the explanatory variable reflects the availability of both manual paid jobs and skill− required paid jobs in this area. Both communes in this area have a greater geographic advan-tage over the remaining communes ; An Thuong Commune is located close to the newly opened Bao Son Paradise Park, the biggest en-tertainment and tourism complex in North Viet-nam and Kim Chung Commune is situated close to the Hoai Duc District Centre, the Na-tional Way 32 and the Lai Xa−Kim Chung In-dustrial Zone.
5. Conclusion and policy implications
farmland acquisition has a wide−range of im-pacts on households’ livelihoods in Hoai Duc District. Redundant rural workers and idle man-power have found a diversified portfolio of job opportunities such as small traders, industrial or casual workers or semi−permanent or per-manent workers. In addition, under the impacts of farmland acquisition in both years, house-holds have actively adapted to the new context by switching to livelihood strategies that de-pend less on farmland. Among choices of activi-ties, manual paid jobs and household busi-nesses appear to be the most popular activities. This implies that the informal sector has been emerging as the leading job provider in Hanoi’s peripheries ; this conclusion is similar to the recent result by Cling et al. (2010). The avail-ability of job opportunities in the informal sec-tor not only helps farm households mitigate the negative consequences of landloss but also open a new chance for them to change and di-versify their livelihoods.
Although the number of households who fol-lowed the farm work−based strategy consider-ably declined after farmland revocation, a large number of households have still maintained ag-ricultural production for their subsistence or cash income to some extent. This implies that farming has still been of much importance for food security for many households as well as to old farmers who are unable to take up new non −farm opportunities. For households who lost part of their farmland, their remaining area of farmland may be insufficient for the cultivation of traditional types of crop plants. Thus, it is necessary for them to learn successful experi-ences in farming transition from other localities in Hanoi. In some urban and peri−urban dis-tricts of Hanoi such as Tay Ho, Tu Liem and
Linh Nam, farm households have been benefit-ing by shiftbenefit-ing from the production of staples, to vegetables and then to higher value products such as fresh vegetables, flowers and ornamen-tal plants (Lee et al., 2010). Similarly, such a successful transition is also observed in Binh Chanh District of Ho Chi Minh City, where farmers have changed from rice cultivation to perennial crops, husbandry and horticulture (Vo, 2006). Therefore, policy support for farm-ers to change their types of traditional crops to higher value crops such as fresh vegetables, flowers and bonsai, should be practical of use.
all productive land and family members are not well−educated or lack vocational skills. This im-plies that investment in education and voca-tional training is a successful key for rural young generations to take up highly remunera-tive paid jobs.
According to Hoai Duc’s land use plan, only 600 hectares of farmland have been reserved for agricultural production by 2020 (Landtoday, 2010), which may severely threaten the liveli-hoods of thousands of farmers, specially elderly landless farmers. Fortunately, on the basis of Decree 17/2006/ND−CP (2007) by The Gov-ernment of Vietnam, Ha Tay People’s Commit-tee issued Decision 1098/2007/QD−UB (2007a) and Decision 371/2008/QD−UB (2008a), which states that “land for services” will be granted to households with more than 30 percent of agri-cultural land revoked. Each household receives an area of “land for services” equivalent to 10 percent of the area of revoked farmland land. “ Land for services” is used as business premises for non−farm activities such as opening a shop, a workshop, rental accommodation, etc. Accord-ingly, “Land for services” is a golden chance for landloss households, particularly elderly family members to switch from agricultural production to lucrative non−farm activities in Hanoi’s peri− urban areas. In fact, this policy has been slowly conducted due to several reasons while all land-loss households desire soon to receive “land for services” to undertake business activities (LH, 2010). Therefore, speeding up the implementa-tion of this policy is one of the prerequisites to facilitate livelihood transitions of landloss households in Hanoi’s peri−urban areas. Such a policy has been piloted in Vinh Phuc Province since 2004 where landlosing households util-ized “land for services” for opening a shop or
providing accommodation lease for workers in industrial zones. As noted by the ADB (2007), this initially successful experience, therefore, should be worth considering by other localities. The experiences from Tu Liem District, a for-merly peri−urban district of Hanoi, indicate that improvements in local infrastructures and have connected and shortened the distance from this area to Hanoi’s central areas. Consequently, this stimulates the flows of students, migrant workers or small businessmen to come to vil-lages to hire accommodation or a prime loca-tion for doing business. In this area, accommo-dation rental fees are emerging as the most im-portant and stable income for the majority of households (S. V. Nguyen, 2009). Besides, set-ting up new commercial centers and markets by the local government has proved to be the most suitable way to create more non−farm job opportunities for older landloss farmers (Ngoc, 2004). Therefore, the policy implication is that more new roads should be made, old roads should be enlarged and upgraded and some new commercial centers or markets should be set up. Consequently, this will result in more chances for households to take full advantages of their own houses, residential land plots, and “land for services”.
discussed earlier, accommodation rental fees have been becoming the major income source for many households in some former peri−ur-ban areas. In Hoai Duc District, a similar trend has begun in some communes that are in close proximity to universities and industrial zones. In An Khanh Commune, for instance, hundreds of households utilized their gardens and
grounds to build common boarding−houses for factory workers and students. Among them, some households earned from 5 to 7 million dong per month from accommodation rental fees, which is a much higher income source as compared to other income sources (Monre, 2007).
Note: standard deviation in parentheses.
Source: Own calculation from author’s survey.
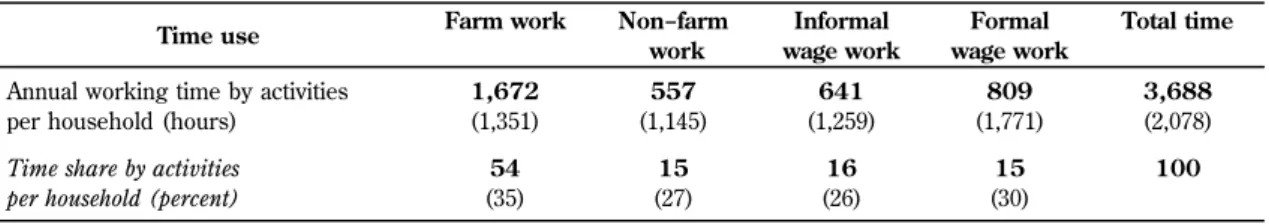
100 15 (30) 16 (26) 15 (27) 54 (35)
Time share by activities per household (percent)
3,688 (2,078) 809 (1,771) 641 (1,259) 557 (1,145) 1,672 (1,351) Annual working time by activities
per household (hours)
Total time Formal wage work Informal wage work Non−farm work Farm work Time use
Appendix1 Table 4 : Some descriptive statistics on time allocation data for clustering the past livelihood strategies
Note: standard deviation in parentheses.
Source: Own calculation from author’s survey
100 6.5 (14) 18 (32) 24 (34) 24.5 (34) 27 (30)
Income share by sources per household (percent)
56,197 (30,497) 3,490 (8,849) 14,555 (28,973) 12,035 (18,399) 15,561 (26,478) 14,046 (16,502) Annual income by activities
per household (VND 1,000) Total income Transfer Formal wage work Informal wage work Non−farm work Farm work Income mean and
shares by activities
Note: (Refer to Table3for names and definitions of variables)
The averages for dummy variables in all strategies as well as the whole sample serve as percentages ; for example in live-lihood A, a mean of 0.77 for the variable “Gender of household head” means that 77 percent of the households in this cate-gory are male headed and only 23 percent are female headed.
0.13 0.20 0.50 0.53 0.1 0.01 0.09 0.01 0.36 0.15 Livelihood C 0.21 0.05 0.17 0.03 0.46 0.70 0.17 0.03 0.38 0.18 Livelihood B 0.21 0.05 0.24 0.06 0.31 0.11 0.49 0.60 0.41 0.21 Livelihood A Past livelihood 0.40 0.20 0.45 0.29 0.50 0.52 0.47 0.33 0.47 0.33 Location 2 0.46 0.30 0.45 0.28 0.45 0.29 0.49 0.42 0.47 0.33 Location 1 Location 0.44 0.27 0.49 0.60 0.38 0.18 0.32 0.12 0.45 0.29 House location 14.33 22.48 13.39 19.67 18.45 25.98 14.82 22.17 15.24 22.43 Residential land size 3.24 4.95 2.07 2.80 2.43 2.83 1.70 2.20 2.58 3.09 Owned farmsize per adult Natural capital 2.32 6.83 2.68 8.20 2.55 10.90 2.26 7.70 2.94 8.17 Education of working members 8.67 43.01 8.18 41.05 6.80 36.92 7.67 38.93 9.12 40.73 Age of working members 10.77 50.80 11.47 48.08 12.83 52.57 13.85 51.94 12.60 51.35 Age of household head 0.33 0.87 0.43 0.76 0.41 0.79 0.42 0.77 0.41 0.78 Gender of household head 0.63 0.51 0.61 0.60 0.76 0.63 0.57 0.61 0.65 0.59 Dependency ratio 1.64 4.64 1.38 4.26 1.35 4.92 1.72 4.70 1.61 4.50 Household size Human capital 0.18 0.36 0.22 0.58 0.24 0.50 0.22 0.57 0.23 0.53 2008 Landloss level 0.21 0.43 0.26 0.51 0.19 0.59 0.25 0.61 0.25 0.56 2009 Landloss level Farmland acquisition Std. Dev Mean Std. Dev Mean Std. Dev Mean Std. Dev Mean Std. Dev Mean Explanatory variables D C B A The whole sample
Current Livelihood Strategies
Note: Absolute value of z statistics in parentheses. Statistically significant at 10 %(*), at 5% (**) and at 1% (***)
A : Informal wage work ; B : Formal wage work ; C : Non−farm self−employment ; D : Farm work (base group)
452 452 Observations 312.19 0.0000 0.5198 −355.023 256.83 0.0000 0.2898 −123.137 Waldχ2 Prob>χ2 Pseudo R2 BIC’: (1.60) (0.62) (1.21) (2.56) (0.17) (3.54) Constant 5.1857*** −0.2907 3.4335** 2.1823 −1.2303 2.8290 (4.88) (0.95) (0.64) Livelihood C 0.8262 1.2762 4.3375*** (0.09) (4.63) (0.58) Livelihood D 0.5869 3.6489*** 0.0805 (1.19) (3.53) (5.58) Livelihood A 3.8732*** 2.6367*** 0.8184 Past livelihood (1.15) (2.23) (2.93) (2.00) (3.56) (4.10) Location 2 1.9696*** 1.8389*** 0.9492** 1.4809*** 1.3392** 0.5872 (0.04) (1.10) (1.92) (0.42) (0.86) (2.28) Location 1 0.8927** 0.4046 −0.1666 0.9455* 0.7158 −0.0214 Location (2.60) (1.17) (3.07) (4.09) (1.42) (2.41) House location −0.9708** −0.6201 1.3931*** −1.5289*** −0.5640 1.0658*** (0.74) (0.56) (0.12) (0.42) (1.26) (0.97)
Residential land size 0.0097 0.0158 −0.0044 0.0012 0.0097 −0.0099
(4.06) (3.23) (3.17) (5.20) (4.96) (5.15)
Owned farmsize per adult −0.4446*** −0.2932*** −0.3448*** −0.4231*** −0.4277*** −0.5230*** Natural capital (1.54) (3.74) (0.43) (2.52) (6.76) (0.33) of working members 0.1388 0.3531*** 0.0392 0.1792** 0.5750*** 0.0243 Average education (0.75) (2.91) (2.39) (0.59) (3.35) (3.62) working members −0.0241 −0.0966*** −0.0875** −0.0147 −0.0914*** −0.0995*** Average age of (0.68) (1.63) (1.20) (1.26) (0.94) (1.06) head −0.0151 0.0355 0.0241 −0.0236 0.0190 0.0198 Age of household (1.75) (0.14) (0.39) (1.91) (0.45) (0.77) head −0.9123* −0.0862 −0.2199 −0.9103* −0.2517 −0.3904 Gender of household (1.88) (0.02) (0.93) (1.55) (0.47) (1.04) Dependency ratio 0.3075 0.1808 0.4535 0.2661 0.0097 0.5822* (2.10) (1.67) (1.51) (2.46) (2.05) (2.14) Household size −0.2630** −0.2791** −0.3137** −0.2126 −0.2599* −0.3314** Human capital (1.99) (1.56) (3.68) (1.09) (0.03) (1.68) Landloss level 208 1.3309* −0.0267 0.9138 3.6673*** 1.7542 2.0692** (0.99) (1.58) (1.70) (0.47) (0.37) (0.09) Landloss level 2009 0.0803 −0.3290 −0.4031 2.1334* 1.8620 1.1035 Farmland acquisition Explanatory variables C versus D B versus D A versus D C versus D B versus D A versus D Current livelihood Model2 Model1
Note: Ho : Odds (outcome J vs. outcome K) are independent of other alternatives.
Statistically insignificant values of Hausman test mean that the IIA assumption has not been violated (Long, 1997). For Ho 1.0 34 −6.353 Farm work For Ho 1.0 34 1.374 Non−farm work For Ho 1.0 34 2.962
Formal wage work
For Ho 1.0
34 1.264
Informal wage work
Evidence P>chi2
df chi2
Category
Table 8 : Hausman test for Assumption of Independence of Irrelevant Alternatives (IIA)
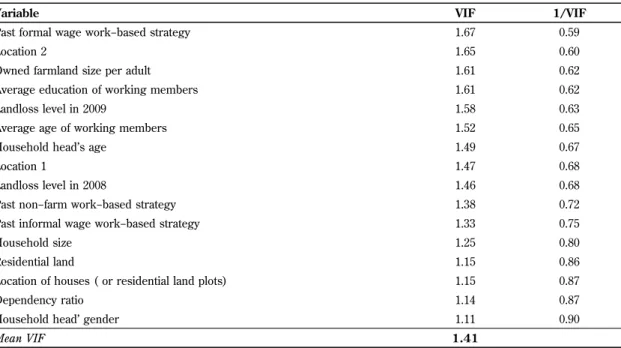
Note: A presence of high multicollinearity exist if VIF values are larger than 10 (Gujarati & Porter, 2009, p. 362). As re-ported in Table 10, all the VIF values are much less than 10, which confirms that this study does not encounter the prob-lem of multicollinearity.
1.41
Mean VIF
0.90 1.11
Household head’ gender
0.87 1.14
Dependency ratio
0.87 1.15
Location of houses ( or residential land plots)
0.86 1.15 Residential land 0.80 1.25 Household size 0.75 1.33
Past informal wage work−based strategy
0.72 1.38
Past non−farm work−based strategy
0.68 1.46 Landloss level in 2008 0.68 1.47 Location 1 0.67 1.49
Household head’s age
0.65 1.52
Average age of working members
0.63 1.58
Landloss level in 2009
0.62 1.61
Average education of working members
0.62 1.61
Owned farmland size per adult
0.60 1.65
Location 2
0.59 1.67
Past formal wage work−based strategy
1/VIF VIF
Variable
Note: Difference of 231.887 in BIC’ provides very strong support for Model 2.
The model with the more negative BIC or BIC’ is preferred and the strength of Evidence based on the Absolute Value of the Difference in BIC or BIC’. (0−2 : Weak ; 2−6 : Positive ; 6−10 : Strong ; >10 : Very strong) (Long, 1997, pp. 111−112).
−231.887 −123.137 −355.023 BIC’: −231.887 −1620.553 −1852.440 BIC : −268.910 970.057 701.147 AIC*n : −0.595 2.146 1.551 AIC : 0.231 0.434 0.665 Adj Count R2 : 0.166 0.593 0.759 Count R2 : 0.225 0.588 0.813 Cragg & Uhler’s R2 :
0.211 0.551 0.762 Maximum Likelihood R2 : 0.216 0.222 0.438 McFadden’s Adj R2 : 0.230 0.290 0.520 McFadden’s R2 : −0.000 0.000 0.000 Prob > LR : 286.910(9) 361.570(39) 648.480(48) LR : −286.910(−9) 886.057(410) 599.147(401) D : 143.455 −443.028 −299.573 Log−Lik Full Model :
0.000 −623.813
−623.813 Log−Lik Intercept Only :
0 452 452 Observations Difference Model 1 Model 2 MNL :
REFERENCES
ADB. (2007). Agricultural land conversion for industrial and commercial use : competing in-terests of the poor. In ADB (Ed.), Markets
and Development Bulletin (pp. 85−93). Hanoi : Asian Developmen Bank.
Alwang, J., Jansen, H. G. P., Siegel, P. B., & Pichon, F. (2005). Geographic Space, Assets,
Livelihoods and Well−being in Rural Central America : Evidence from Guatemala, Hondu-ras and Nicaragua.: (DSGD Discussion Pa-per No. 26). Retrieved from International Food Policy Research Institute (IFPRI) web-site : http : //www.ifpri.org/web-sites/default/files /publications/dsgdp26.pdf.
Anderson, J., & Karel, W. (2010). Population Genetics and Dynamics of Spotted Seatrout in the Estuarine Waters of Texas. Fish Aquat J. Ansoms, A. (2008). Rural Poverty and Livelihood
Profiles in Post−genocide Rwanda: (Discus-sion Paper 2008.07). Institute of Development Policy and Management & University of Ant-werp. Retrieved from http : //www.ua.ac.be/ objs/00192837.pdf.
Azadi, H., Ho, P., & Hasfiati, L. (2010). Agricul-tural land conversion drivers : A comparison between less developed, developing and de-veloped countries. Land Degradation &
Devel-opment.
Babulo, B., Muys, B., Nega, F., Tollens, E., Nyssen, J., Deckers, J., et al. (2008). House-hold livelihood strategies and forest depend-ence in the highlands of Tigray, Northern Ethiopia. Agricultural Systems, 98(2), 147−155. Baharoglu, D., & Kessides, C. (2002). Urban poverty. In J. Klugman (Ed.), A Sourcebook
for poverty reduction strategies (pp. 123−159) : The World Bank.
Bakaríc, I. R. (2006). 1 Uncovering Regional Disparities?the Use of Factor and Cluster Analysis. Croatian Economic Survey, 11. Barrett, C., Brown, D., Stephens, E., Ouma, J.,
& Murithi, F. (2006). Livelihood strategies in the rural Kenyan highlands. African Journal
for Agricultural and Resource Economics, 1(1). Barrett, C. B., Bezuneh, M., & Aboud, A. (2001). Income diversification, poverty traps and policy shocks in Cote d’Ivoire and Kenya.
Food Policy, 26(4), 367−384.
Barrett, C. B., Clark, M. B., Clay, D. C., & Reardon, T. (2005). Heterogeneous con-straints, incentives and income diversification strategies in rural Africa. Quarterly Journal of
International Agriculture, 44(1), 37−60. Barrett, C. B., Reardon, T., & Webb, P. (2001).
Nonfarm income diversification and house-hold livelihood strategies in rural Africa : concepts, dynamics, and policy implications.
Food Policy, 26(4), 315−331.
Bebbington, A. (1999). Capitals and capabili-ties : A framework for analyzing peasant vi-ability, rural livelihoods and poverty. World
development, 27(12), 2021−2044.
Becker, K. F. (2004). The informal economy : SIDA : Department for Infrastructure and Economic Co−operation.
Bryceson, D. (1997). De−Agrarianisation in Sub −Saharan Africa : Acknowledging the inevita-ble. In (DF Bryceson & V. Jamal, eds.) Fare-well to Farms : Deagrasianisation and Em-ployment in Africa, pp.−20. African Studies
Center Leiden, Leiden.
Bryceson, D. F. (1996). Deagrarianization and rural employment in sub−Saharan Africa : A sectoral perspective. World Development, 24 (1), 97−111.
Micro-econometrics : methods and applications : Cambridge Univ Pr.
Cameron, A. C., & Trivedi, P. K. (2009).
Micro-econometrics using stata (Vol. 5) : Stata Press. Chen, J. (2007). Rapid urbanization in China : A real challenge to soil protection and food security. Catena, 69(1), 1−15.
Chen, W. (1998). The political economy of rural industrialization in China : village conglomer-ates in Shandong Province. Modern China, 24 (1), 73−96.
Cling, J. P., Razafindrakoto, M., Rouubaud, F., Nguyen, H. T. T., Nguyen, C. H., & Phan, T. T. N. (2010). The Informal Sector in Vietnam :
A focus on Hanoi and Ho Chi Minh City. Ha-noi: The Gioi Editions.
Cox, T. F. (2005). An Introduction to
Multivarri-ate Data Analysis. New York : Oxford Univer-sity Press
Davis, J. R. (2003). The Rural−Non−Farm
Econ-omy, Livelihoods and their Diversification : Is-sues and Options (NRI Report No : 2753). Re-trieved from http : //ssrn.com/paper=691821. Deng, X., Huang, J., Rozelle, S., & Uchida, E. (2006). Cultivated land conversion and poten-tial agricultural productivity in China. Land
Use Policy, 23(4), 372−384.
Dercon, S., & Krishnan, P. (1996). Income port-folios in rural Ethiopia and Tanzania : choices and constraints. Journal of
Develop-ment Studies, 32(6), 850−875.
Dercon, S., & Krishnan, P. (1996). Income Port-folios in Rural Ethiopia and Tanzania : Choices and Constraints. Journal of
Develop-ment studies, 32.
DFID. (1999). Introduction : Sustainable
liveli-hood guidance sheets. Retrieved from http : // www.eldis.org.
Do, N. T. (2006). Loss of Land and Farmers’
Livelihood : A Case Study in Tho Da Village, Kim No Commune, Dong Anh District, Hanoi, Vietnam. . Swedish University of Agricultural Sciences, Sweden. Retrieved from http : // www.sol.slu.se/publications/masters_35.pdf. Ellis, F. (2000). Rural livelihoods and diversity
in developing countries: Oxford University Press, USA.
Ellis, F., & Bahiigwa, G. (2003). Livelihoods and rural poverty reduction in Uganda. World
Development, 31(6), 997−1013.
Ellis, F., Kutengule, M., & Nyasulu, A. (2003). Livelihoods and rural poverty reduction in Malawi. World Development, 31(9), 1495−1510. Ellis, F., & Mdoe, N. (2003). Livelihoods and
Rural Poverty Reduction in Tanzania. World
Development, 31(8), 1367−1384.
Fazal, S. (2000). Urban expansion and loss of agricultural land − a GIS based study of Saharanpur City, India. Environment and
Ur-banization, 12(2), 133−149.
Fazal, S. (2001). The need for preserving farm-land : A case study from a predominantly agrarian economy (India). Landscape and
Ur-ban Planning, 55(1), 1−13.
GSO−ISS. (2009). Shedding light on a huge black
hole : the informal sector in Hanoi. Main find-ings of the Informal sector survey ( IS Survey) 2007. Hanoi, Vietnam : GSO−ISS/ IRD−DIAL project : Author.
Gujarati, D. N., & Porter, D. C. (2009). Basis
Econometrics: Mc Graw− Hill International Edition.
Ha Tay People’s Committee. (2006). Decision
2189/Q−D−UBND.
Ha Tay People’s Committee. (2007a). Decision
1098/2007/Q−D−UBND.
Ha Tay People’s Committee. (2007b). Decision