Abstract:
A study was performed to investigate whether expression of aquaporin (AQP) 3 and 5 has potential as a marker for distinguishing dry mouth from Sjögren’s syndrome. Twenty-five patients underwent labial minor salivary gland biopsy (dry mouth, n = 9; Sjögren’s syndrome, n = 16; control, n = 8). All patients were interviewed about their medical history and subjective oral symptoms, and intraoral examinations were conducted. Quantitative real-time polymerase chain reaction (qRT-PCR) and immuno-histochemistry were used to examine the expression and localization of AQP3 and 5. Significant differ-ences in oral dryness, dry eye, medical history, and Saxon test results were revealed among the groups. However, there were no significant inter-group differences in expression of mRNA for AQP3 and 5. Immunohistochemical staining for AQP3 was local-ized mainly in the basolateral and part of the ductal cell membrane, and was barely evident in the apical membrane of acinar cells. AQP5 was localized to the basolateral and apical membrane and cytoplasm, but not the ductal cell membrane. Staining intensity for AQP3 in the apical membrane was significantlystronger in Sjögren’s syndrome, and that for AQP5 was significantly weaker in dry mouth. Taken together, the present data suggest that expression of AQP3 and 5 may be a marker for distinguishing between patients with dry mouth and those with Sjögren’s syndrome. Keywords: aquaporin; dry mouth; Sjögren’s syndrome.
Introduction
Xerostomia is a subjective sensation of mouth dryness, unlike hyposalivation, which is the term used to describe an objective decrease in salivary secretion (1). The sensa-tion of mouth dryness is sometimes, but not necessarily accompanied by a reduction in salivary flow (2). The symptoms of xerostomia include halitosis, oral soreness and burning, difficulty in swallowing and talking, and an altered taste sensation. As a result, xerostomia can reduce the quality of life. It has been reported that about 20% of the general population experience mouth dryness (2). Therefore, an understanding of xerostomia and effec-tive treatment are important. As xerostomia has various symptoms that can be detected by different examination methods, standardized methods for diagnosis and treat-ment have not been established.
Xerostomia has been associated with various diseases and aging (3-5). One of the most common diseases characterized by salivary gland impairment is Sjögren’s syndrome (SS), an autoimmune inflammatory disease characterized by glandular hypofunction, dry mouth, and dry eyes. Salivary gland biopsies show salivary and Journal of Oral Science, Vol. 60, No. 2, 212-220, 2018
Original
Expression of aquaporin 3 and 5 as a potential marker for
distinguishing dry mouth from Sjögren’s syndrome
Tomoko Ichiyama
1,2), Eiji Nakatani
3), Kasumi Tatsumi
1), Katsumi Hideshima
1),
Takeshi Urano
4), Yoshiki Nariai
1,5), and Joji Sekine
1)1)
Department of Oral and Maxillofacial Surgery, Shimane University Faculty of Medicine, Izumo, Japan
2)Department of Oral and Maxillofacial Surgery, Masuda Red Cross Hospital, Masuda, Japan
3)
Translational Research Informatics Center, Foundation for Biomedical Research and Innovation, Kobe, Japan
4)Department of Biochemistry, Shimane University Faculty of Medicine, Izumo, Japan
5)
Department of Oral and Maxillofacial Surgery, Matsue City Hospital, Matsue, Japan
(Received April 12, 2017; Accepted August 9, 2017)
Correspondence to Dr. Joji Sekine, Department of Oral and Maxillofacial Surgery, Shimane University Faculty of Medicine, 89-1 Enya-cho, Izumo 693-8501, Japan
Fax: +81-853-20-2299 E-mail: [email protected] Color figures can be viewed in the online issue at J-STAGE. doi.org/10.2334/josnusd.17-0150
lacrimal gland tissue reduction with lymphocytic infiltra-tion (6,7). In Japan, the diagnostic criteria for SS were revised in 2004 by a research team from the Ministry of Health, Labour and Welfare (8). The American-European Consensus Group issued a new standard in 2002 with the goal of standardizing the diagnosis of SS worldwide (9). Primary SS presents alone, whereas secondary SS occurs in connection with autoimmune rheumatic diseases. In addition, the symptoms do not always present concur-rently. This diversity of symptomatic expression adds to the difficulty of initial diagnosis (10). It is not always easy to distinguish SS from other forms of xerostomia. Indeed, other two sets of criteria have been proposed in the last decade, including the 2012 American College of Rheumatology (ACR) criteria (11) and the latest set in 2016 by the ACR in association with the European League against Rheumatism (EULAR) (12).
The aquaporins (AQPs) are a family of water-specific membrane channel proteins found in almost all internal organs (13). AQPs respond to osmotic pressure and play an important role in the rapid transfer of water across cell membranes. Currently, 13 isoforms (AQPs 0-12) have been identified in mammals (13-15). AQPs 3 and 5 are expressed in the human salivary gland and play an important role in saliva secretion (16). Some investiga-tors have demonstrated that changes in the localization pattern of AQP5 cause the salivation disorder seen in SS patients (17). However, data on the expression, localiza-tion, and role of AQP3 and 5 in the salivary gland have been conflicting. In the present study we hypothesized that expression of AQP3 and 5 could be a potential marker for distinguishing patients with dry mouth from those with SS.
Materials and Methods
Participant characteristics
Between September 2011 and June 2014 at the Depart-ment of Oral and Maxillofacial Surgery, Shimane University Hospital, samples were collected from 25 patients with a chief complaint of dry mouth. All of the patients underwent labial minor salivary gland biopsy and were examined according to the revised Japanese criteria of the Research Committee on SS of the Japanese Ministry of Health and Welfare (Table 1) (8) under a suspected diagnosis of SS. Surgical samples were fixed in 10% formalin, dehydrated, and embedded in paraffin wax.
In accordance with the revised Japanese criteria for SS (8), if at least 50 lymphocytes were demonstrable in a 4-mm2 glandular section by hematoxylin and eosin staining, and at least one other criterion was positive, SS was diagnosed. The results of SS diagnosis are shown in Table 2.
Sixteen patients were diagnosed as having SS. Nine patients who had no history of autoimmune disease or radiotherapy of the head and neck, and did not fit the diagnostic criteria for SS but had hyposalivation and xerostomia were diagnosed as having dry mouth (DM). Eight patients who had undergone cystectomy of a lower lip mucus retention cyst without head and neck radiotherapy, and had no symptoms of dry mouth, hyposalivation, or medication were used as normal controls (18). For ethical reasons it was, of course, diffi-cult to obtain “normal” specimens of glandular tissue as control samples.
This study conformed to the ethical guidelines for epidemiological research issued by the MHLW and the Ministry of Education, Culture, Sports, Science and Table 1 Revised Japanese criteria for Sjögren’s syndrome
1. Histopathology
Definition: Positive for at least one of (A) or (B):
(A) Focus score >1 (periductal lymphoid cell infiltration >50) in a 4-mm2 minor salivary gland biopsy
(B) Focus score >1 (periductal lymphoid cell infiltration >50) in a 4-mm2 lacrimal gland biopsy
2. Oral examination
Definition: Positive for at least one of (A) or (B):
(A) Abnormal findings in sialography > Stage I (diffuse punctate shadows of less than 1 mm)
(B) Decreased salivary secretion (flow rate ≤10 mL/10 min according to the chewing gum test or ≤2 g/2 min according to the Saxon test) and decreased salivary function according to salivary gland scintigraphy
3. Ocular examination
Definition: Positive for at least one of (A) or (B):
(A) Schirmer’s test ≤5 mm/5 min and rose Bengal test >3 according to the van Bijsterveld score (B) Schirmer’s test ≤5 mm/5 min and positive fluorescein staining test
4. Serological examination
Definition: Positive for at least one of (A) or (B): (A) Anti-Ro/SS-A antibody
(B) Anti-La/SS-B antibody
Technology, and was approved by the Ethics Committee of Shimane University (approval no. 907, 29 August 2011). The specimens used in this study were stored in the Department of Oral and Maxillofacial Surgery, Shimane
University Faculty of Medicine. After study approval, all participants provided written informed consent for use of their clinical data and specimens.
Table 2 Correlation of SS case number related revised Japanese criteria for Sjögren’s syndrome
SS case number 1. Histopathology 2. Oral examination 3. Ocular examination 4.Serological examination
1 A - - A, B 2 A - - A, B 3 A - - A 4 A A - -5 A - - A 6 A - - A 7 A - A -8 A - A, B -9 A - - A, B 10 A - - A 11 A - - A, B 12 A - - A 13 A A - -14 A A, B A, B A 15 A - - A 16 A - - B
A and B refer to items A and B in the diagnostic criteria of revised Japanese criteria for Sjögren’s syndrome (Table 1). Dashes indicate “not applicable”.
Table 3 Comparison of participant background, subjective symptoms, and intraoral findings
Variable Control (n = 8) DM (n = 9) SS (n = 16) P value
Background Age (years) 25.0 ± 25.2 67.1 ± 13.1 67.7 ± 11.8 0.005* Sex (female) 5 (62.5%) 6 (66.7%) 16 (100%) 0.014* Subjective symptoms Oral dryness 0 9 (100%) 12 (75%) <0.001* Thirst 0 3 (33.3%) 3 (18.8%) 0.267
Drinking a large amount of water 1 (12.5%) 1 (11.1%) 7 (43.8%) 0.179
Hyposalivation 0 2 (22.2%) 5 (31.3%) 0.287
Difficulty swallowing dry food 0 1 (11.1%) 1 (6.3%) 1
Dysgeusia 0 1 (11.1%) 2 (12.5%) 0.415 Intraoral pain 0 1 (11.1%) 3 (18.8%) 0.789 Dry eye 0 8 (88.9%) 11 (68.8%) <0.001* Dry nose 0 1 (11.1%) 0 0.515 Cough 0 1 (11.1%) 5 (31.3%) 0.224 Muscle pain 0 1 (12.5%) 3 (18.8%) 0.786 Arthralgia 0 2 (22.2%) 5 (31.3%) 0.287 Dry skin 0 0 4 (25%) 0.157 Rash 0 1 (11.1%) 2 (12.5%) 0.789 Intraoral findings
Frequent occurrence of caries 1 (12.5%) 1 (11.1%) 2 (12.5%) 1
Atrophy of oral mucosa 0 2 (22.2%) 2 (12.5%) 0.444
Atrophy of tongue papillae 0 2 (22.2%) 6 (37.5%) 0.141
Angular chelitis 0 1 (11.1%) 0 0.515
Tongue coat 0 3 (42.9%) 6 (37.5%) 0.096
Tongue pain 0 1 (11.1%) 4 (25%) 0.472
Fissured tongue 0 1 (11.1%) 1 (6.3%) 1
Geographic tongue 0 1 (11.1%) 0 0.515
Redness of oral mucosa and tongue 0 1 (11.1%) 3 (18.8%) 0.789
Dry mouth and tongue 0 1 (11.1%) 8 (57.1%) 0.007*
Halitosis 0 0 0 –
Redness of opening of the parotid duct 0 0 1 (6.3%) 1
DM, patients with dry mouth; SS, Sjögren’s syndrome. For subjective symptoms and intraoral findings, binary variables (presence or absence) are summarized by number (percentage) of patients with presence of the variable. Continuous variables are given as mean ± SD. The asterisk (*) indicates P < 0.05 in the Kruskal-Wallis test and Fisher’s exact test.
Oral examination
All patients were interviewed about their medical history and subjective oral symptoms (oral dryness, thirst, drinking a large amount of water, hyposalivation, difficulty swallowing dry food, dysgeusia, intraoral pain, dry eye, medical history, dry nose, cough, muscle pain, arthralgia, dry skin, rash) and underwent an intraoral examination (high prevalence of caries, atrophy of the oral mucosa, atrophy of the tongue papillae, angular chelitis, tongue coat, tongue pain, fissured tongue, geographic tongue, redness of the oral mucosa and tongue, dry mouth and dry tongue, halitosis, and redness of the opening of the parotid duct). Oral examinations (Table 3) were conducted with the aid of a dental mirror under optimal lighting while patients were seated in a dental chair.
Salivary flow volume
Gum tests and Saxon tests were performed for all patients. For the gum test, participants were instructed to chew mint-flavored gum for 10 min, then to bite down on a folded, weighed piece of gauze for 2 min. The gauze and a laboratory dish containing the remaining intraoral saliva were then weighed. Hyposalivation was defined as a flow rate of ≤10 mL in 10 min by the gum test or ≤2 g in 2 min by the Saxon test.
Expression levels of aquaporin 3 and 5 mRNA determined using qRT-PCR
Labial minor salivary gland tissues taken at the time of biopsy or cystectomy from 2011 through 2014 were subjected to mRNA analysis. A total of 33 frozen samples (50 mg each) were analyzed for AQP3 and 5 transcript expression by qRT-PCR using the Taqman system (Life Technologies, Tokyo, Japan). Total RNA (1 µg per sample) was extracted from frozen tissues by homog-enization using Sepasol-RNA I SuperG reagent (Nakarai Tesque, Kyoto, Japan), and cDNA was synthesized from the mRNA in accordance with the manufacturer’s protocol. Levels of AQP3 and 5 expression and the internal reference, beta-actin, were measured by PCR using the ReverTra Ace kit and the ABI PRISM 7500 Sequence Detection System.
Immunohistochemical staining and image analysis Dewaxed 4-µm-thick tissue sections were incubated for 30 min in 0.3% hydrogen peroxide in methanol to quench endogenous peroxidase activity. Pretreatment consisted of autoclave antigen retrieval in phosphate-buffered saline (phosphate-buffered salt tablets, pH 7.4; TAKARA BIO Inc., Kusatsu, Japan). The following antibodies were
used: rabbit polyclonal anti-C-terminus of human AQP3 (1:500 dilution incubated for 1 h at room temperature; Abcam, Cambridge, MA, USA), rabbit monoclonal anti-C-terminus of human AQP5 (1:200 dilution incubated for 16 h at 4°C), and secondary antibody (30 min incu-bation at room temperature, Histofine MAX-PO [M]; Nichirei, Tokyo, Japan). Sections were then incubated in a substrate solution consisting of 0.05% diaminobenzi-dine tetrahydrochloride. Counterstaining was done with Mayer’s hematoxylin for 30 s. Negative controls for immunohistochemistry were incubated with phosphate-buffered saline instead of the primary antibodies, and showed no positive reaction.
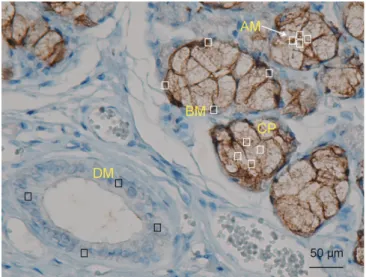
The areas (mm2) of AQP3 and 5 immunostaining were quantified under high magnification (×40 objective lens) using a standard light microscope to ensure measure-ment quality. Four square areas (3 × 3 mm) including the apical, basolateral, and ductal cell membranes and cytoplasm of the labial minor salivary gland were randomly selected on the screen. The intensity of AQP3 and 5 immunoreactivity was then evaluated using Image J software (Version 1.47, National Institutes of Health, Bethesda, MD, USA) by analyzing the brightness of each pixel in RGB images, high values indicating weak inten-sity and low values strong inteninten-sity. The mean inteninten-sity of the four square areas was then calculated (Fig. 1). Statistical analysis
Continuous and categorical variables are shown as means ± standard deviations (SDs) and as frequencies and percentages, respectively. Results were compared among the groups using the Wilcoxon rank sum test or Kruskal-Wallis test (when the number of groups was 2 or ≥3, respectively) for continuous variables, and Fisher’s exact test for categorical variables. To investigate whether the combination of AQP3 and 5 expression levels in certain regions distinguished the three groups, we performed conditional inference tree analysis. Differences at P ≤ 0.05 were considered statistically significant. All statis-tical analyses were performed using SAS (Version 9.3, Cary, NC, USA) and R (Version 3.2.2, R Foundation, Vienna, Austria) with “ctree” as the library.
Results
Participant characteristics and oral examination findings
The characteristics of the participants are shown in Table 3. The study subjects comprised 33 patients, including eight controls (three male, five female, 25.0 ± 25.2 years old), nine with DM (three male, six female, 67.1 ± 13.1 years old), and 16 with SS (16 female, 67.7 ± 11.8 years
old). There were significant differences in age and sex among the groups (P = 0.005 and P = 0.014, respec-tively). With regard to subjective symptoms and intraoral findings, significant differences among the groups were revealed for oral dryness (control, 0; DM, 9 [100%]; SS, 12 [75%]) and dry eye (control, 0; DM, 8 [88.9%]; SS, 11 [68.8%]), and dry mouth and tongue (control, 0; DM, 1 [11.1%]; SS, 8 [57.1%]), but not for other variables. A greater proportion of patients with DM and SS had oral dryness, dry eye, and dry mouth and tongue, compared with the controls (P < 0.05 for all).
Salivary flow volume
Significant differences were found among the groups for
the Saxon test (control, 4.6 ± 2.4 g in 2 min; DM, 2.3 ± 1.9 g in 2 min; SS, 1.4 ± 0.9 g in 2 min; P = 0.004, Table 4), but not the gum test (control, 17.9 ± 7.6 mL in 10 min; DM, 11.6 ± 8.5 mL in 15 min; SS, 10.7 ± 5.9 mL in 15 min; P = 0.122, Table 4). There was a significant difference between the control and SS groups (P = 0.005, Fig. 2).
Expression of AQP3 and 5 mRNA
There was no significant difference in the mRNA expres-sion of AQP3 (control, 0.64 ± 1.33; DM, 0.08 ± 0.05; SS, 0.27 ± 0.467; P = 0.264, Table 4) or AQP5 (control, 0.58 ± 0.53; DM, 0.20 ± 0.18; SS, 0.24 ± 0.23; P = 0.069, Table 4) among the three participant groups.
Fig. 1 Areas of immunoreactive intensity measurement.
Immunore-active intensity was measured in four square areas (3 × 3 mm). Scale bars indicate 50 μm. Magnification: ×40. AM, apical cell membrane; BM, basolateral cell membrane; DC, ductal cell membrane; CP, cytoplasm.
Fig. 2 Distribution of Saxon test results among the three participant
groups. Abbreviations are as used in Table 3. The asterisk (*) indi-cates P < 0.05 in the Wilcoxon rank sum test.
Table 4 Comparison of salivary flow volume, mRNA expression level, and immunoreactive intensity
Variable Control (n = 8) DM (n = 9) SS (n = 16) P value
Salivary flow volume
Gum test (mL in 10 min) 17.9 ± 7.6 11.6 ± 8.5 10.7 ± 5.9 0.122
Saxon test (g in 2 min) 4.6 ± 2.4 2.3 ± 1.9 1.4 ± 0.9 0.004*
mRNA expression relative to beta-actin
AQP3 0.64 ± 1.33 0.08 ± 0.05 0.27 ± 0.467 0.264
AQP5 0.58 ± 0.53 0.20 ± 0.18 0.24 ± 0.23 0.069
Immunoreactive intensity of AQP
AQP3, apical cell membrane 172.3 ± 3.6 176.8 ± 9.2 180.7 ± 6.3 0.037*
AQP3, basolateral cell membrane 122.1 ± 10.5 117.6 ± 11.4 116.9 ± 14.9 0.575
AQP3, ductal cell membrane 133.7 ± 9.4 133.3 ± 11.4 116.9 ± 14.9 0.022*
AQP5, apical cell membrane 134.6 ± 9.0 108.3 ± 18.6 132.7 ± 22.1 0.011*
AQP5, basolateral cell membrane 118.4 ± 11.8 124.1 ± 11.6 121.7 ± 6.1 0.269
AQP5, cytoplasm 155.2 ± 7.6 139.7 ± 17.6 157.7 ± 10.8 0.009*
AQP5, ductal cell membrane 152.8 ± 6.8 159.1 ± 10.2 157.7 ± 10.8 0.297
AQP: Aquaporin; other abbreviations are as used in Table 3. Continuous variables are given as mean ± SD. The asterisk (*) indicates P < 0.05 in the Kruskal-Wallis test.
Localization of AQP3 and 5
In the control group, AQP3 was localized to the basolat-eral cell membrane (BM) of acinar cells and part of the ductal cell membrane (DC), and was barely expressed in the apical cell membrane (AM) and cytoplasm (CP) of acinar cells (Fig. 3). AQP5 was localized to the BM, AM, and CP of acinar cells, but was not evident in the DM (Fig. 3).
Intensity of AQP3 and 5 immunoreactivity
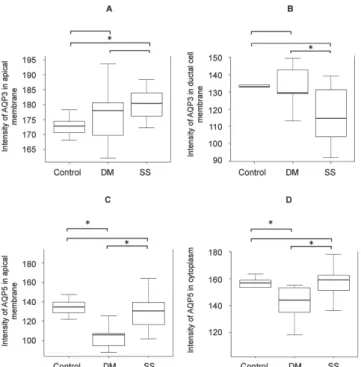
The intensity of AQP3 and 5 immunoreactivity in the apical and basolateral cell membranes of acinar cells and in the ductal cell membrane was compared among the groups (Table 4). The intensity of AQP3 immunore-activity in the apical cell membrane of acinar cells and the ductal cell membrane was significantly stronger in the SS group than in the control and DM groups (apical cell membrane: control, 172.8 ± 3.6; DM, 176.8 ± 9.2; SS, 180.7 ± 6.3; ductal cell membrane: control, 133.7 ± 9.4; DM, 133.3 ± 11.4; SS, 116.9 ± 14.9; P = 0.037
and P = 0.022, respectively, Table 4). The intensity of AQP5 immunoreactivity in the apical cell membrane of acinar cells and the cytoplasm was significantly weaker in the DM group than in the control and SS groups (apical cell membrane: control, 134.6 ± 9.0; DM, 108.3 ± Fig. 3 Localization of AQP3 and 5 in human labial salivary glands.
Abbreviations are as used in Table 3. AQP3 was localized to the basolateral cell membrane (BM) of acinar cells and part of the ductal cell membrane (DC) in patients with DM and SS, and was barely seen in the apical cell membrane (AM) and cytoplasm (CP) of acinar cells in the control group. AQP5 was localized to the BM, AM, and CP of acinar cells, but was not seen in the DC among the three participant groups. All scale bars indicate 100 μm. Magnification: ×20.
Fig. 4 Immunoreactive intensity of AQP3 and -5. Abbreviations
are as used in Tables. (A) Immunoreactive intensity of AQP3 in the apical membrane (AM) of acinar cells. (B) Immunoreactive intensity of AQP3 in the ductal cell membrane (DC). (C) Immunoreactive intensity of AQP5 in the AM of acinar cells. (D) Immunoreactive intensity of AQP5 in the cytoplasm (CP). The asterisk (*) indicates
P < 0.05 in the Wilcoxon rank sum test.
Fig. 5 Tree diagram for distinguishing the three participant groups
according to the immunoreactive intensity of AQP3 and 5 in the apical cell membrane of acinar cells. Abbreviations are as used in Tables.
18.6; SS, 132.7 ± 22.1; cytoplasm: control, 155.2 ± 7.6; DM, 139.7 ± 17.6; SS, 157.7 ± 10.8; P = 0.011 and P = 0.009, respectively, Table 4). The intensity of AQP3 immunoreactivity in the apical cell membrane of acinar cells did not differ significantly between the control and SS groups (P = 0.005, Fig. 4A). The intensity of AQP3 immunoreactivity in the ductal cell membrane showed a significant difference between DM and SS (Fig. 4B). The intensity of AQP5 immunoreactivity in the apical cell membrane differed significantly between the control and DM, and the DM and SS groups (P = 0.018, P = 0.005, respectively, Fig. 4C). The intensity of AQP5 immunoreactivity in the cytoplasm differed significantly between the control and DM, and the DM and SS groups (P = 0.018, P = 0.004, respectively, Fig. 4 D).
Tree analysis showed that the combination of AQP3 (P = 0.011) and AQP5 (P = 0.016) in the apical cell membrane of acinar cells was able to distinguish the three groups (Fig. 5). The subgroup showing an intensity of AQP5 immunoreactivity of ≤107.501 included seven out of eight (87.5%) patients with DM, the subgroup with AQP5 > 107.501 and AQP3 ≤ 174.407 included five out of six (83.3%) healthy participants, and the subgroup with AQP5 > 107.501 and AQP3 > 174.407 included 14 out of 19 (78.9%) patients with SS.
Discussion
In this study, there were significant differences in the characteristics of the participant groups, including oral dryness, dry eye, and dry mouth and tongue (Table 3). These results supported the classification of the
partici-pants’ clinical diagnoses based on the criteria for DM and SS.
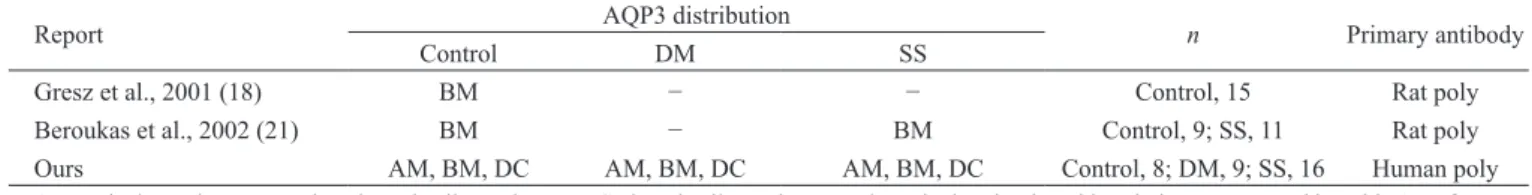
AQP3 mRNA has been detected by RT-PCR in normal and SS human labial salivary glands, but not in patients with DM (16,19,20). Gresz et al. (16) reported that in normal individuals, AQP3 was localized to the basolat-eral cell membrane but not the apical cell membrane of labial acinar salivary gland cells, and was not detected in the ductal cell membrane. In addition, Beroukas et al. (19) reported that immunohistochemical expression of AQP3 in salivary gland cells was similar in individuals with and without SS. In our study, the expression of AQP3 mRNA was similar among the participant groups, and AQP3 was localized to the basolateral cell membrane (and to a lesser extent, the apical cell membrane) in acinar cells, and to the basolateral cell membrane in ductal cells. The distribution of AQP3 determined by immunohisto-chemical assay, including previous reports and ours, is summarized in Table 5. The detection of AQP3 in the ductal cell membrane in the present study differs from previous reports (16,19). Furthermore, AQP3 staining intensity in the apical cell membrane of acinar cells was significantly lower in patients with SS than in controls. Although a functional role for AQP3 in salivary secretion has not been postulated previously, our data suggest that AQP3 may play an important role in saliva secretion and in the pathogenesis of dry mouth conditions, including SS.
Several investigators have reported that in normal indi-viduals, AQP5 was localized to the apical cell membrane of serous acinar cells, and not detected in the basolateral Table 5 Distribution of AQP3 in human labial salivary gland
Report AQP3 distribution n Primary antibody
Control DM SS
Gresz et al., 2001 (18) BM − − Control, 15 Rat poly
Beroukas et al., 2002 (21) BM − BM Control, 9; SS, 11 Rat poly
Ours AM, BM, DC AM, BM, DC AM, BM, DC Control, 8; DM, 9; SS, 16 Human poly
AM, apical membrane; BM, basolateral cell membrane; DC, ductal cell membrane; poly, polyclonal; other abbreviations are as used in Table 1. References are given in brackets. Dash indicates “no data”.
Table 6 Distribution of AQP5 in human labial salivary gland
Report Control AQP5 distributionDM SS n Primary antibody
Gresz et al., 2001 (16) AM − − Control, 15 Human poly
Gresz et al., 2015 (18) AM − Control, 5; SS, 5 Human poly
Beroukas et al., 2002 (19) AM − Control, 11; SS, 12 Rat poly
Steinfeld et al., 2001 (17) AM (primarily), DC BM (primarily), AM, DC Control, 10; DM, 4; SS, 10 Human poly
Xiao et al., 2011 (24) AM, BM, DC − AM, BM, DC Control, –; SS, 16 Human poly
Ours AM, BM, CP, DC AM, BM, CP, DC AM, BM, CP, DC Control, 8; DM, 9; SS, 16 Human mono
cell membrane and duct cells (16,18,19). The immu-nohistochemical distribution of AQP5 in human labial glands from individuals with and without SS has been controversial. Gresz et al. (16) demonstrated that AQP5 staining was apical at the acinar cell membrane, and that no AQP5 staining was present in the ducts of labial glands. Beroukas et al. (19) and Waterman et al. (21,22) also demonstrated that AQP5 was localized apically in the acinar cells of patients with SS, while Steinfeld et al. (17,23) and Xiao et al. (24) demonstrated that AQP5 was also localized to the basolateral cell membrane of acinar cells. Steinfeld et al. (17,23) reported that AQP5 distribution was greater at the basolateral cell membrane of acinar cells in patients with SS relative to controls, but lower at the apical cell membrane of acinar cells. In patients with dry mouth in our study, AQP5 was local-ized to the apical cell membrane of acinar cells, but was not detected in the basolateral cell membrane (17); however, Gresz et al. (18) concluded that basolateral AQP5 staining in salivary acinar cells was nonspecific background staining, and were unable to demonstrate any altered AQP5 distribution in the salivary glands of patients with SS by immunohistochemistry. In contrast, Lee et al. (25) concluded that autoantibodies against the muscarinic type 3 receptor (M3R) in patients with SS inhibit AQP5 trafficking and detection of AQP5 expression in the apical cell membrane. The distribu-tion of AQP5 according to immunohistochemistry and RT-PCR appears to depend on the cell lines examined, the analytical methods employed, and the sensitivity and specificity of the antibodies.
In our study, expression of AQP5 mRNA did not differ among the three groups. In the control group, AQP5 was localized mainly to the basolateral cell membrane and expressed slightly in the apical cell membrane, but was not detected in duct cells. In the DM and SS groups, AQP5 was localized to the basolateral cell membrane and slightly evident in the apical cell membrane of acinar cells, but was not localized to the ductal cell membrane. AQP5 staining intensity in the apical cell membrane of acinar cells was significantly higher in the DM group than in the control group, and was significantly lower in the SS group than in the DM group. AQP5 distribution, the numbers of participants, and the primary antibodies used in previous studies and our present study are summarized in Table 6. The discrepancy between Gresz’s conclusions and our results regarding AQP5 distribution in the acinar gland may be accounted for by differences in the antibody used and the number of study partici-pants. Gresz et al. (16) used affinity-purified polyclonal antibodies against human AQP5, whereas we used rabbit
monoclonal antibodies. More detailed studies using monoclonal antibodies against human AQP in a larger number of participants would be needed to confirm the reliability of our present findings.
In this preliminary study, tree diagram analysis showed that a high intensity of both AQP3 and 5 immu-noreactivity in the apical cell membrane of acinar cells may indicate SS. Therefore, the distribution of AQP3 and 5 immunostaining in the apical cell membrane of the minor salivary gland may be a key factor to distinguish between SS and DM. As the number of cases in this study was small and this is the first report to have examined AQP5 expression using immunohistochemistry with a monoclonal antibody, further studies are encouraged.
The present study was limited by a discrepancy in the average age of individuals in the three groups. The patients with mucus retention cysts were much younger than those with SS or DM. Physiological changes in AQP with aging may have been present in the SS and DM groups, and this possibility will need to be investigated elsewhere.
In conclusion, the expression of AQP3 and 5 has potential use as a marker for distinguishing patients with DM and from those with SS.
Acknowledgments
The Translational Research Informatics Center analyzed and guaranteed the quality of the dataset collected and provided by the principal investigator, but was not involved in the process of data collection in this research.
Conflict of interest
The authors have no conflict of interest to declare.
References
1. Dawes C, Pedersen AM, Villa A, Ekström J, Proctor GB, Vissink A et al. (2015) The functions of human saliva: a review sponsored by the World Workshop on Oral Medicine VI. Arch Oral Biol 60, 863-874.
2. Hopcraft MS, Tan C (2010) Xerostomia: an update for clini-cians. Aust Dent J 55, 238-244.
3. Daniels TE (2000) Evaluation, differential diagnosis, and treatment of xerostomia. J Rheumatol Suppl 61, 6-10. 4. Ship JA, Pillemer SR, Baum BJ (2002) Xerostomia and the
geriatric patient. J Am Geriatr Soc 50, 535-543.
5. Gupta A, Epstein JB, Sroussi H (2006) Hyposalivation in elderly patients. J Can Dent Assoc 72, 841-846.
6. Fox RI (2005) Sjögren’s syndrome. Lancet 366, 321-331. 7. Nikolov NP, Illei GG (2009) Pathogenesis of Sjögren’s
syndrome. Curr Opin Rheumatol 21, 465-470.
8. Fujibayashi T, Sugai S, Miyasaka N, Hayashi Y, Tsubota K (2004) Revised Japanese criteria for Sjögren’s syndrome
(1999): availability and validity. Mod Rheumatol 14, 425-434. 9. Vitali C, Bombardieri S, Jonsson R, Moutsopoulos HM,
Alexander EL, Carsons SE et al. (2002) Classification criteria for Sjögren’s syndrome: a revised version of the European criteria proposed by the American-European Consensus Group. Ann Rheum Dis 61, 554-558.
10. Manthorpe R, Asmussen K, Oxholm P (1997) Primary Sjögren’s syndrome: diagnostic criteria, clinical features, and disease activity. J Rheumatol Suppl 50, 8-11.
11. Shiboski SC, Shiboski CH, Criswell L, Baer A, Challacombe S, Lanfranchi H et al. (2012) American College of Rheu-matology classification criteria for Sjögren’s syndrome: a data-driven, expert consensus approach in the Sjögren’s International Collaborative Clinical Alliance cohort. Arthritis Care Res (Hoboken) 64, 475-487.
12. Shiboski CH, Shiboski SC, Seror R, Criswell LA, Labetoulle M, Lietman TM et al. (2017) 2016 American College of Rheumatology/European League Against Rheumatism classi-fication criteria for primary Sjögren’s syndrome: a consensus and data-driven methodology involving three international patient cohorts. Ann Rheum Dis 76, 9-16.
13. King LS, Yasui M (2002) Aquaporins and disease: lessons from mice to humans. Trends Endocrinol Metab 13, 355-360. 14. Morishita Y, Sakube Y, Sasaki S, Ishibashi K (2004) Molec-ular mechanisms and drug development in aquaporin water channel diseases: aquaporin superfamily (superaquaporins): expansion of aquaporins restricted to multicellular organ-isms. J Pharmacol Sci 96, 276-279.
15. Tenckhoff S, Hollborn M, Kohen L, Wolf S, Wiedemann P, Bringmann A (2005) Diversity of aquaporin mRNA expressed by rat and human retinas. Neuroreport 16, 53-56.
16. Gresz V, Kwon TH, Hurley PT, Varga G, Zelles T, Nielsen S et al. (2001) Identification and localization of aquaporin water channels in human salivary glands. Am J Physiol Gastrointest Liver Physiol 281, G247-254.
17. Steinfeld S, Cogan E, King LS, Agre P, Kiss R, Delporte C (2001) Abnormal distribution of aquaporin-5 water channel protein in salivary glands from Sjögren’s syndrome patients. Lab Invest 81, 143-148.
18. Gresz V, Horvath A, Gera I, Nielsen S, Zelles T (2015) Immunolocalization of AQP5 in resting and stimulated normal labial glands and in Sjögren’s syndrome. Oral Dis 21, e114-120.
19. Beroukas D, Hiscock J, Gannon BJ, Jonsson R, Gordon TP, Waterman SA (2002) Selective down-regulation of aqua-porin-1 in salivary glands in primary Sjögren’s syndrome. Lab Invest 82, 1547-1552.
20. Enger TB, Aure MH, Jensen JL, Galtung HK (2014) Calcium signaling and cell volume regulation are altered in Sjögren’s Syndrome. Acta Odontol Scand 72, 549-556.
21. Waterman SA, Beroukas D, Hiscock J, Jonsson R, Gordon TP (2002) Distribution of salivary aquaporin-5 in Sjögren’s syndrome [letter]. Lancet 359, 1778.
22. Waterman SA, Beroukas D, Hiscock J, Jonsson R, Gordon TP (2003) Aquaporins in primary Sjögren’s syndrome: comment on the articles by Steinfeld et al. Arthritis Rheum 48, 1167-1168.
23. Steinfeld SD, Appelboom T, Delporte C (2002) Treatment with infliximab restores normal aquaporin 5 distribution in minor salivary glands of patients with Sjögren’s syndrome. Arthritis Rheum 46, 2249-2251.
24. Xiao L, Ng TB, Feng YB, Yao T, Wong JH, Yao RM et al. (2011) Dendrobium candidum extract increases the expres-sion of aquaporin-5 in labial glands from patients with Sjögren’s syndrome. Phytomedicine 18, 194-198.
25. Lee BH, Gauna AE, Perez G, Park YJ, Pauley KM, Kawai T et al. (2013) Autoantibodies against muscarinic type 3 receptor in Sjögren’s syndrome inhibit aquaporin 5 trafficking. PLoS One 8, e53113.