Stunted and Distorted Industrialization in
Myanmar
著者
Kudo Toshihiro
権利
Copyrights 日本貿易振興機構(ジェトロ)アジア
経済研究所 / Institute of Developing
Economies, Japan External Trade Organization
(IDE-JETRO) http://www.ide.go.jp
journal or
publication title
IDE Discussion Paper
volume
38
year
2005-10-01
INSTITUTE OF DEVELOPING ECONOMIES
Discussion Papers are preliminary materials circulated
to stimulate discussions and critical comments
Abstract
More than 15 years have passed since Myanmar embarked on its transition from a
centrally planned economy to a market-oriented one. The purpose of this paper is to
provide a bird-eye’s view of industrial changes from the 1990s up to 2005. The industrial
sector showed a preliminary development in the first half of the 1990s due to an “open
door” policy and liberalization measures. However, a brief period of growth failed to
effect any changes in the economic fundamentals. The industrial sector still suffers from
poor power supplies, limited access to imported raw materials and machinery,
exchange rate instability, limited credit, and frequent changes of government regulation.
Public ownership is still high in key infrastructure sectors, and has failed to provide
sufficient services to private industries. What the government must do first is to get the
fundamentals right.
DISCUSSION PAPER No. 38
Stunted and Distorted
Industrialization in Myanmar
Toshihiro KUDO*
October 2005
Keywords: Myanmar (Burma), transitional economy, industry
JEL classification: L60, O14, P20
* Director, Economic and Technical Cooperation Studies Group, Inter-Disciplinary Studies Center, IDE ([email protected])
The Institute of Developing Economies (IDE) is a semigovernmental,
nonpartisan, nonprofit research institute, founded in 1958. The Institute
merged with the Japan External Trade Organization (JETRO) on July 1, 1998.
The Institute conducts basic and comprehensive studies on economic and
related affairs in all developing countries and regions, including Asia, Middle
East, Africa, Latin America, Oceania, and East Europe.
The views expressed in this publication are those of the author(s). Publication does not imply endorsement by the Institute of Developing Economies of any of the views expressed.
INSTITUTE OF DEVELOPING ECONOMIES (IDE), JETRO 3-2-2, WAKABA,MIHAMA-KU,CHIBA-SHI
CHIBA 261-8545, JAPAN
STUNTED AND DISTORTED INDUSTRIALIZATION
IN MYANMAR
∗[Contents] 1. Objectives
2. Industrial Development under a “Swing Door” Policy
(1) Preliminary Import-Substitution: Pent-up Demand and Competition with Imports
(2) Frustrated Development: the Shortage of Foreign Currency (3) Shift to a State-owned Factory Strategy
3. Growth, Stagnation and Features of Private Industry (1) Growth and Stagnation
(2) Entrepreneurs, Management and Business Climate
4. Infrastructure Development: Market Failure vs. Government Failure (1) Insufficient Investment
(2) Inefficient Management
(3) SEEs in Electricity, Communications and Petroleum 5. The Garment Industry: A Successful CMP-based “Enclave”
(1) Brief History
(2) CMP-based “Enclave”
(3) Regulation and Taxation on CMP Businesses 6. Conclusion: Getting the Fundamentals Right
Appendix: Survey on Private Firms in Myanmar References
Tables 1. Objectives
Industrialization is an essential part of overall economic development. Ever since the Industrial Revolution in Britain, the concept of development and the process of industrialization often have been treated as synonymous. Independent Myanmar, like other countries, hoped for a transformation of its agrarian economy into a modern
∗ The author thanks Prof. Koichi Fujita of Kyoto University for his encouragement. The
author is also grateful to the members of the study group entitled “Transition to a Market Economy in Myanmar: 15 years of Military Rule” organized by Institute of Developing Economies, JETRO, in 2003 and 2004.
industrial one. Myanmar had long pursued industrialization in the framework of a socialist planned economy using State Economic Enterprises (SEEs), which were established either by nationalization programs or through new public investments. The results after half a century were miserable, with Myanmar being reduced to Least Developed Country status in 1987.1 In the following year, the State Law and Order
Restoration Council or SLORC, which was renamed in 1997 as the State Peace and Development Council or SPDC, took power and abandoned the socialist economic system, heading toward a so-called market economy instead. More than 15 years have passed since Myanmar embarked on this new policy.
The purpose of this paper is to provide a bird-eye’s view of industrial changes from the 1990s up to 2005. During this period, on the one hand the industrial sector underwent dramatic changes while on the other it showed continuity from the socialist period and exhibited evolutionary change. How has the industrial sector changed during the transition to a market economy and with the provision of an “open door” policy? How far can Myanmar’s industrial development be understood in the context of the country’s overall economic development and changes in economic structure? In what ways have the government’s industrial and trade polices influenced industrial performances in Myanmar? This paper tries to comprehend the mechanism of development and/or underdevelopment of industry in Myanmar. Moreover, the author would like to investigate the factors that impede industrial development, most of which, he thinks, are deeply rooted in structural realities.
Industrialization can be defined in various ways. The industrial sector usually includes manufacturing and mining as well as construction, infrastructure services such as transportation, communications and energy, and so forth. While this paper focuses mainly on manufacturing, which constitutes a core part of the secondary sector, the author also pays due attention to other sectors of the economy.2 The infrastructure
1 For details, see Myat Thein, Economic Development of Myanmar, Singapore: Institute
of Southeast Asian Studies, 2004.
2 The Ministry of National Planning and Economic Development compiles GDP
statistics, using a 14-sector classification. In FY 2002, each sector contributed its share of total GDP at current producers’ prices as follows: agriculture 48.4%, livestock and fishery 5.8%, forestry 0.4%, energy 0.1%, mining 0.3%, processing and manufacturing 9.2%, electric power 0.1%, construction 3.3%, transport 6.0%, communications 0.3%, financial institutions 0.1%, social and administrative services 0.9%, rental and other services 1.5% and trade 23.6% (CSO, Statistical Yearbook, 2003). The figures clearly show the underdeveloped situation of the industrial sector of Myanmar. In Cambodia, for example, the manufacturing sector contributed 20.2% of total GDP in 2002, whereas the agriculture sector contributed 35.6%.
sector is of particular importance for overall industrial development.
In the second section, the author provides a history of industrial changes during the transitional period between the early 1990s and 2005. The author does not intend, however, to confine himself to a mere description of industrial change during the period in question. On the contrary, he tries to comprehend the structural transformation of the industrial sector in relation to the government’s economic policy. To a large extent, government economic policies have both promoted and constrained the industrial development of Myanmar. The author divides the period into three, namely preliminary development with the growth of pent-up demand, a slow-down during which structural problems surfaced, and a shift to a state-factory strategy.
In the third section, the author adds detail to the industrial history outlined in the previous section by means of firm-level survey data.3 Given the paucity of reliable
statistics in Myanmar, the firm-level observations based on field surveys can enrich description and can reinforce the arguments put forward. The survey data also provide firm-level observations on the characteristics of private enterprise as well as the investment and business climate in Myanmar.
In the fourth and fifth sections, two sub-sectors are taken as examples. One is the infrastructure sector, where state-owned economic enterprises (hereafter SEEs) dominate supply and markets. Because of their market power and scale economies with immobile investments, public enterprises tend to monopolize the infrastructure sector in many countries. However in Myanmar, SEEs in the infrastructure sector have so far seriously failed to provide much-needed services to customers, and in particular to industrialists. Poor infrastructure delivery at expensive prices has substantially hindered Myanmar’s industrial development. The example given later in the paper will show the ways in which public ownership hampers industrial development.
The other sub-sector analyzed here is the garments industry. This is a labor-intensive industry, and for many developing economies, it provides the first rung of the ladder leading to industrial development. Garment manufacturing in Myanmar registered a considerable success up to the imposition of sanctions by the United States in 2003, a measure that banned all imports from Myanmar. Garments manufacture provides an example of an industry that avoids a bad business environment and disadvantageous economic fundamentals by usage of the cutting, making and packing (CMP) system. The
3 For the outline of the survey, see Appendix: Survey on Private Firms in Myanmar
example shows us a means by which an industry can develop under a poor business climate. All in all, these cases will give us food for thought on the role of the government in industrial development in Myanmar.
Lastly, the author summarizes his arguments in a conclusion. Thus far, Myanmar has experienced a lengthy period of stunted and warped industrialization with an unstable macro-economy and distorted prices. Moreover, the government seems to have reversed its strategy of encouraging a market-oriented economy with a vibrant private sector and has returned to a planning-oriented one with state-owned enterprises. In addition to these developments, the investment climate and the industrial infrastructure are in very bad shape. All of these factors seem likely to hinder the industrial development of Myanmar for the foreseeable future.
At this point, a qualification must be made. The author tries to support his arguments using some firm-level observations based on a field survey as well as on available statistical data. However, he admits that most of his arguments lack robust supporting evidence mainly because of the scarcity and unreliability of statistics in Myanmar. Many aspects of his arguments call for further research and study. Nevertheless, it hoped that this study will be useful in providing an overall picture of industrial development and a frame of reference for understanding the mechanisms whereby Myanmar’s industrial development has become stunted and distorted,.
2. Industrial Development under a “Swing Door” Policy
During the socialist period, the government nationalized all production facilities and established new factories whenever they wanted to increase production. The government also closed the door to foreign capital except for ODA, which was received only after the economic crisis of the mid-1970s. Although the government called this policy self-reliant, its attitude was an extremely inward-looking one, and did not really lead to the growth of a vibrant industrial sector. On the contrary, it brought about import-dependent import-substitution industries, instead of self-reliant ones capable of standing on their own feet. Instead of saving scarce foreign currency by replacing imports, the inefficient government factories devoured imports in the process of making expensive and low quality “Made-in-Myanmar” products.
Interpreted in a broader perspective, this strategy is based on the traditional and rather crude policy of exploiting the agricultural sector.4 While the agricultural sector
generated a trade surplus in the early period after independence, its productivity gradually deteriorated and failed to generate a surplus large enough to finance state-owned factories. Meanwhile, the influx of ODA supported such industries up to the mid-1980s, by which stage it became clear that they would never stand on their feet without machinery and raw materials supplied by the donors5. When ODA was
suspended after the coup in 1988, the government had no money to run their factories, and they began to turn to the private sector for industrial development instead.
(1) Preliminary Import-Substitution: Pent-up Demand and Competition with Imports A series of economic reforms began with trade liberalization, both domestic and external. In 1987, one year before the military took power, the government suddenly gave up its monopoly over domestic trading in major kinds of agricultural produce. Shortly after the coup of 1988, the government allowed private sector businesses to engage in external trade and to retain export earnings, and started to legitimize and formalize border trade with neighboring countries, hitherto an activity that had been deemed illegal. Following this, in November 1988, foreign investment was also permitted, by the enactment of Foreign Investment Law (FIL).
Opening up external trade to private enterprises very greatly increased the number of exporters and importers. While about 1000 exporters/importers had registered in FY 19896, the number increased to about 2700 in the following fiscal year. It reached nearly
9000 by FY 1997. Thus, traders vigorously entered markets and started up new businesses.
Imported goods poured into the emerging consumer goods markets. The people had been cut off from purchasing daily commodities and durable consumer goods during the whole 26 years of the socialist period, and once they got access to them, the demand for such goods shot up. While consumer goods occupied 6% and 12% of total imports in FY 1980 and FY 1985 respectively, the corresponding figures shot up to 35% and 42% in FY 1990 and FY 1995 respectively.7
The release of pent-up demand for consumer goods also opened up opportunities for to an Open Economy” in Koichi Fujita ed., Myanmar’s Economy in Transition: Market versus Control, IDE Research Series, Chiba: Institute of Developing Economies, JETRO, 2005 [forthcoming] (in Japanese).
5 Kudo, Toshihiro, “Political Basis of Economic Policies under Burmese Socialism”,
Southeast Asian Studies, Tokyo University of Foreign Studies, No. 4, 1998, pp. 161-169.
6 FY stands for “Fiscal Year” starting in April and ending in March. 7 CSO, Statistical Yearbook, various numbers.
private industries to flourish. It is natural for burgeoning private industries to target mainly domestic markets rather than export markets, and consumer goods rather than capital goods. The private sector did not have the production facilities, technology, or marketing channels for exporting their products and no hope of developing an export trade.8 Heavy industries producing capital goods were entirely beyond their reach.
Of course, Myanmar’s businesses faced competition from imports. Nevertheless, there was room for domestic industries to enter into straightforward assembling, mixing and processing. Thus for example the so-called “3 in 1” Coffee Mix, a packed mixed powder consisting of coffee, cream and sugar, became popular among people after the introduction of the open door policy. First, traders imported already mixed and packed powders, and then they started very simple processes of mixing and packing using imported machines. To begin with, they imported sugar as well, since the quality of domestic sugar is not good enough for consumption. They then gradually began to purchase domestic sugar, which met the quality standards for instant products. The manufacturers also set up printing businesses so that they did not need to import ready-printed plastic packages from abroad. In this way, the local content of “3 in 1” Coffee Mix increased, even though coffee and cream powder were still imported. An example of a similar trend is bottled drinking water. As late as the early 1990s, bottled drinking water was not seen in the streets of Myanmar’s towns and villages at all, except for the few international hotels that imported mineral water for their foreign guests. By the mid-1990s, however, people could drink domestically purified and bottled drinking water anywhere in Myanmar. According to the statistics, in May 2005 there were 142 establishments registered at the Ministry of Industry (1) as engaging in the water bottling business.
These products and industries would have never materialized without the release of people’s pent-up demand and without the possibility of importing raw materials. Although imported goods competed with domestic products, they made the growth of import-substitution industries in the private sector possible and feasible. Thus, private industries exploiting pent-up demand grew quite rapidly in the early 1990s.
Manufacturers of consumer goods accounted for about 70% of the 23,675 private industries registered at the Ministry of Industry (1) in 1992.9 Of these, naturally
enough, the majority were rice mills and edible oil mills, which had long existed but had
8 Except for straightforward processing of pulses and beans, and fish and prawns, which
are agricultural and marine products rather than manufactured ones.
not been registered in the socialist period. However, even among newly established businesses, manufacturers of consumer goods appeared at an earlier stage than other types of industry.10
Trade reforms, like any other reforms, can have adverse distributional consequences. In particular, some sections of the population may be temporarily thrown into unemployment due to imports. Fortunately in Myanmar, there were few private industrialists producing such consumer goods at that time. Some state-owned factories were manufacturing such things but the potential demand was huge and could never be satisfied by production from these factories. Most of the demand for such products was filled by a black market reliant on illegal border trades, which were extremely inefficient. As a result, there were probably only a few people who lost their jobs due to the significant influx of imported goods into Myanmar. On balance, trade liberalization had a favorable impact so far as domestic industrialists were concerned. Liberalization meant that they were not only exposed to imported goods, which are types of product information in themselves, but they were also given access to imported raw materials. For the Myanmar industrialist, imported raw materials had an advantage over materials obtained through the illegal border trade, which were expensive and subject to unreliable delivery.11 All in all, the “open” door policy served as an encouragement for
Myanmar entrepreneurs to enter the manufacturing sector.12
(2) Frustrated Development: the Shortage of Foreign Currency
New restrictions However, the economic boom and the accompanying euphoria turned out to be rather short-lived. In retrospect, the business climate had begun to change even before the Asian Financial Crisis of mid-1997. A trigger for policy changes was an
10 Some supportive evidence will be provided by the survey data in the following section. 11 According to the 2003 survey data, among 149 effective responses, more than 90% of
firms used foreign-made machinery and equipment to various degrees. Among them, about half utilized more than 50% of foreign made machinery and equipment for their production.
12 The government also opened a window to foreign investment by enactment of the FIL
of 1988, which allowed 100% foreign ownership. The manufacturing sector attracted the second largest share of foreign investment (about 20 %), next to the oil and gas sector (more than 30%). Most of the investment in the manufacturing sector is in the form of import substitution industries producing, for example, iron roof sheets, mosquito coils and automobiles, except for garments, which are export-oriented. See Nobuyoshi Nishizawa, “Chapter 4: Evolution of External Relations under Military Rule: Focusing on Foreign Trade and Investment” in Koichi Fujita ed., Myanmar’s Economy in Transition: Market versus Control, IDE Research Series, Chiba: Institute of Developing Economies, JETRO, 2005 [forthcoming] (in Japanese).
apparent expansion in trade deficits. Once the government liberalized trade, the unleashing of pent-up demand meant that imports grew much faster than exports the performance of which had been modest at best.13
Foreign exchange reserves became extremely limited in 1997, when capital flows were slowing down as a result of the Asian Financial Crisis. During 1997, gross reserve coverage had slipped below 1.5 months and coverage of net reserves fell to about one month.14 Foreigners faced difficulties in withdrawing foreign currency even from their
own accounts. When they wished to withdraw US dollars, they had to present seat-booked air tickets to prove their intention to travel to foreign countries, where Foreign Exchange Certificates, so-called Myanmar dollars issued by the Central Bank of Myanmar, are not accepted.
As foreign exchange reserves dwindled, the government imposed a series of restrictions on the exchange and trade system. In retrospect, the establishment of the Trade Policy Council (TPC) seems to have marked a turning point. The TPC, an extra-ministerial committee, was formed in July 1997, with General Maung Aye, Vice-Chairman of the SPDC as Chairman, and with the Minister for National Planning and Economic Development as Secretary. The TPC has laid down important policies not only on external trade but also on other economic matters. These policies include an export-first policy whereby imports are allowed only against export earnings; limits on non-essential imports; a 10% export tax; the advanced purchase of beans and pulses for export; the advanced purchase of cotton; market-price-based taxation on imported vehicles; import restrictions on motor vehicles; a monthly grant for palm oil import; a lowered FEC limit on overseas bank transfers; strengthened revenue collection from MIC-approved projects; and inspection of under-priced import vehicles. A number of these may be aimed at capturing foreign exchange earnings for the government budget.15
The new regulations not only slowed down the pace of liberalization but also actually reversed the trend toward it. At a time when a second generation of economic reforms was needed to address structural rigidities in the macroeconomic framework, in
13 The relatively poor export performance in this period was probably due to delays in
reforms in the agricultural sector, where major export commodities were still under government control with the exception of beans and pulses.
14 IMF, Myanmar: Recent Economic Developments, IMF Staff Country Report
No.99/134, November 1999, p. 26.
15 Kudo, Toshihiro, “Transformation and Structural Changes in the 1990s” in Toshihiro
Kudo ed., Industrial Development in Myanmar: Prospects and Challenges, ASEDP No. 60, Chiba: Institute of Developing Economies, JETRO, 2001, pp. 40-42.
agriculture, in private sector development and in redefining the government’s role, the authorities were instead responding to economic difficulties with ad hoc measures that were further distorting incentives.
Slowdown of Private Industries The imposition of new restrictions on the exchange and trade system deprived private firms of free access to imported goods, causing a slowdown in their economic activity. In this regard, let us consider some government statistics. According to the Private Industrial Enterprise Law enacted in November 1990, any private industrial enterprises using energy of three horsepower and above and/or employing ten or more wage-earning workers are required to register themselves with the Ministry of Industry (1). Procedures relating to the Private Industrial Enterprise Law were prescribed on 1st February 1991. In the Procedures, the relevant authorities requested that existing private industrial enterprises should apply for registration within 120 days, during which they would be allowed to continue their production activities before receiving any directive from the Directorate.
The number of registered private industries is shown in the Table 2-1, covering the period between FY 1990 and May 2005. The number of registrations jumped by 883 times, from 27 in FY 1990 to 23,848 in FY 1991. The growth in the numbers registered stabilized in the following fiscal year, the annual growth being only 5.2%. It can be said that almost all the private enterprises that should be registered under the Law and Procedures and had the intention to do so, had already registered by the end of FY 1991. Thus, increases in the figure of registered industries after FY 1992 can mostly be regarded as new entries.
The first half of the 1990s saw a rapid increase in the number of registered private industries. The average annual growth rate in registrations for the period between FY 1992 and FY 1996 was 8.2%. As previously explained, this growth is the outcome of the private sector’s response to the release of pent-up demand. However, for the following three years of FY 1997, FY 1998 and FY 1999, the number of registrations stagnated, showing an average growth rate of only 0.8%. The figures reflect a slowdown in the economic activities of private industries, caused by the newly imposed restrictions and regulations on the private sector during this period. The growth to some extent picked up in the following years: the annual growth rate for the period between FY 2000 and FY 2004 was 3.8%. Strangely enough, FY 2003 registered a quite high growth rate of 7.1%, an unusually high rate considering that the banking crisis seriously affected the whole economy in that year. This figure may reflect other administrative factors, which pushed private industrialists to register with the authorities. Be that as it may, the
number of registered industrial enterprises declined for the first time in mid- 2005. The decline shows, of course, that there were more exits than entries in the previous year. In spite of an apparently strong trend towards new entries of private firms into new businesses in FY 2003 and FY 2004, some countervailing pressures must have been going on, which eventually forced private firms to withdraw.
Moreover, shortages of electricity and of other infrastructure services became more acute during the mid-1990s. The existing infrastructure with its weak capacity was soon saturated, and the construction of new capacity could not catch up with the generally high growth rate of the economy. Failures in infrastructure development will be discussed in detail in the following section. Here, suffice it to say that by the mid-1990s, further industrial development was being held back by poor infrastructure provision, with private manufacturing being the most badly affected sector.
(3) Shift to a State-owned Factory Strategy
In Myanmar, State Economic Enterprises (SEEs) have a long history of inefficiency, poor management, and vulnerability to all the ills that plague public industry, including rent-seeking and corruption. Far from generating revenue for the government, as had been hoped, SEEs became a net drain on the treasury. This criticism is here applied to the SEEs of the socialist period, not to those of 1990s. Having experienced costly failures among public industries, the Myanmar government must have learnt its lesson. Nevertheless, the same kind of trials appear to have been repeated around 2000 and thereafter. Even though the military government apparently gave up import-substitution state-owned factories when they took power, this was not a deliberate decision to embark on a strategic shift toward an export-oriented strategy led by the private sector, but simply because they could not afford them. When the time came and money was available -probably in the form of export revenues from newly exploited natural gas- they naturally returned to the original policy.
Public industrial enterprises did not decrease throughout the transitional period toward a market economy; their number increased from 597 establishments in FY 1985 to 1132 in FY 2002 (Table 2-2). Moreover, the establishment of new public industrial enterprises is accelerating: the number of such enterprises increased by only 19 for the five years between FY 1985 and FY 1990, by 92 for the next five years between FY 1990 and FY 1995, and by around 20 to 30 per year up to 2000. Thereafter there was further impressive growth, 53 public industrial enterprises being set up in FY 2001 and 231 in FY 2002. The timing of this surge in construction suggests that the government
launched a massive state-owned factories program in 2000 and 2001.
This policy change may accord with the government’s drive toward self-sufficiency, which appears to have become stronger in 2000 and 2001. From September 2001 to January 2002, the New Light of Myanmar, a state-run English newspaper, featured a series entitled “Industrial Development”16 This series of articles seemed to indicate the
government’s way of thinking. Most of the articles described the government’s efforts to rehabilitate old state factories and to establish new state-run ones. Very little reference was made to private industries, and the investment and business climate were not mentioned at all. Moreover, what the authors of the articles appreciated most of all was the quantity produced rather than the value of production. Factories’ performances were assessed by produced volumes that were measured in tonnes, miles and pieces. By contrast, the articles ignored value of production, product quality and consumer satisfaction. For example, an article on the textile and garment industry included the following: “Thus, the requirement for the entire nation is 187,574 million pounds of cotton yarn and 801.6 million yards of cloth. At present, the industries can fulfill 13 percent of the yarn requirement and nine percent of the cloth requirement of the nation. Thus, it is clear that the textile and clothing factories are much needed for the nation.”17 Having made this point, the article then went on to explain the new projects
for constructing state-owned factories.
Several points need to be raised as regards this article. First, in the calculations contained in the article, the production of private industries seems not to be included. The private sector is simply left out of the equation. Second, the article shows no interest in either what kinds of clothes are needed (for example cotton, wool or synthetic materials) or in what preferences consumers might have as regards things like color, design, and fashion. Third, the article does not take international trade into account. The article considers only the self-sufficient production of specified items. This is despite the fact that in the context of a globalized economy, how much a country can produce of a certain item depends on international competitiveness and on comparative advantage. Fourth, export markets are left entirely beyond the scope of the article, even though in most developing economies, textiles and garments manufacturing have developed as export-oriented industries. If this series represents the general sentiment of the government, their way of thinking is very much quantity- or volume-oriented, and
16 The series consisted of 17 articles starting 17 September 2001 and ending 25 January
2002.
targets only domestic markets. Such an outlook may be suitable for a planned economy operating under a closed-door policy, or even for military logistics, but it is not appropriate for a market economy with an open door policy, in which customers’ preferences, willingness to pay and international competitiveness all matter.
Because fiscal data have not been disclosed since FY 1999, we do not know how much capital investment has been used for such public industrial projects, and how much burden they have incurred on government budgets. Nevertheless, it would be safe to say that the government’s push for establishing new public factories reinforced resource misallocations by favoring SEEs, which have access to imports at highly overvalued exchange rates.
Moreover, private industries, and in particular agro-based ones, had to compete with newly established SEEs for domestic raw materials such as cotton (for which they competed with textile mills) and sugarcane (where the competition was with sugar mills).18 SEEs can procure raw agricultural produce from farmers by administrative
orders at prices lower than market prices. They can then sell their final products at cheaper prices. Private industries by contrast face two difficulties, namely the inaccessibility of imported and domestic goods in the raw materials market, and severe and uneven competition with SEEs in products markets.
3. Growth, Stagnation and Features of Private Industries
This section tries to illustrate the industrial history described in the previous section using 2003 survey data. In addition to this, the author provides firm-level observations on the characteristics of private enterprises and the investment and business climate in Myanmar employing the same survey data.
(1) Growth and Stagnation
The survey was conducted between October and December 2003 using designated questionnaires. It covered 167 sample firms, 134 of which were located in Yangon and 33 in Mandalay.19 Among the 167 firms surveyed, 27 already existed in the socialist era,
before 1988; 41 firms were established during the period 1989-1992; 39 firms were set up between 1993 and 1996; 52 firms in 1997-2000 and 8 firms between January 2001
18 For details, see Tin Htut Oo and Toshihiro Kudo eds., Agro-based Industry in
Myanmar: Prospects and Challenges, ASEDP No.67, Chiba: Institute of Developing Economies, JETRO, 2003.
and October 2003 (Table A-1). The apparent slowdown in new entries for the last of these periods reflects overall economic stagnation after 2000. However, the figures are not necessarily consistent with the number of private enterprises registered with the Ministry of Industry (1). The survey data shows relatively active entries for the period between 1997 and 2000, whereas the officially registered number shows an obvious slowdown as has been described earlier. The differences may be attributed to the small sample size of the survey.
Among 27 survivors from the socialist era, 18 were manufacturers of consumer goods such as foods, slippers and traditional medicines. Private firms in this sector constantly established new enterprises during the later periods up to 2000. As was discussed above, they seem to have swiftly responded to the release of pent-up demand for consumer goods.
Manufacturers of agricultural and marine products also registered a relatively large number of entries especially during the first half of the 1990s. Most of them were processors of either beans and pulses or fish and prawns, both of which emerged as new export items after the adoption of the open door policy. As Fujita and Okamoto have pointed out, beans and pulses became major export earners in the 1990s replacing the traditional position of rice in the socialist period, due to export-oriented growthof the vent-for-surplus type.20 Exports of marine products, which were previously untapped,
also led to an increase in the number of processors and cold storage businesses. Firms belonging to this sector naturally tend to export more than other manufacturers. Out of a total 20 cases investigated, some 16 manufacturers of agricultural and marine products exported, while only 14 manufacturers of consumer and industrial goods out of a total 87 exported (Table A-2).
Many private construction firms also came into being immediately after the introduction of the open door policy. Their growth, also, was encouraged by the unleashing of pent-up domestic demand. Potential demand for new (or rehabilitated) houses, hotels and office buildings was long suppressed during the socialist period. In this sense, construction firms enjoyed the same kind of sudden market improvement as did producers of consumer goods, although they were not survivors from the socialist period. However, the so-called construction boom was rather short-lived; it petered out in 1997 when the Asian financial and economic crisis struck the Myanmar economy. In retrospect though, this construction boom was important for the then burgeoning
private industries in that it gave them a chance to accumulate capital to some extent in the early stage of their development. Many of today’s business groups that engage in a variety of business lines originated from the construction industry.
The most recent prominent private industries to emerge were the garment factories. Some 10 out of a total of 13 cases of garment firms were established after 1997, mostly in the period between 1997 and 2000. This sector will be discussed in greater detail in the following section.
Manufacturers of consumer goods were making traditional products meant for the domestic market, whereas producers of agricultural and marine products as well as businesses in the garment industry were new types of enterprise directed towards export markets. While the processors of agricultural and marine products started their businesses in the early 1990s, the garment firms appeared after the mid-1990s. The results of the survey seem to illustrate the typical capital accumulation pattern stylized by Mieno.21 Private entrepreneurs entered into trading businesses first. They exported
mainly beans, pulses, prawns and fish, and imported consumer goods or produced them for the domestic market themselves using imported materials, and thereby making good profits. Many of them entered into construction businesses, too. As native businessmen said, the construction industry’s time had come, following a long-term suppression of demand. The introduction of a policy welcoming foreign tourists also stimulated the demand for better tourist accommodation. Some foreign investors found opportunities to invest in hotels and tourism. All in all, the survey figures were consistent with the description of the entire industrial history outlined in the previous section.
(2) Entrepreneurs, Management and Business Climate
Let us now consider some features of private enterprise in Myanmar, as revealed by the survey data. The investment and business climate will also be examined.
Entrepreneurs What are the characteristics of entrepreneurs in Myanmar? First, so far as ethnic origins are concerned, the Chinese were far and away more important than their minority status in Myanmar might suggest. Among the 167 owners responding to the survey, 56 people or 34% were Chinese, while 88 people or 53% were Bamar, the
21 Fumiharu Mieno, “Chapter 1: Characteristics of Capital Accumulation in Myanmar,
1988-2003” in Koichi Fujita ed., Myanmar’s Economy in Transition: Market versus Control, IDE Research Series, Chiba: Institute of Developing Economies, JETRO, 2005 [forthcoming] (in Japanese).
largest ethnic group in Myanmar (Table A-3).22 The ratio of Chinese owners engaged in
manufacturing was even higher than in construction and services, namely 38% for manufacturing and 21 % for construction and services respectively. The more active participation of the Chinese population in businesses is probably due to better access to resources such as finance, technology, markets and information. In particular, access to financial resources makes things different, since funds for establishing businesses were mainly raised either by self-financing (150 owners out of the 167 firms) or by borrowing from families and relatives (47 owners). By contrast, formal financial channels were open only for a limited number of business persons. Thus only eight owners borrowed from state-owned banks and 22 owners from private banks.23 Chinese owners have a
longer experience of doing business in Myanmar; some are even survivors from the socialist era, having had the opportunity to accumulate enough capital to enable them to enter businesses swiftly once the door was opened. Bamar and other indigenous people, however, have long been deprived of such chances, having been engaged either in agriculture or in the public sector.
The previous occupation of owners also reinforces the above argument. Among the 167 owners, 110 or 66% were from the private sector including family businesses. These were followed by 23 people or 14% from the public sector including government departments and SEEs (Table A-4). Among the 110 owners who came from the private sector, there were 43 Chinese people, accounting for nearly 40% of the total. Among 56 Chinese owners, there were only 4 people who came from the public sector, the share of which (7%) is much lower than that of Bamar owners (21%). Chinese people were, in general, more experienced in business than the Bamars.
By contrast with the ethnic distribution of owners, the distribution of managers is more proportionate to the ethnic structure of the whole population. Among 125 managers, 105 or 84% were Bamars, while 14 people or 11% were Chinese (Table A-5).24
22 According to the Population Census of 1983, the latest census ever conducted in
Myanmar, the Bamar constituted 69% of total population, followed by the Shan (9%) and the Karen (6%). One estimate says that there were about 400,000 Chinese and one million Indians in Myanmar during the early 1990s, and that Chinese and Indians constituted a negligible percentage of total population. However, there are many Chinese-blood mixed people in Myanmar. For example, Ne Win was said to have Chinese-blood. It depends on the personal perception of one’s ethnic identity whether one answers the survey questionnaire as “Chinese”. Here, the term “Chinese” includes Chinese people as well as people mixed with Chinese-blood.
23 Regarding the financial aspect of business establishments and operations, see
Fumiharu Mieno, op.cit., 2005 [forthcoming].
The figures show merely that Bamars can manage day-to-day business operations. However, Bamars are handicapped in establishing their own firms in terms of access to various resources, in particular finance, and, probably to some extent, they show weak entrepreneurial attitudes due to their limited experience and exposure to the business world.
Management and Technology How should we evaluate the management level of private firms in Myanmar? The survey asked whether firms separated business expenditures from household ones. To have a separate accounting system for business can be seen as the first step toward modern management. According to the survey result, 138 firms out of all 167 cases or 83% of the total had an independent accounting system for their businesses (Table A-6). However, smaller firms tend to mix up both types of expenditure. As regards smaller firms with less than 20 regular workers, out of 49 examples, there were 15 firms, or 31%, without a separate accounting system. By contrast, amongst the 45 bigger firms employing 100 or more regular workers, only three, or 7% of the total, were without a separate accounting system.
How about book keeping? Of the 167 enterprises covered by the survey, 138, or 83%, had been keeping books either on a double entry or single entry basis. They also had basic financial statements such as balance sheets (136 firms, or 81%) and profit and loss statements (131 firms, or 78%) (Table A-7). However, only a limited number of firms kept managerial accounting documents such as an annual sales plan (77 firms, or 46%), an annual profit plan (65 firms, or 39%), a financing plan and cash flow (104 firms or 62%). These figures suggest that their managerial standards may not necessarily be sophisticated.
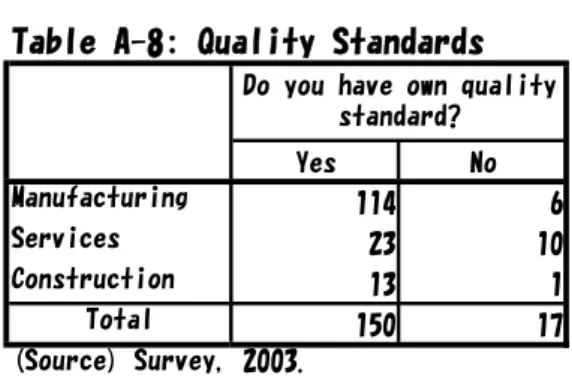
The survey also asked about production-related aspects such as quality standards, cost management and delivery records. Most private firms had such standards and records. Out of the 167 cases, there were 150 firms , or 89%, that had their own quality standards (Table A-8). Amongst manufacturing firms the share was even higher at 95% (114 firms out of 120). Cost management was practiced by 145 firms, or 87% of the total. At the same time, however, cost management seemed to vary according to the size of firms. Among the 88 firms with less than 50 regular workers, 17 firms, or 19%, did not practice cost management(Table A-9). By contrast, among the 79 bigger firms with 50 or more regular workers, only five, or 6% of the total, did not practice cost management. Private firms had poor data as regards delivery records. Out of the 164 respondents, operations, too.
only 53 firms, or 32%, kept records of incorrect deliveries.
What was the situation as regards technology development activities? According to the results of the survey, 37 firms out of 166 or 22%, engaged in production technology development; 8 firms or 5% worked at new product development; 95 firms or 57% did both activities, and 26 firms or 16% did not engage in any technology development activities. It is difficult to evaluate the level of technology development activities using only these figures. However, when we see the data on who was in charge of technology development activities, we can understand the nature of most of such activities conducted by private firms in Myanmar. About half of the technology development activities were done by the founders/owners themselves; about 40% were done by members of the company staff; and only about 10% had teams and/or departments specializing in technology development (Table A-10). The figures seem to show that technology development activities were not systematically organized, and probably were not the subject of much investment, whether financial or human.
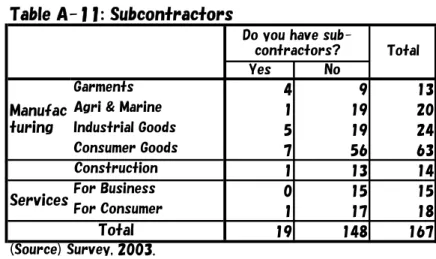
Weak Linkages and Localized Markets So far as manufacturers were concerned, the survey enquired about modes of production. Among 100 effective cases, 79 firms “design their own brand products and make them mostly in-house”, while 17 firms “finish products designed by other companies”. The remaining four firms answered in other ways. There was no single firm that “processed or produced components for products designed by other companies”. Firms produce all their own brands in-house not because they are the only manufacturers in the sector, or because such an approach enables them to maintain the quality of products and their competitiveness, but because their industrial linkages are so weak that they have to produce final products by themselves. Among the 167 firms surveyed, only 19 used subcontractors (Table A-11).25 A relatively
high proportion of the manufacturers producing garments and industrial goods use subcontractors. Garment industries need subcontractors to whom they can put extra orders placed by buyers in order to meet deadlines, whereas manufacturers of industrial goods, and especially makers of machines and processed metal, have more processes that require process- and/or skill-specialized subcontractors.
Another feature of privately-owned industries is that they do not have strong relations with SEEs. Among the 167 firms, 121 did not have any relations with SEEs, whereas 15 were subcontractors of SEEs, 16 supplied raw materials and parts to SEEs and 15 received them from SEEs. Since SEEs have long been dependent on imported
machinery and raw materials, they have failed to produce meaningful industrial linkages with domestic suppliers, whether other SEEs or privately owned industries. 26
On the whole, industrial linkages are weak not only among private industries but also between private industries and SEEs. These figures paint a picture of an undeveloped industrial sector, where stand-alone manufacturing firms make their own products with limited skill and technology inputs and without transactions with suppliers and subcontractors.
The survey also asked all respondents to give details of their sales methods. Among the 167 firms, 69 sold their products directly to consumers, 36 firms sold to wholesalers and brokers, and 19 sold to retailers. A total of 29 firms exported their products directly. Only 10 firms sold their products to other manufacturers. Even though the author does not have data on the sales networks of the firms, it is fairly clear that their products do not sell nationwide. On the contrary, the figures portray a picture of fragmented markets, where localized markets are not effectively integrated into a nationwide market either by physical infrastructure such as roads, railways, telephones, and e-mails, or by institutions such as financial systems and standardization of products. Private firms sell their products directly to consumers in localized markets only.
Under such weak industrial linkages and given the prevalence of localized markets, private manufacturers have very little opportunity to produce more sophisticated, high technology and high quality products, which require a more advanced division of labor and stronger industrial linkages. Selling such products on the nationwide market would require sales networks that are more developed, together with better market information and better infrastructure.
Business Climate and Problems The survey enquired about the present situation as regards the production and sales of private firms. Among the 167 firms, 90 firms said that production and/or sales were “decreasing”, 37 firms reported “increasing” production and/or sales, and 40 answered “no change”. The private firms in the survey
26 Given how the nature of work and sub-sectors differ as between private industries
and SEEs, there should be more transactions to complement each other. According to the author’s interviews with Myanmar Agricultural Machinery Industries (MAMI) and Myanmar Machine Tool and Electronic Industries (MTEI) both of which lie under the jurisdiction of Ministry of Industry (2), several officers-in-charge of production said that they would like to employ private-industry subcontractors. They exhibited the components and parts that they need to procure at exhibitions in Yangon and Mandalay in an attempt to invite potential suppliers. However, they complained of the inferior quality of products made by private industries, which did not meet the standards set by the SEEs.
seem to have suffered from a quite depressed business situation during the period from October to December 2003. In February 2003, Myanmar underwent a banking crisis, which considerably affected the whole economy.27 In July 2003, the United States
imposed a ban on imports of products made entirely in Myanmar. This economic sanction seriously damaged the garment industry in Myanmar, since the country exported nearly half of its production to the United States before sanctions, while garments accounted for about 90% of all American imports from Myanmar. Among the 13 garment firms in the survey, 12 responded that their production/sales were “decreasing” the one exception having stated “no change”.
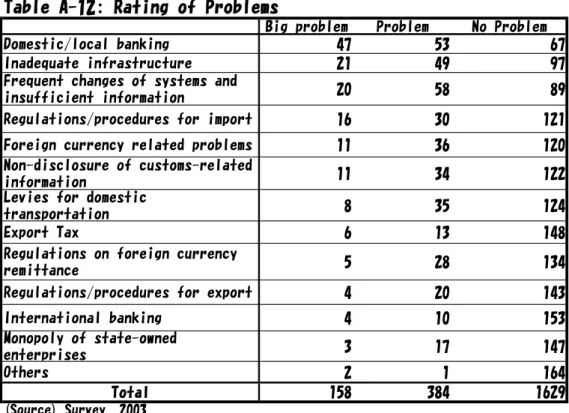
Although this anomalous development should be taken into account, it would nevertheless be safe to say that most of the problems and difficulties that private firms faced at that time had existed long before 2003. Table A-12 shows the difficulties and problems as expressed by the private firms responding to the survey. Any firms encounter problems and difficulties when they run businesses, at any time and in any country. Moreover, the alternatives given in the questionnaire are rather arbitrary and may to some extent overlap with each other. Nevertheless, the ranking shown in the table, the author thinks, reveals a general picture of the investment climate that private firms had to operate in at that time.
“Domestic and local banking” came at the top of the list of problems cited by the firms. The banking crisis seriously affected many private firms and the survey results certainly reflected this. However, the banking crisis was not the only explanation for the placing of this difficulty at the top of the list. As mentioned above, only a few firms had access to bank loans. The underdeveloped financial system undoubtedly hindered private firms from developing their businesses. “Inadequate infrastructure” came second on the list. In Myanmar, private firms and manufacturers in particular often point out that it is impossible to operate their factories without electricity. The poor state of the infrastructure in Myanmar will be discussed in more detail in the following section. “Frequent changes of systems and insufficient information disclosure” comes third on the list. This problem is related to government rules and regulations. It is natural for private firms to complain about rules and regulations: it is understandable for them not to like tedious export and import procedures, government inspections of
27 See Koji Kubo, Ryu Fukui and Fumiharu Mieno, “Chapter 3: The Financial Sector in
the Transition to a Market Economy in Myanmar” in Koichi Fujita ed., Myanmar’s Economy in Transition: Market versus Control, IDE Research Series, Chiba: Institute of Developing Economies, JETRO, 2005 [forthcoming] (in Japanese).
production facilities, and the 10% export tax. However, what they pointed out here is something different. In the survey, private firms complained not about the rules and regulations themselves, but about the way the government manages such rules and regulations and its information disclosure. For example, perhaps unexpectedly, the 10% export tax seems not to be thought a particular problem for the private firms in the survey, with 148 firms regarding it “not a problem”, in spite of the general impression that the tax must represent a serious headache for most businessmen. The figures imply that the important factor is predictability rather than the regulation and taxation themselves. As long as the export tax continues to be levied at the rate of 10% and the enterprise is allowed to use the remaining earnings to purchase imports, private firms can include the export tax in their cost calculations and can make managerial decisions that take the export tax into account. A lack of consistency, accountability and transparency in regulations and in taxation creates an unpredictable investment climate, which is a difficult obstacle that hampers private firms from doing business in Myanmar.
4. Infrastructure Development: Market Failure vs. Government Failure
While many developing countries including those undergoing a transition from a planned to a market-oriented economy have liberalized the manufacturing sector, they often impose greater restrictions on the development of infrastructure. This is because the market power associated with scale economies and demand externalities makes proper market functions difficult. Even though it has recently become fashionable for the private sector to be involved in the provision of infrastructure, public provision remains dominant in many developing economies. However, in reality, publicly provided infrastructure services have often delivered poor quality and inadequate coverage. Myanmar provides a striking example.
In this section, the author examines the infrastructure sector, in which SEEs dominate supplies and markets. SEEs in the infrastructure sector in Myanmar thus far have recorded serious failures in providing much-needed services to customers, in particular to industrialists. Poor delivery at exorbitant prices has seriously hindered the industrial development of the country. The case of Myanmar shows the problematic nature of public ownership in industrial development.
(1) Insufficient Investment
reliable electricity supply, and efficient transport links stand out from firms without them.28 As regards the infrastructure, private firms in Myanmar lack almost everything,
compared even to poor countries such as Cambodia and the Lao PDR (Table 4-1). Private firms in Myanmar themselves recognize the bad influence of poor infrastructure on economic activity within the country. The survey indicated that the need to improve an inadequate infrastructure is one of the most important items on the agendas of Myanmar businessmen.
It is said that for a long period, the socialist regime did not sufficiently invest in infrastructure, leaving a severely handicapped situation for the military government to inherit at the start of their drive toward a market economy. It is also said that the present government, compared to the previous socialist regime, has exerted every effort to build up the infrastructure throughout the 1990s and up to the present. Of course, infrastructure development is a long-term task and people should be patient with the inconveniences of present work if it means that they can be sure of enjoying the fruits of such efforts in the future. Nevertheless, most of the indexes and survey results suggest that little if any progress has been made in improving the infrastructure during the last 15 years. There must be serious faults in either policy or governance for infrastructure development to be so poor in Myanmar.
The allocation of public investment underwent a drastic change in the 1990s, and became more balanced and appropriate for a market economy (Table 4-2).29 An
increased share of public investment was devoted to infrastructure development including public works (construction) and transport and communications. Meanwhile a lower share of expenditure was allocated for the productive and services sectors such as industry and trade. The share of the industrial sector (manufacturing) fell considerably, from 36% in FY1980 to 18% in FY 1985 and 6% in FY 1999. So far as the production sector was concerned, spending on agricultural development was given priority. Agriculture absorbed 14 % of total public investment in FY 1999. Although the author does not know the detailed budget allocation within the agricultural sector, the emphasis seems to have been on infrastructure development, including the construction of dams, reservoirs and new irrigation systems. This is a significant departure from the
28 World Bank, World Development Report 2005: A Better Investment Climate for
Everyone, 2005, p.124.
29 The fiscal data of the Myanmar government, including SEEs, is available only up to
past public policy of investing heavily in publicly owned industry.30
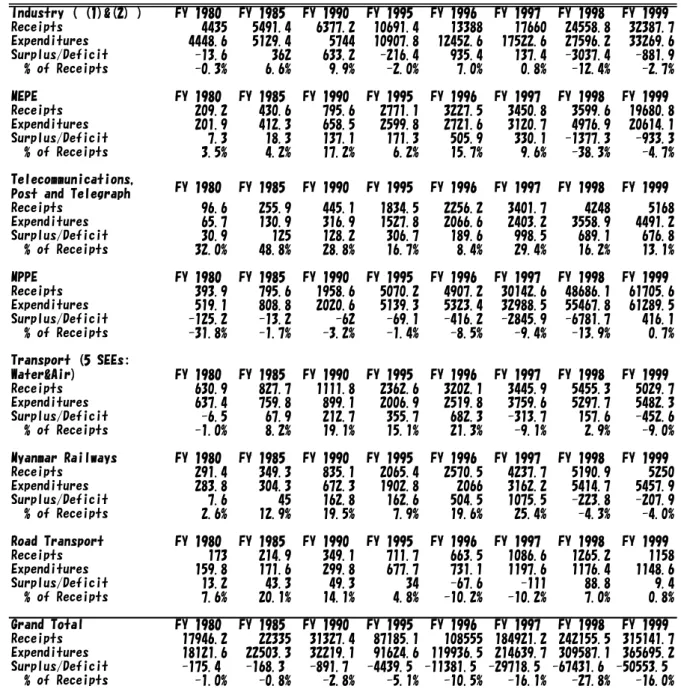
Nevertheless, the figures of this table do not reveal the real significance of capital investment in the infrastructure sector. Here, the author calculated per thousand (‰) of capital investment of SEEs as of nominal GDP, a method that can capture the real economic value of investment.
It is rather surprising to see that the figures given in Table 4-3 declined in the 1990s. Although the government proudly claimed it had spent heavily on infrastructure development since their seizure of power, in actual terms spending declined. The government invested far less in infrastructure development in the 1990s than in FY 1985. No single infrastructure sector received more capital investment in the 1990s than in FY 1985 or in FY 1990. The figures contrast with the generally held impression that the SLORC/SPDC government emphasized infrastructure development much more than the previous socialist regime. The government has constructed many roads, bridges, dams, power plants, new airports and so forth.31 However, in reality, they have
failed to mobilize sufficient resources for constructing infrastructures in line with overall economic growth (GDP).32
Due to poor investment in the 1990s, infrastructure facilities and services have not shown any improvement. Table 4-4 shows that infrastructure capacity and/or services have even declined in some sectors during the 1990s. For example, the air freight total for FY 2002 was only 60% of that of FY 1990, while passengers by road in FY 2002 were only 40% of those in FY 1990.33 In most respects, the provision of infrastructure failed
to grow in proportion to GDP growth. The figures indicate the worsening, or at best stagnation, of infrastructure supply capacity. Were the government to have invited
30 Prof. Myat Thein also appraised a more-balanced public allocation by SLORC/SPDC
government, stating “The new emphasis given to infrastructure development, and especially transport, also seems to be in accord with the market-oriented policy. The large proportion of public investment in the social sector, however, was taken up largely by defence.” (Myat Thein, Economic Development in Myanmar, 2004, p.133) As Prof. Myat Thein pointed out, “defence” increased its share from 6% in FY 1985 to 32% in FY 1995. Such an allocation shall not be regarded as balanced. Here, the author confines his argument into productive sectors and infrastructure sectors only.
31 See Magnificent Myanmar (1988–2003), Yangon: Ministry of Information, 2003. 32 In retrospect, the author doubts whether the more balanced allocation of public
investment in the 1990s happened to result solely from the sudden suspension of ODA, which had previously been poured into state-owned economic enterprises in the industrial sector. He believes that the apparently renewed allocation policy was not created by a firmly resolute change of public investment policy in accord with a drive toward a market economy.
33 Note that the figures may not include private services. For example, some private
private sector participation, the infrastructure situation in Myanmar would have been quite different.
(2) Inefficient Management
Shortage of public investment capital was not the only reason for lackluster infrastructure development in the 1990s. The inefficient management of SEEs in the infrastructure sector also hampered growth. Most SEEs simply failed to run their daily businesses in a proper manner.
Apart from capital investment, SEEs in the infrastructure sectors lost money in their day-to-day operations. As shown in Table 4-5, most of them could not even cover their operational costs using their own revenues. Moreover, the deficits increased considerably in FY 1997 and FY 1998. For example, MEPE, which had recorded a surplus ever since FY 1980, suddenly plunged into the red in FY 1998 and FY 1999. Enterprises running various modes of transport followed the same pattern. The five SEEs engaged in waterways and airways went into the red in FY 1997 and FY 1999; Myanmar Railways was in deficit in FY 1998 and FY 1999 after having made a comfortable surplus for many years; and Road Transport suffered losses in FY 1996 and FY 1997. The telecommunications, posts and telegraph sector was an exception and enjoyed a relatively substantial surplus up to FY 1999.
What are the factors contributing to the deterioration of the SEEs’ operations? Two issues need to be discussed: one is inefficient management of the SEEs and the other is rent-seeking activities, both of which are presumably caused by lack of competition and abuses of monopolistic market power.
SEEs are strictly controlled by the respective ministries, or in other words by the government. Since 1989, the budget of all SEEs has been consolidated into the State Fund Account (SFA), a practice that has deprived SEEs of financial independence. When SEEs lose money, they receive subsidies by way of compensation. When they make profits, they hand them over to the SFA. They have no financial incentive to increase revenue and reduce costs. The management of SEEs is also highly centralized and moreover they lack managerial independence. The government instructs how much SEEs should invest in which year, how much they produce in terms of products and services, at what prices they sell their products and services, and so forth. In other words, SEEs are merely part of the government.
Most tariff rates charged by the public utilities owned by SEEs tend to be suppressed below market prices leaving a surplus demand that is prey to rent-seeking
activities. In addition to imposing lower price settings, the SEEs often favor particular groups such as other SEEs, military units and related enterprises, and governmental officials, and these clients tend to be charged cheaper tariff rates. Revisions of tariff rates have often lagged behind the rapid devaluation of the Kyat, whereas most inputs for producing such services have been dependent on imports, including foreign exchange costs such as fuel and imported spare parts. This seems to have contributed towards the serious deterioration of the SEEs’ financial situation.
(3) SEEs in Electricity, Communications and Petroleum
This section examines three key SEEs in electricity, communications and petroleum distribution respectively. These cases highlight the difficulties surrounding the public provision of infrastructure services.
MEPE Electric power supply in Myanmar is monopolized by Myanmar Electric Power Enterprise (MEPE), a SEE that comes under the jurisdiction of the Ministry of Electric Power. The State-owned Economic Enterprises Law of 1989 stipulated that electric power generation shall be exclusively done by public enterprises. MEPE is the sole provider of electricity generation and transmission nationwide.
The total installed capacity of electric power was 1335 MW as of September, 2004,34
increases in capacity having lagged behind overall GDP growth, as was mentioned earlier. The per capita consumption of electric power is 108 kw, which is one of the lowest in the world. Only 5% of the people of Myanmar have access to electricity, a much lower percentage than in Cambodia (17%) and the Lao PDR (41%). Demand for electric power tends to increase more rapidly than GDP in any economy during the early stages of economic development and this is true also of Myanmar. To make matters worse, it is said that in FY 2001, around 15% of electricity was lost during generation, transmission and distribution, making the demand-supply gap even wider. The EIU has estimated a 220 MW shortfall in electricity supply in Myanmar in recent years.35
Because the supply of electricity is unreliable and insufficient, industrial firms depend on their own or shared generators, which are run on diesel. The market price of diesel is expensive and the technical efficiency of electricity generation by small-scale generators is low. As a result, independently generated electricity is costly compared to power supplied through the grid. Moreover, the tariff rates are multi-tiered and
34Selected Monthly Economic Indicators, CSO, September 2004. 35 EIU, Country Profile 2004 Myanmar (Burma), 2004, p. 20.
foreigners, whether residents or organizations, must pay in US dollars or FEC, which makes real charges for electricity much more expensive than local ones. A foreign garment factory located in Mingalardone Industrial Estate, one of the best industrial parks in Myanmar, experienced frequent and lengthy electricity outages and had no alternative but to use its own generator. In 2004, the firm’s energy costs, including electricity from the grid and diesel oil, was 1.4 times more than its labor costs.36 Even in
the highly labor-intensive garment industry, energy costs more than labor. Thus it is that cheap labor costs have been offset by expensive infrastructure services.
MPTE Myanmar Post and Telecommunication Enterprise (MPTE), a corporation that comes under the jurisdiction of Ministry of Communications, Posts and Telegraphs, has long enjoyed a monopoly in the provision of telephone services. Their services are notorious for frequent disconnections, lengthy waiting times for connections, and costliness. Customers have to wait for a long time until they get connected to lines and they are often asked for “tea money” in return for making connections. As a result of inadequate coverage and unreliable services, the market rates for telephone lines vary considerably from telephone number to telephone number. Customers try to get better lines by offering, again, “tea money” to MPTE officials. International phone calls are grossly expensive; for example it costs 4.5 US dollars per minute for a telephone call from Myanmar to Japan.
Mobile phones are few and far between and are for privileged customers only. Mobile phones are sometimes sold to specially designated groups such as military cadres, high ranking government officials and so-called crony businessmen. Some mobile phones are resold to real customers who have a pressing need for telephone services and can afford extravagant market prices.
As regards Internet provider services, the government allowed one private company to enter the market. This company, however, was run by a son of then Prime Minister General Khin Nyunt. This move seems to have improved the Internet environment in Myanmar. Nonetheless, Internet accessibility lags far behind access in neighboring countries, where liberalization has gone much farther. The Internet café is a recent phenomenon found only in Yangon and Internet access through personal computers at home is something far beyond the wildest dreams of the majority of the population. Even the issuance of e-mail accounts is quite limited.
MPPE The Myanmar Petroleum Products Enterprise (MPPE) is the sole enterprise
responsible for the distribution and sale of petroleum products in Myanmar. MPPE has four main fuel terminals, 26 sub-fuel terminals, 11 aviation depots and 256 filling stations nationwide.37 MPPE presents a typical case of an enterprise falling prey to
rent-seeking activities. In June 2005, their petrol stations were selling gasoline and diesel at the official rates of 180 kyats/gallon and 160 kyats/gallon respectively, whereas the free market rates of these two fuels were approximately 2000 kyats/gallon and 2300 kyats/gallon respectively.38 Such pricing naturally creates gross shortages at official
prices, giving MPPE arbitrary power of allocation. In principle, car owners in Yangon are entitled to two gallons per car per day. However, some privileged groups such as government officials, other SEEs, and military units are allowed extra allocations. All these surplus allocations are resold on the parallel market, providing windfall money to the sellers. The fuel is then distributed to actual consumers by “black” merchants, who although operating beyond the law, are openly present, buying and selling fuel just next to the filling stations that have supplied them.
Such pricing policies have made MPPE one of the biggest loss making SEEs in Myanmar. MPPE’s losses in current cash budget terms accounted for about 10% of the total losses of SEEs in FY 1997 and FY 1998. Imports of refined mineral oil have been increasing as demand has expanded, and grew by about nine times between FY 1990 and FY 2003. The share of refined mineral oil in total imports also increased, from less than 5% in the mid-1990s to 13% in FY 2003. This import trend suggests that MPPE’s present deficit is growing, and is likely to continue to increase in the future unless price liberalization occurs. Moreover, MPPE’s supply of subsidized fuel deters other SEEs and privileged groups from introducing managerial and structural reforms, resulting in more distorted resource allocations.
Conclusion The author does not know whether or not the trends described above have continued since FY 1999. However, so far there has been no indication of substantial SEE reforms of an institutional, organizational or managerial nature. Poor management and rent-seeking activities seem to be continuing at the present time.
Budgetary difficulties have constrained capital investment in the infrastructure, with the result that the provision of infrastructure services has lagged far behind the expansion of the economy as a whole. Inefficient management has also contributed to the failure of the infrastructure SEEs to deliver good services to customers. Public
37 The energy sector of Myanmar government homepage is available at
http://www.energy.gov.mm/.