Delegation to workers across countries and
industries : social capital and coordination
needs matter
著者
Asuyama Yoko
権利
Copyrights 日本貿易振興機構(ジェトロ)アジア
経済研究所 / Institute of Developing
Economies, Japan External Trade Organization
(IDE-JETRO) http://www.ide.go.jp
journal or
publication title
IDE Discussion Paper
volume
620
year
2016-10
INSTITUTE OF DEVELOPING ECONOMIES
IDE Discussion Papers are preliminary materials circulated to stimulate discussions and critical comments
Keywords: Coordination, Decentralization, Delegation, PIAAC, Social Capital, Trust JEL classification: L22, L23, Z13
* Poverty Alleviation and Social Development Studies Group, Development Studies Center, IDE ([email protected])
IDE DISCUSSION PAPER No. 620
Delegation to Workers across Countries and
Industries: Social Capital and Coordination
Needs Matter
Yoko Asuyama*
October 2016
Abstract
The degree of delegating authority to non-managerial and non-supervisory workers substantially varies across countries and industries. By examining worker-level data from 14 countries, I empirically explain this variation by region-specific social capital that proxies workers’ degree of self-centeredness and the industry-specific need for coordination. The empirical results of this study confirm the theoretical predictions by Alonso et al. (2008) for the first time: the negative association between coordination needs and decentralization is mitigated in regions with lower self-centeredness of workers. In particular, when self-centeredness of workers (respectively, need for coordination) is very low, the degree of delegation is always high regardless of the level of the need for coordination (self-centeredness of workers). Positive associations between delegation and its benefits, including job satisfaction, wages (proxy for higher productivity), and skill upgrading of workers, are also found. These results imply that people’s degree of self-centeredness affects a country’s economic development patterns by changing the degree of decentralization and its benefits.
The Institute of Developing Economies (IDE) is a semigovernmental, nonpartisan, nonprofit research institute, founded in 1958. The Institute merged with the Japan External Trade Organization (JETRO) on July 1, 1998.
The Institute conducts basic and comprehensive studies on economic and related affairs in all developing countries and regions, including Asia, the Middle East, Africa, Latin America, Oceania, and Eastern Europe.
The views expressed in this publication are those of the author(s). Publication does not imply endorsement by the Institute of Developing Economies of any of the views expressed within.
INSTITUTE OF DEVELOPING ECONOMIES (IDE), JETRO 3-2-2, WAKABA,MIHAMA-KU,CHIBA-SHI
CHIBA 261-8545, JAPAN
©2016 by Institute of Developing Economies, JETRO
Delegation to Workers across Countries and Industries:
Social Capital and Coordination Needs Matter
*Yoko Asuyama
Abstract
The degree of delegating authority to non-managerial and non-supervisory workers substantially varies across countries and industries. By examining worker-level data from 14 countries, I empirically explain this variation by region-specific social capital that proxies workers’ degree of self-centeredness and the industry-specific need for coordination. The empirical results of this study confirm the theoretical predictions by Alonso et al. (2008) for the first time: the negative association between coordination needs and decentralization is mitigated in regions with lower self-centeredness of workers. In particular, when self-centeredness of workers (respectively, need for coordination) is very low, the degree of delegation is always high regardless of the level of the need for coordination (self-centeredness of workers). Positive associations between delegation and its benefits, including job satisfaction, wages (proxy for higher productivity), and skill upgrading of workers, are also found. These results imply that people’s degree of self-centeredness affects a country’s economic development patterns by changing the degree of decentralization and its benefits.
JEL Classification: L22, L23, Z13
Keywords: Coordination, Decentralization, Delegation, PIAAC, Social Capital, Trust
*
I thank Yuji Genda, Hideaki Goto, Daiji Kawaguchi, Ayako Kondo, Tomohiro Machikita, Hideo Owan, and all the internal seminar participants at the Institute of Developing Economies, Japan External Trade Organization (IDE-JETRO) and the University of Tokyo. I am grateful for the funding support from the IDE-JETRO.
1. Introduction
Decentralization, that is, delegation of decision-making from higher to lower
organizational levels, is beneficial for firms in many ways.1 Theoretically, these benefits
include better adaptation to the business environment owing to more efficient use of
local knowledge (Holmström 1984; Dessein 2002; Hart and Moore 2005; Dessin and
Santos 2006; Alonso et al. 2008), speedier decision-making because of more efficient
information processing (Radner 1993; Bolton and Dewatripont 1994), and an increase
in job satisfaction/motivation and effort of workers to whom authority is delegated
(Aghion and Tirole 1997; Zábojník 2002). Empirically, Fehr et al. (2013) have
confirmed the last motivation-enhancing effect of delegation in a laboratory experiment.
Appelbaum et al. (2000, Chapter 9) also find a positive association between delegation
to non-managerial employees and employee job satisfaction.
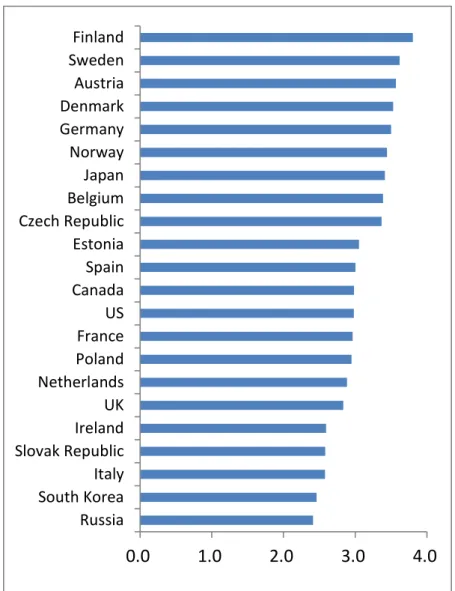
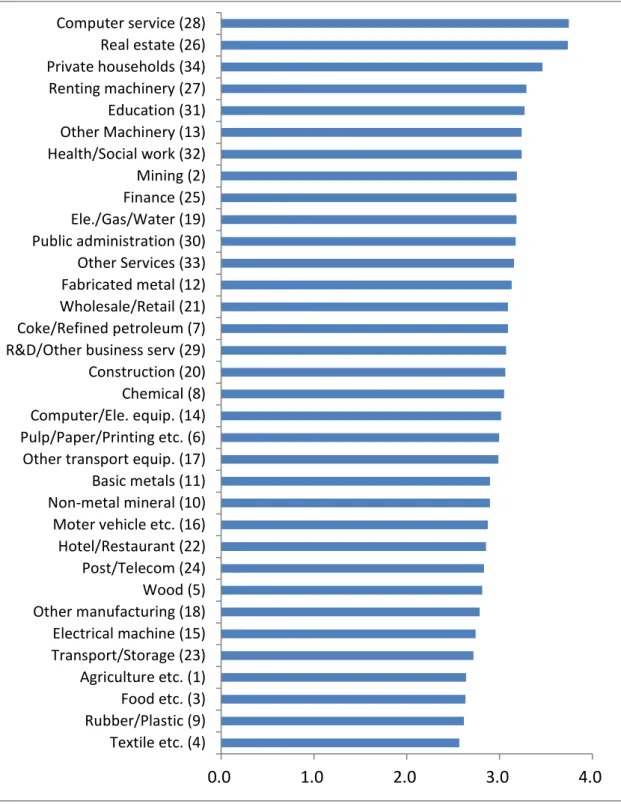
Despite these benefits, firms do not always pursue decentralization, and the
degree of delegation varies substantially across locations and industries. For example,
Figures 1.1 and 1.2 display the variation across countries and industries, respectively, in
the degree of discretion that the average non-managerial and non-supervisory worker
can choose or change their way of work.2 The degree of decentralization in this aspect
ranges from Russia’s 2.41 to Finland’s 3.80, where the degree is measured on a 5-point
scale: 1 = not at all (choose/change the way of own work); 2 = very little; 3 = to some
extent; 4 = to a high extent; 5 = to a very high extent (Figure 1.1). Regional variations
are much greater: the corresponding average scores range from 1.72 in Altai Krai,
Russia, to 4.05 in Bremen, Germany. As Figure 1.2 shows, the corresponding scores
also vary across industries, ranging from 2.57 in textile-related manufacturing to 3.75 in
computer-related services.
1
For the summary on the benefits and costs of delegation, see Colombo and Delmastro (2008, Chapter 2), Bloom and Van Reenen (2011, section 5.4.2), and Gibbons et al. (2012).
2
This aspect is one of the seven elements of delegation examined in this paper’s empirical analysis. Similar variations are observed when examining other elements.
What explains these variations in the actual degree of decentralization? One
important reason is that decentralization is not pursued in countries/regions or industries
in which the expected costs of delegation are relatively large. Theoretically, such costs
mainly include (i) loss of control (Holmström 1984; Aghion and Tirole 1997; Dessein
2002; Alonso et al. 2008) and (ii) difficulty in coordination (Bolton and Dewatripont
1994; Hart and More 2005; Dessin and Santos 2006; Alonso et al. 2008). First,
delegation generally results in difficulty in monitoring agents’ behaviors. As the
interests of the principal (firm) and the agent (worker) increasingly misalign, the
possibility of workers’ rent-seeking behaviors, which are harmful for firm profit,
increases. Second, when coordinating worker behaviors is important for firm profit,
decentralization is costly because adaptation to local conditions is prioritized over
coordination under decentralization.
This paper focuses mainly on these two costs of decentralization as
determinants of its implementation.3 First, the size of expected cost owing to
rent-seeking behaviors is measured by region-specific social capital that proxies
self-centeredness of workers. Second, the magnitude of cost owing to difficulty in
coordination is measured by industry-specific coordination needs. Based on the
theoretical framework by Alonso et al. (2008), I empirically examine the effect of these
two cost measures on the degree of delegation to non-managerial and non-supervisory
workers utilizing worker-level data from 14 countries. The following theory-consistent
results are obtained: First, the degree of decentralization is lower when its costs are
higher (i.e., when industry’s need for coordination is higher or when region’s average
self-centeredness of workers is higher). Second, the negative association between
coordination needs and decentralization is mitigated in regions with lower
3
Other factors that affect the degree of decentralization by changing the benefits and costs of delegation, such as worker skill, use of information and communication technology (ICT), firm size, and the competitiveness of product market, are controlled for in the empirical analysis.
self-centeredness of workers. Third, in industries with very low coordination needs, the
degree of decentralization is high and does not depend on the level of self-centeredness
of workers. Similarly, in regions where self-centeredness of workers is very low, the
degree of delegation is always high, regardless of the industry’s coordination needs. As
mentioned below, the second and third findings are empirically new. These results are
robust to alternative indices of decentralization, an industry’s coordination needs, and
self-centeredness of workers. The possibility of endogeneity bias is minimized because
the region-specific and industry-specific cost measures used in this paper are likely to
be exogenous to individual firms. In addition, the endogeneity test results indicate that
the social capital variable (proxy for worker self-centeredness) can be treated as
exogenous.
The lower-level self-centeredness of workers is considered to raise firm profit
through more information sharing (i.e., less inefficiencies caused by imperfect
information) and better coordination among workers, and less biased decision making
of each worker from the firm’s perspective. These are exactly the main channels through
which social capital improves efficiency of the group (Durlauf and Fafchamps 2005:
1652–1658).4 When self-centeredness of workers is very low, decentralization is chosen because it yields higher profit than centralization even when coordination is extremely
important. When coordination is important, each worker recognizes it and thus
coordinates well by exchanging better-quality information, which raises firm profit
under decentralization. By contrast, the quality of communication becomes worse under
centralization with an increase in coordination needs (see Section 2 for more detail).
This study contributes to the literature in three main ways. First, to the author’s
knowledge, this study is the first to test the theoretical predictions of Alonso et al.
4
As Durlauf and Fafchamps (2005: 1644) summarize, previous studies generally regard social capital as something that “generates positive externalities for members of a group” through “shared trust, norms, and values” that “arise from informal forms of organizations based on social networks and associations.”
(2008) empirically. Past empirical studies find a negative association between
coordination needs and the degree of decentralization (Colombo and Delmastro 2004;
McElheran 2014; Meagher and Wait 2014). However, Alonso et al. (2008) theoretically
shows that even when coordination is extremely important, decentralization is optimal if
the degree of misalignment of interests between principal and agent are sufficiently
small. Such interaction effects of coordination needs and the misalignment of interests
are empirically examined in this paper for the first time.
Second, this study also contributes to the growing literature on the effect of
culture (or social capital) on economic activities (Guiso et al. 2006, 2011; Durlauf and
Fafchamps 2005; Fernández 2011; Alesina and Giuliano 2015). In particular, this paper
is closely related to Bloom et al. (2012), Appelbaum et al. (2000, Chapter 9), and
Cingano and Pinnotti (2016). By examining firm data in the United States (US), Europe,
and Asia, Bloom et al. (2012) empirically show that firms headquartered in high-trust
regions delegate more authorities to plant managers and that higher levels of bilateral
trust between the country of headquarter and that of subsidiary increases
decentralization. Appelbaum et al. (2000, Chapter 9) also find a positive association
between delegation to non-managerial employees (“greater opportunity to participate”)
and their trust to managers in three manufacturing industries in the US. However, both
papers do not examine the effect of coordination needs nor social capital measures other
than trust. By contrast, the current paper shows that the effect of trust on
decentralization depends on the importance of coordination. In fact, trust does not
matter for decentralization when coordination needs are very low. The results in this
paper also indicate that “trust” may be interpreted as the degree of self-centeredness of
workers because alternative social capital variables (participation in volunteer activities
and attitude on wealth accumulation) are also found to be significant determinants of
decentralization. These remarks also apply to Cingano and Pinnotti (2016) who examine
regional- (or country-) level trust is associated with a larger share of value-added and
export in delegation-intensive industries. They treat the industry’s degree of
decentralization as exogenous, while I assume and empirically show that the degree of
decentralization is determined by social capital (e.g., trust) and coordination needs.
The third contribution of this study is its data characteristics. The data in the
current paper cover both manufacturing and service industries across 14 countries in
Europe (including Russia and Eastern Europe) and Asia. By contrast, the coverage of
most studies that examine the determinants of decentralization are limited, especially in
terms of the country coverage, although a few exceptions exist; for example, Bloom et
al. (2012) cover manufacturing firms in 12 countries in US, Europe, and Asia.5 Another
uniqueness of the current study is the use of worker-level data. Previous studies on the
determinants of decentralization generally use firm or establishment level dataset
(Colombo and Delmastro 2004; Bloom et al. 2012; McElheran 2014; Meagher and Wait
2014; studies cited in the Tables 2.2a in Colombo and Delmastro 2008). By examining
worker-level data, this paper is able to examine the effects of individual characteristics
on the degree of decentralization.6
The rest of this paper is organized as follows: Section 2 briefly explains the
model by Alonso et al. (2008) regarding firm decentralization/centralization choice.
Section 3 presents the empirical strategy. Section 4 describes the data. The estimation
results on the benefits and determinants of decentralization are reported, respectively, in
Sections 5 and 6 and Section 7 concludes.
5
Graham et al. (2015) also cover European and Asian CFOs, although their main empirical analysis is based on US CEOs.
6
Graham et al. (2015) examine the effect of CEO’s characteristics (and a few characteristics of managers) on the degree of decentralization. However, the examined characteristics are limited. In addition, they do not examine delegation to lower-level workers.
2. A Model Explaining the Decentralization/Centralization Choice
Alonso et al. (2008) build a model that explains how the two major costs ofdecentralization (loss of control and coordination failure) influence the firm’s
decision-making patterns, that is, decentralized or centralized decision making. Their
model considers an organization with two divisions and one headquarter, and examines
how the decision rights are allocated between a headquarter manager and two division
managers. I directly apply their model to my empirical setting simply by changing the
“two division managers” in their model to “two non-managerial and non-supervisory
workers.” Delegation to the lowest-rank workers in the organization is examined,
primarily because my data on decentralization are mainly concerned with narrow-scope
decisions related to the person’s daily business operations (see Section 4.2.1). By
contrast, empirical studies that examine the degree of delegation to managers usually
analyze more wide-scope strategic decisions, such as those on mergers and acquisition,
capital investment, hiring and dismissal of employees, introduction of new product,
technology, and work organization (Colombo and Delmastro 2004; Bloom et al. 2012;
Meagher and Wait 2014; Graham et al. 2015).
I briefly explain the model of Alonso et al. (2008) with slight notational
changes. Consider a hypothetical firm consisting of a headquarter (HQ) manager and
two workers i∈{1,2}. There are two decisions, d1 and d2, which are related to the tasks of workers 1 and 2, respectively. These decisions are made by either the HQ
manager in the case of centralization or by each worker in the case of decentralization.
Decision rights are allocated to maximize the sum of expected profits generated by
workers 1 and 2, E[π +1 π2]. Profits of worker i (πi) are defined as follows: } 2 , 1 { ) ( ) ( − 2 − − 2 ∀ ∈ − =K d θ δ d d i πi i i i i j ,
where Ki is the maximum profits realizable, θi is the local conditions each worker faces, d is the decision on other task (if i = 1, then j = 2, or vice versa). j θi is privately observed by worker i, but its distribution is common knowledge. di = θi
means perfect adaptation to the local condition and di =dj means perfect coordination between decisions 1 and 2. Each worker’s profits are increasing in both
adaptation and coordination, but there is a trade-off between them. The parameter
) , 0
[ ∞
∈
δ captures the relative importance of coordination for the profits.
Each worker strategically sends messages m to the HQ manager under i
centralization (vertical communication), or to the other worker under decentralization
(horizontal communication), to influence decision making in her favor. These
communications take the form of “cheap-talk.” Under centralization, the HQ manager
chooses the optimal decisions d1 and d2 to maximize the expected overall profits
given the messages received E[
π
1+π
2 |m] , where m≡(m1,m2) . Under decentralization, each worker chooses the optimal decision d that maximizes i] | ) 1 ( [
E λπi + −λ πj θi,m . The key here is the presence ofλ∈[1/2,1], which is the weight each worker gives to her own profits. This parameter
λ
(called “own-division bias” in Alonso et al. [2008]) captures the degree of misaligned interests between theHQ and each worker. In the current paper, I call this
λ
the degree of workers’ self-centeredness.Under the above setting, Alonso et al. (2008) show the following: (i) when
coordination need δ and self-centeredness of workers
λ
are both sufficiently large, both δ andλ
are negatively correlated with decentralization; (ii) when δ is sufficiently small, decentralization is optimal regardless ofλ
; and (iii) whenλ
is sufficiently small, decentralization is optimal, regardless of δ (see Proposition 5, Figure 6, and Section VI of Alonso et al. [2008]). As mentioned in the Introduction,previous literature predicts the negative associations of both δ and
λ
with the degree of decentralization. A particularly novel finding of their model is (iii), whichshows that even when the need for coordination is extremely high, decentralization
outperforms centralization when the self-centeredness of workers is sufficiently low.
quality of communication under decentralization, but worsens that under centralization.
Under decentralization, each worker recognizes the importance of coordination for her
own profit and thus, exchanges more precise information with each other, which results
in better coordination and greater firm profit. By contrast, under centralization, each
worker anticipates that the HQ manager would give too much weight to coordination
and thus, over-reports her state to induce a decision better adapted to her local
conditions. Less precise information on local conditions results in poor adaptation and a
reduction in firm profit. Through this mechanism, the expected profit under
decentralization becomes larger than that under centralization, when the degree of
self-centeredness of workers (
λ
) is sufficiently small. Whenλ
is large (and δ is also sufficiently large), centralization outperforms decentralization. This is becauselarger
λ
leads to less precise communication and more biased decision making under decentralization.7 Put differently, lower self-centeredness of workers (smallλ
) increases efficiency through better coordination by improving the quality of informationand through decisions more closely aligned with the firm’s interests.
3. Empirical Strategy
Based on the model in the previous section, I empirically examine whether
workers’ self-centeredness and need for coordination actually influence the degree of
decentralization. In particular, I primarily estimate the following equation:
r jc
r jc
ijr IndCoord SocK IndCoord SocK
Decent =α +β1 +β2 +β3 * , 2 1Xijr γ Zjc Fj Fc εijr γ + + + + + (3.1) 7
An increase in
λ
leads to lower qualities of both vertical and horizontal communication. However, since each worker’s interest is more closely aligned with the HQ manager than the other worker who is biased toward own profit, the negative effect ofλ
on the communication quality is smaller under centralization.where subscripts i, j, r, and c denote worker (non-managerial and non-supervisory
worker), industry, region, and country, respectively. Decent stands for the degree of ijr delegation to the worker. IndCoord represents the degree of coordination needs of jc industry j in country c. SocKr is the region-specific social capital that proxies the
degree of self-centeredness of the average worker in the region. A higher value of
r
SocK means lower self-centeredness of workers. Xijr is a vector of worker (and workplace) characteristics that may influence the degree of delegation, including gender,
age and its square (or years of work experience and its square, and years of tenure at the
current employer and its square), years of education, literacy and numeracy skills
(proficiency scores), health status, immigrant-related dummies (whether born abroad
and the native language is foreign), occupation dummies, skills used at work (reading,
writing, numeracy, and information and communication technology [ICT]), dummies
for fulltime work and indefinite employment contract, size of the workplace, and public
and non-profit organization sector dummies. Zjc denotes a vector of industry characteristics such as export and import ratios that represent the degree of market
competition of the industry. F and j F denote industry and country dummies. c εijr
is the error term. In some specifications, region dummies (Fr) are controlled for instead
of F and, in that case, c β2 is not identified. I also experiment with IndCoord j (instead of IndCoord ), which does not vary across countries, resulting in an inability jc to identify
β
1. A more detailed description of variables appears in the next section and in Appendix Table A1.All the estimations in this paper use the “repest” command in Stata (Avvisati
and Keslair 2016), which is specially designed for the PIAAC and other datasets with
complex survey designs. The repest command uses sampling weight to obtain a point
estimate that represents the population, and standard errors are estimated using
literacy and numeracy proficiency scores.8 I modify the original sampling weight that
weighs countries according to their population size to the one that gives equal weight to
(all survey participants in) each country.9
The model in the previous section leads to the following four predictions:
(i)
β
1 <0, that is, a higher need for coordination (IndCoord) is associated with a lower degree of decentralization (delegation to workers) in general.(ii) β2 >0, that is, lower self-centeredness (i.e., higher SocK) is associated with a higher degree of decentralization in general.
(iii) β3 >0, that is, as the degree of self-centeredness decreases (i.e., as the SocK increases), the negative association between IndCoord and decentralization
weakens.
(iv) In particular, when IndCoord is very low, the degree of decentralization is always high, regardless of SocK. Similarly, when SocK is very high (i.e., the degree of
self-centeredness is very low), the degree of decentralization is always high,
regardless of IndCoord.
4. Data
4.1 Main Data Sources and Sample Used
Individual-level data on the degree of decentralization and worker
characteristics are taken from the Public Use Files (PUF) of the Programme for the
International Assessment of Adult Competencies (PIAAC), conducted by the
8
The number of replications is 80 without plausible values. When plausible values are used, the average estimator across 10 plausible values is reported and the imputation error is additionally added when estimating standard errors. For more details, see Avvisati and Keslair (2016) and Mohadjer et al. (2013).
9
This treatment is appropriate when examining the effect of social capital because the variation in social capital is especially large between countries. If too much (little) weight is given to countries with large (small) populations, then the interesting variation in social capital is substantially lost.
Organisation for Economic Co-operation and Development (OECD) in 2011–2012.10
During this period, PIAAC surveyed approximately 166,000 adults aged 16–65 years from 24 countries (OECD 2015b). PIAAC directly assesses adult skills in literacy,
numeracy, and problem solving using ICT, surveys various skills used at work and
home, and collects various background information, including demographic and job
characteristics. Among 22 countries, for which the PUF are available, 14 countries that
contain detailed (2-digit level based on ISIC Rev. 4) industry codes for worker’s jobs
and information on geographical regions are primarily analyzed in the regression
analysis.11 The number of regions in these countries amounts to at most 142 regions.12
Industry-level data on IndCoord and jc Z are constructed from the 2011 jc input–output table of each country taken from the OECD Input–Output Database (2015 edition) (OECD 2015a). As will be mentioned in the next subsection, an alternative
j
IndCoord is also constructed from the IPUMS American Community Survey (ACS) 2008–2012 5-year sample (Ruggles et al. 2015). Region-level social capital data is constructed from PIAAC as well as the World Values Survey and European Values
Study data for the period 1989–2011 (WVS-EVS; World Values Survey Association 2015; European Values Study Foundation 2011). The following subsection details the
data for industry’s coordination needs and social capital.
10
I use the PUF for Round-1 countries released in March 2015. In addition, as for the German data, the German PIAAC Scientific Use File (Rammstedt et al. 2015), which contains more detailed variables, is used as a supplement.
11
The 14 countries are Czech Republic, Denmark, France, Germany, Ireland, Japan, South Korea, Netherlands, Poland, Russia (excluding Moscow municipal area), Slovak Republic, Spain, Sweden, United Kingdom (UK, England, and Northern Ireland only). The remaining 8 countries (Austria, Canada, Estonia, Finland, Belgium [Flanders only], Italy, Norway, and the US) do not contain information on geographical regions, and the first four of them do not contain 2-digit level industry codes.
12
Based on the sample in the column (1) of Table 6.1, when using Trust1_piaac. The corresponding number of regions is 103, when using Trust1_wvs. The unit of region is the OECD’s Territorial level 2 (TL2), when using SocK constructed from PIAAC data. When SocK is constructed from WVS-EVS, some TL2 regions are aggregated to be matched with WVS-EVS’s region codes.
To analyze the delegation to non-managerial and non-supervisory workers
working at the lowest level of the firm’s hierarchy, I restrict the sample to employees i)
who are in paid employment (excluding self-employed), ii) whose occupation is neither
armed forces, legislators, senior officials and managers, professionals, nor skilled
agricultural and fishery workers;13 and iii) who have no employees to supervise or
manage, either directly or indirectly.
4.2 Construction of Key Variables 4.2.1 Decent: Decentralization
I construct two decentralization indices. The first index, Decent1, is
constructed from the four PIAAC questions that ask to what extent (based on the
5-point scale) the respondent can choose or change (i) the sequence of her tasks, (ii)
how she does her work, (iii) the speed or rate of her work, and (iv) her working hours.14
These four items are used by the PIAAC to construct the variable called TASKDISC
and indicates the degree of task discretion. The second index, Decent2, is constructed
from these four questions plus three additional PIAAC questions, that is, the 5-point
scale frequencies of (v) planning the respondent’s own activities, (vi) organizing her
own time, and (vii) confronting complex problems that take at least 30 minutes to find a
good solution.15
Because scaling may vary across questions, the answer to each question is first
standardized to have zero mean and one standard deviation. Then, Decent1 and Decent2
13
That is, sample workers are restricted to those of the following occupation categories: technicians and associate professionals; clerks; service workers and shop and market sales workers; craft and related trades workers; plant and machine operators and assemblers; and elementary occupations.
14
The answer to each question takes the value of 1 (not at all), 2 (very little), 3 (to some extent), 4 (to a high extent), or 5 (to a very high extent).
15
The answers to those questions take the value of 1(never), 2 (less than once a month), 3 (less than once a week but at least once a month), 4 (at least once a week but not every day), or 5 (every day).
are constructed as the unweighted average across the corresponding four or seven
standardized answers. This procedure is similar to that employed by Bloom and Van
Reenen (2007), who constructed an aggregate management practice score from 18
five-point scale questions.16 As shown in Appendix Table A2, all seven questions are
positively correlated with one another and the aggregate indices, Decent1 and Decent2,
are highly positively correlated (the correlation coefficient is 0.894).
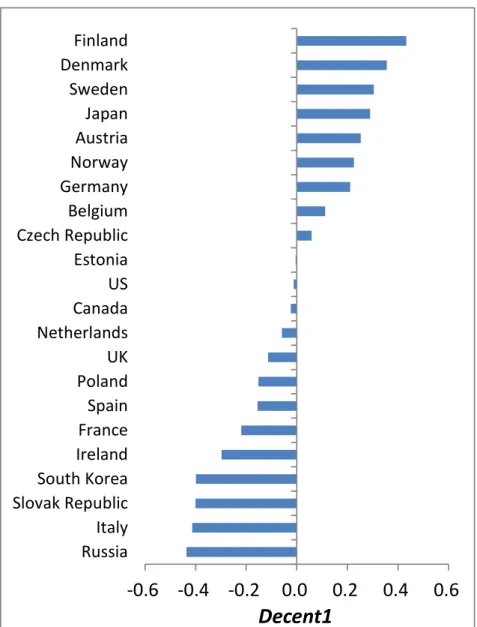
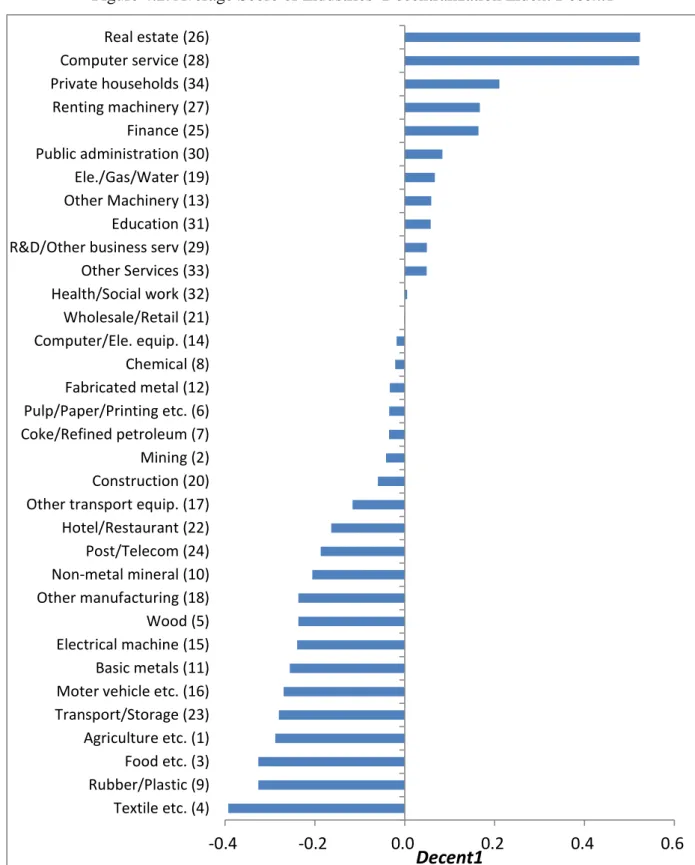
Figures 4.1 and 4.2 arrange country and industry, respectively, in descending
order of Decent1.17 In both decentralization indices, Northern European countries,
Japan, and Austria tend to delegate larger authority to lower level workers, whereas
Russia, the Slovak Republic, Italy, France, Spain, Ireland, and South Korea tend to
delegate less authority. The US, UK, and Canada lie in the middle. In terms of industry,
the degree of delegation tends to be higher in many service industries (e.g., real estate,
computer services, finance, and renting of machinery) and lower in many manufacturing
(e.g., textile and apparel, rubber and plastic, food, beverages and tobacco) and
agriculture, hunting, forestry, and fishing industries.
4.2.2 IndCoord: Coordination Needs of Industries
I assume that an industry’s need for coordination is higher when the industry
has longer production chains, that is, it requires greater amounts of intermediate inputs
or longer sequences of production stages to produce a final product.18 For example, to
produce a perfect-quality car and earn high-level profits, coordination between and
within various divisions (research and development, design, marketing and sales,
16
Similar aggregation technique is used in Bresnahan et al. (2002) who construct a decentralization measure of workplace.
17
As Appendix Figures A1 and A2 show, similar tendencies are observed in terms of Decent2.
18
As for firm-specific measures, existing studies use measures such as the size of inter-plant transfers within a firm (McElheran 2014), the number of other workplaces producing the same product (Meagher and Wait 2014), and dummies for a multi-plant firm and being a subcontractor (Colombo and Delmastro 2004).
material and parts procurement, and multiple plants) is essential. Each auto part needs to
be of good quality and fit with other parts, and cost-effective (by utilizing economies of
scale) at the same time. As suggested by the O-ring theory by Kremer (1993), the
malfunction probability of a final product increases with the number of parts used. Thus,
coordination becomes more important for the profit of firms using greater amounts of
intermediate inputs. By contrast, in apparel manufacturing or financial service industries,
less intermediate inputs or production stages are required, and thus, coordination
activities are less intense and less important.
More precisely, as the primary measure for the industry’s coordination needs
(IndCoord1 ), I use the column sum of the Leontief inverse coefficient of industry j in jc
country c in 2011.19 This index is used in Asuyama (2012, 2015) as a measure for the
industry’s length of production chains and in Fally (2012) as “the number of production
stages embodied in each product.” The data are taken from an input–output table, which
is in the form of a 34 industry*34 industry matrix, for each country, constructed by the
OECD (OECD 2015a). ThisIndCoord1 measures the dollar amount of intermediate jc
inputs that are directly or indirectly required to produce one dollar’s worth of industry
j’s output.
I also use an alternative measure IndCoord2 , which is the industry-specific j
skill substitutability (or complementarity) index used in Bombardini et al. (2012). As
they mention, higher skill complementarity means that poor performance at one task
reduces the output more significantly and that teamwork is important. Thus,
coordination is more crucial for profit in industries with higher skill complementarity.
As IndCoord2 , the ranking of industries, based on residual wage dispersion j
19 =
∑
k kjc
jc leon
IndCoord1 , where leonkjcis the (k, j)th entry of the Leontief inverse coefficient matrix, L. L=(I −A)−1, where I is the identity matrix and A is the input coefficient matrix whose (k, j)th entry is akj, which is the amount of input sourced from industry k directly used to produce one dollar’s worth of industry j’s output.
(measured in terms of standard deviation), which is computed from the IPUMS
American Community Survey (ACS) 2008–2012 5-year sample, is used following Bombardini et al. (2012).20 Higher residual wage dispersion (i.e., lower residual wage
dispersion ranking) stands for lower complementarity and thus lower need for
coordination of the industry. As Bombardini et al. (2012) explain, marginal product of,
and thus wage return to, unobserved skill is higher in industries with lower skill
complementarity. Thus, the residual wage dispersion after purging the effect of
individual characteristics (such as education, age, gender, and race) becomes greater as
the industry’s skill complementarity becomes lower. More details on the construction of
j
IndCoord2 are provided in Appendix A.
j
IndCoord2 has an advantage over IndCoord1 in that more detailed jc industry classifications are available (71 industries compared with 34 industries in the
case of IndCoord1jc ). 21 The disadvantage of IndCoord2 is that it loses j
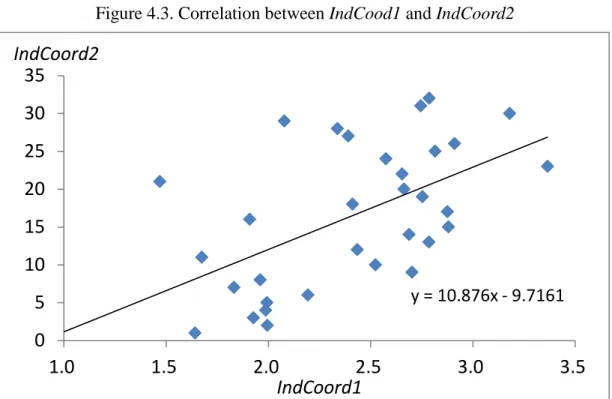
cross-country variation. Figure 4.3 plots IndCoord1 and jc IndCoord2 constructed j
based on the same 34 industries as IndCoord1 . This shows that both indices are jc
highly positively correlated (the correlation coefficient is 0.548 and significant at 1%
level), reinforcing the validity of using both indices as the measure for industry’s
coordination needs.
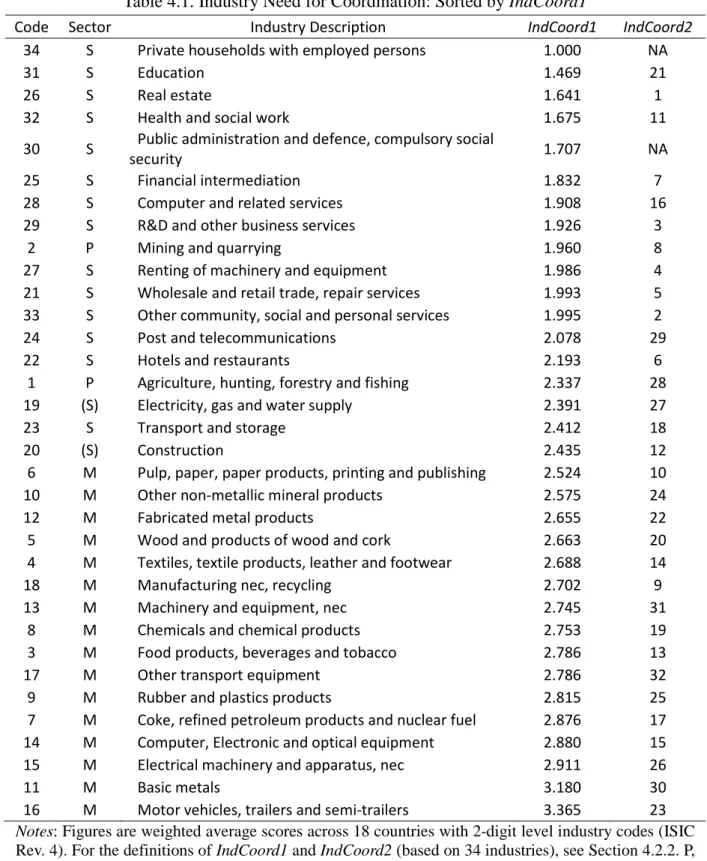
Table 4.1 arranges 34 industries in ascending order of IndCoord1 averaged jc
across countries. It also reports the 34-industry-based IndCoord2 .j 22 This reveals that
manufacturing industries are characterized by a greater need for coordination compared
with service industries. In terms of IndCoord2 , several service industries (e.g., post j
20
Similar to Bombardini et al. (2012), I also experiment with the 95-5 interpercentile range (instead of standard deviation) as the wage dispersion measure, and obtain similar estimation results because both measures are highly correlated.
21
Seventy-one industries are created by matching the 2-digit ISIC Rev. 4 industry code in PIAAC and the INDNAICS code in ACS.
22
j
IndCoord2 based on 71-industry classification is reported in Appendix Table A3.
and telecommunications; electricity, gas and water supply; education; transport and
storage; and computer-related services) record a higher need for coordination than
manufacturing industries (e.g., other manufacturing; pulp and paper; food, beverage and
tobacco; textile, apparel and leather; and computer, electronic, and optical equipment).
Higher coordination needs in many manufacturing industries compared with
service industries are consistent with intuition, considering the nature of producing a
manufactured good, which generally requires more sequential production stages. For
example, a delay in parts production in the previous stages results in more idling time
(lower productivity) of workers in the later production stages. Thus, coordination
between sequential production stages is essential. By contrast, in case of services, such
as selling a financial product, the sales talk of each worker is usually not sequential, but
rather simultaneous and does not affect the productivity of other workers in general,
although certain processes (e.g., R&D and marketing before selling products) are
sequential, similar to manufacturing.
4.2.3 SocK: Social Capital Standing for Workers’ Self-Centeredness
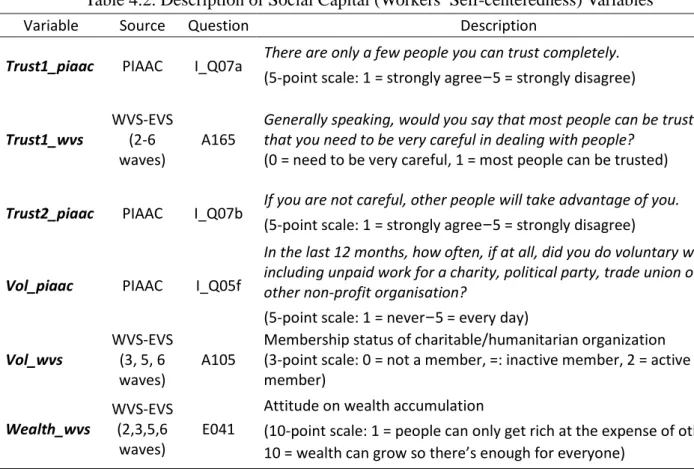
Table 4.2 lists the social capital variables used in the regression analysis. They
are constructed from either PIAAC or the World Values Survey and European Values
Study data (WVS-EVS). All social capital values are region-average figures for
non-managerial workers.23 The use of WVS-EVS data can mitigate a possible
simultaneity bias arising from constructing both Decent and SocK from the same
PIAAC data. WVS-EVS is an international survey whose main focus is to collect
people’s various values/attitudes toward family, work, gender, religion, politics, society,
23
When using PIAAC, samples are non-managerial and non-supervisory workers who are working at the lowest level of the firm’s hierarchy and thus the same as the regression sample. When using WVS-EVS, samples are based on workers, not self-employed, and having an occupation of either non-manual office worker, foreman and supervisor, or manual worker. For both PIAAC and WVS-EVS data, regions that have less than 30 observations to calculate the region-average social capital are excluded from the sample.
and so on. Similarly to Bloom et al. (2012), I combine multiple survey waves (between
1989 and 2011) and calculate a simple average SocK for each region over all available
years to increase the sample size.24 This strategy is reasonable given the long-lasting
nature of people’s values (Bisin and Verdier 2011).
I use six social capital variables (Table 4.2): three trust-related variables
(Trust1_piaac, Trust1_wvs, Trust2_piaac);25 two altruism-related variables, which are
measured by the participation in voluntary work (Vol_piaac, Vol_wvs); and attitude on
wealth accumulation (Wealth_wvs). These variables are chosen because they are
considered to serve as proxies for the level of self-centeredness of the average worker
in the region and also because they cover a sufficient number of countries and
observations to calculate the region-level figure. Note that higher social capital means
lower self-centeredness.
Similar to the argument by Bloom et al. (2012), trust (in particular,
Trust1_piaac, Trust1_wvs) captures the belief of workers in the region that other
workers do not do “wrong” actions (e.g., rent-seeking behaviors). Then, higher level of
trust indicates the lower possibility of rent-seeking behaviors, i.e., the more aligned
interests between the HQ and workers (= lower
λ
in the model in Section 2). Alternative reasoning is possible in particular for Trust2_piaac. Consider asociety in which people think that if they are not careful, others will take advantage of
them. In such a society, it is likely that workers become self-centered; that is, put less
weight on others’ performances (large
λ
). This is because caring about others’24
To reduce the difference in timing of measuring social capital across regions, the first-wave surveys (1981–1984) are excluded. In addition, since data on decentralization was collected in 2011–2012, part of the sixth-wave surveys (2010–2014) that were conducted before 2012 is also excluded.
25
Trust1_wvs is the most popular trust variable used in literature that examines the effect of trust on economic outcome (Bloom et al. 2012; Algan and Cahuc 2014; Cingano and Pinotti 2016). WVS-EVS also contains a similar question as Trust2_piaac, which is not used because of limited country-coverage.
performances leads to more communication, but it is believed that the shared
information is likely to be exploited by others and harms the worker.
It is rather straightforward that the level of altruism (measured by the degree of
voluntary activities) proxies the degree of self-centeredness. The more altruistic
workers are, the more they care about others’ activities and are eager to help others to
perform better.
Finally, Wealth_wvs measures how workers place their views on a 10-point
scale ranging from 1 (people can only get rich at the expense of others) to 10 (wealth
can grow, so there’s enough for everyone). The lower Wealth_wvs, the more difficult it
is for the workers to care about others’ performance, which is believed to result in
higher rewards to others at their own expense. For this reason, Wealth_wvs is
considered to proxy the degree of self-centeredness of workers.
Appendix Table A4 displays the correlations among the six social capital
variables. All pairwise correlations are positive. The three trust-related variables are
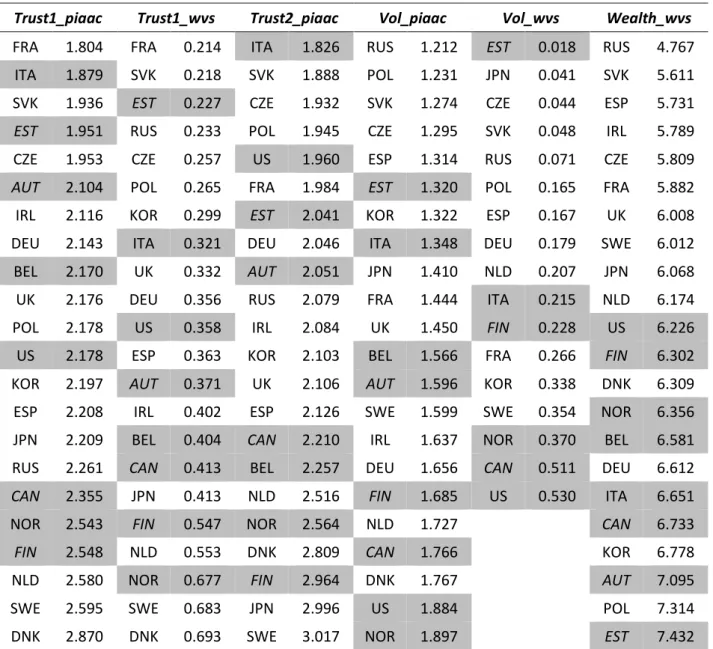
highly and positively correlated. Next, Table 4.3 arranges countries in ascending order
of the average level of each social capital variable. It shows that former communist
countries and France tend to score low, while Northern European countries and Canada
tend to score high.
Finally, summary statistics of all the dependent and independent variables
based on regression samples are reported in the Appendix Table A1.
5. Results I: Benefits of Decentralization
Before examining the effects of an industry’s need for coordination and
workers’ self-centeredness on decentralization, this section briefly examines whether
some of the benefits of decentralization mentioned in the Introduction are actually
sample taken from PIAAC, a variable representing the potential benefit of
decentralization (Benefit) is regressed on the degree of decentralization (Decent) and
other control variables, similar to those in equation (3.1).26
As mentioned in the Introduction, greater decentralization is expected to
accompany productivity improvement owing to the increased job
satisfaction/motivation of workers. This benefit is captured by worker’s job satisfaction
(Satisfied) and hourly wage (Wage). I assume that a worker’s hourly wages proxy their
productivity after controlling for region-specific wage-setting institutions by region
dummies. Through a laboratory experiment, Bartling et al. (2012) find that offering
higher discretion to a worker results in higher productivity and profits, provided she
receives higher wages. Then, the expected positive association between wages and
delegation may not be causal, but is likely to indicate higher productivity.
Delegation to workers is also expected to increase the demand for skills
because the return to delegation is higher when workers have higher ability to manage
their delegated tasks (Bloom and Van Reenen 2011: 1755). Then, decentralized firms
would provide more training to their workers (Train), bear a larger amount of its costs
(Train_wh, Train_cost), and demand more educated and experienced workers
(Edu_demand, Edu_higherD, Exp_demand). Skill upgrading of workers also may not be
necessarily causal, but a complement to decentralization in the sense that
simultaneously introducing both would be profitable to firms.
The details and summary statistics of the eight Benefit variables are displayed
in Table 5.1. Table 5.2 reports the estimated coefficients of Decent obtained in the
Benefit regressions. The estimation method depends on the type of Benefit variables: least squares for Wage, probit for Train, and ordered probit for other Benefit variables.
The degree of decentralization to workers are positively and statistically significantly
26
As for the control variables, see the notes of Table 5.2.
associated with all the Benefit variables, except Train_cost, even after controlling for
various individual characteristics including multiple dimensions of skills (e.g.,
education, age [or experience and tenure], literacy and numeracy proficiency scores)
and dummies for industry and country (or region in Wage regression).27 The obtained
results are consistent with the hypothesis that more delegation to non-managerial and
non-supervisory workers leads to (or is a complement to) higher job satisfaction and
wages that proxy higher productivity, and skill upgrading through training and hiring.
6. Results II: Determinants of Decentralization
6.1 Need for Coordination and Self-centeredness: Baseline Results
Despite the benefits of decentralization, delegation to workers would be limited
if the costs of delegation (misaligned interests owing to self-centeredness of workers
and coordination failure) is sufficiently large. Thus, this section examines the effects of
the self-centeredness of workers and industry’s need for coordination on the degree of
delegation to workers.
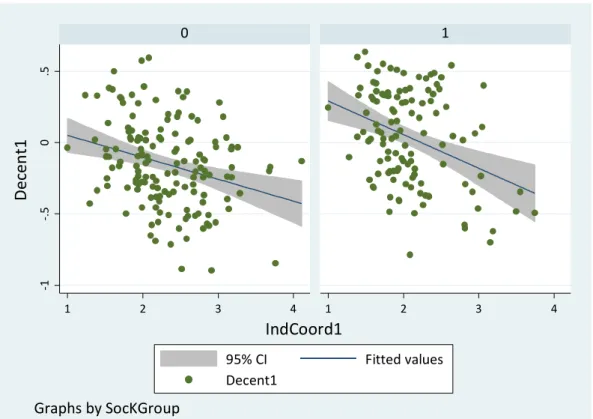
First, Figure 6.1 plots Decent1 and IndCoord1 (both of which are weighted
averages of country×industry cell) by the level of country-average Trust1_piaac. The left and right plots are based on (nine) countries with low and high average
Trust1_piaac, respectively. The similar plots based on other SocK variables are displayed in the Appendix Figure A3. As expected, regardless of the SocK variables, the
degree of delegation is negatively associated with both self-centeredness of workers and
industry’s need for coordination. Although not displayed, a similar tendency is observed
for Decent2.
27
The positive associations of job satisfaction and wages with delegation to non-managerial workers are consistent with Appelbaum et al. (2000) who find similar correlations by using worker survey data in three US manufacturing industries.
Figure 6.1 does not control for the effects of individual, workplace, industry, or
location characteristics on decentralization. As a next step, Table 6.1 reports the
estimation results for equation (3.1) in the case of using IndCoord1, which controls for
these various characteristics. It only reports the estimated coefficients on IndCoord1,
SocK, and IndCoord1*SocK. All specifications control for industry dummies. Columns (1)–(3) control for country dummies and column (4) controls for region dummies, and thus, the coefficient on region-specific SocK is not identified. As for the difference in
other control variables and their estimated coefficients, see the notes of Table 6.1 and
Table 6.2.
Table 6.1 shows that, regardless of SocK and Decent variables and
specifications, the coefficient on IndCoord1 is always significantly negative, indicating
that a greater need for coordination is associated with less delegation to workers. The
coefficient on SocK tends to be positive in column (1). However, it turns out to be either
insignificant or negative after adding the interaction term IndCoord1*SocK (columns 2– 4). The coefficient on IndCoord1*SocK is always significantly positive, implying that,
as the degree of self-centeredness decreases (i.e., as the SocK increases), the negative
impact of the need for coordination on decentralization is mitigated. The size of
coefficients is similar regardless of whether country or region dummies are controlled
for and whether Decent1 or Decent2 is used as the dependent variable.
These results are mostly consistent with the predictions presented in Section 3.
At first sight, the insignificant or negative coefficients on SocK in columns (2)–(4) seem at odds. However, the minimum value for IndCoord1 is not zero, but one. Furthermore,
the null hypothesis, βˆ2 +βˆ3 =0 (where βˆ2 andβˆ3 are coefficients of SocK and IndCoord1*SocK, respectively) is not rejected, even at a 10% significance level, except in one case (column (3) when using Decent2 and Trust2_piaac). Consequently, the
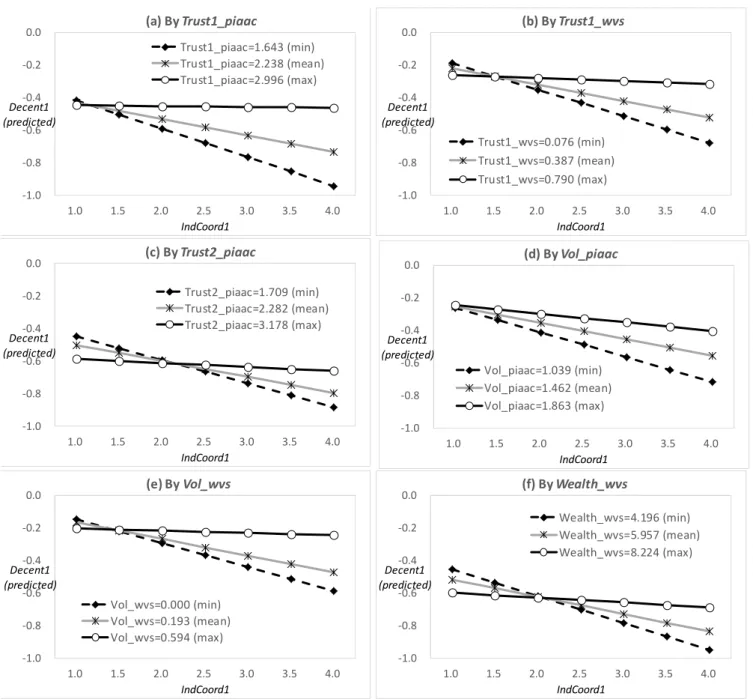
Figure 6.2 illustrates.28 Using the estimated coefficients in column (3) of Table 6.1,
Figure 6.2 plots predicted Decent1 (𝐷𝐷𝐷𝐷𝐷𝐷𝐷𝐷𝐷𝐷𝐷𝐷1� ) and IndCoord1, separately by the minimum, mean, and maximum values of SocK in the regression sample. 𝐷𝐷𝐷𝐷𝐷𝐷𝐷𝐷𝐷𝐷𝐷𝐷1� is
predicted based solely on IndCoord1 and SocK (=
SocK * IndCoord1 SocK IndCoord1 2 3 1 ˆ ˆ ˆ β β
β + + ). Similar pictures are observed when
plotting predicted values of Decent2. These graphs generally confirm the predictions: (i)
higher need for coordination is negatively associated with decentralization in general;
(ii) lower self-centeredness (i.e., higher SocK) is positively associated with
decentralization in general; (iii) the negative association between coordination needs
and decentralization is mitigated as the level of self-centeredness becomes lower; and
(iv) when coordination needs are very low, the degree of decentralization is almost the
same, regardless of the level of self-centeredness. Note that if we set βˆ2 +βˆ3 =0, then all three lines start from the same level of Decent1 when IndCoord1 = 1.0. Furthermore,
when the level of self-centeredness is very low, the degree of delegation does not
depend on the coordination needs. This can be seen from the nearly flat graph line of
Decent1 when the maximum SocK is used, except the case using Vol_piaac.
6.2 Other Determinants of Decentralization
Table 6.2 reports the estimation results for columns (3) and (4) in Table 6.1
including other control variables and using Decent1 as the dependent variable. As
mentioned in the Introduction, assessing the associations between individual
characteristics and delegation is one of the unique features of this paper.
28
When IndCoord1 is one (very low) andβˆ2 +βˆ3 =0, the degree of decentralization is not associated with the level of SocK as expected in prediction (iv). However, as IndCoord1 becomes higher, the coefficient on SocK, that is, (βˆ2 +βˆ3IndCoord1), departs from zero and becomes larger. In other words, SocK is positively associated with decentralization when IndCoord1 is not very low.
Individual (and partly workplace) characteristics that are positively and
significantly associated with the degree of delegation are: years of experience, years of
education, health status, frequency of skill use in the workplace in terms of ICT, reading,
writing, and numeracy skills, having an indefinite employment contract, and working in
a non-profit organization (compared with a private organization). By contrast, being a
female, born abroad, speaking a foreign native language, working as either a clerk,
service/sales worker, craft worker, or operator/assembler (compared with elementary
occupation), working fulltime (i.e., working more than 30 hours per week), working in a
larger-size establishment, in a workplace that belongs to a larger firm, in the public
sector, are negatively associated with delegation. Similar tendencies are found when
using Decent2 (Appendix Table A5). In the case of Decent2, however, age, tenure, and
numeracy skills are also positively associated with the degree of delegation in most
specifications while the coefficients on craft occupation and fulltime dummy are not
statistically significant.
Positive associations between worker’s skill (education, experience, tenure,
numeracy skill, and frequency of skill use) and decentralization are consistent with
firm- or establishment-level studies, such as Bloom et al. (2012) and Bresnahan et al.
(2002). The positive coefficient on ICT skill use in the workplace is also consistent with
findings in previous studies (Bresnahan et al. 2002; Colombo and Delmastro 2004;
McElheran 2014).
Compared with these results, more delegation to workers with elementary
occupations, and less delegation to those working fulltime, belonging to a larger
establishment or firm initially seems surprising. However, it is less surprising if workers
with elementary occupations enjoy greater autonomy over their own work, given that
these occupations include cleaners; laborers in mining, construction, manufacturing, and
transport; street vendors; and so on. It is also natural that part-time workers have more
establishment/firm size, most studies find that it is positively associated with
decentralization (Colombo and Delmastro 2004; Bloom et al. 2012; Graham et al. 2015;
Cingano and Pinotti 2016), although a few studies find an insignificant or negative
association (McElheran 2014; Meagher and Wait 2014). The current paper differs from
these past studies in that I examine the delegation to workers at the lowest level of
organization, whereas past studies mostly examine delegation to managers. The number
of hierarchic levels between HQ and managers is almost identical, regardless of
organization size, whereas that between HQ and workers at the lowest level increases
with organization size. Thus, it is natural that, in a smaller organization, where the
number of hierarchic levels is also smaller, the lowest-level workers are required to
share greater authority.
As for the industry characteristics, working in industries with higher export
ratios is negatively associated with delegation, whereas the coefficient on import ratio is
mostly insignificant (Table 6.2, Appendix Table A5).29 These results are different from
several empirical studies that find positive association between product market
competition and decentralization (Bloom et al. 2010; Guadalupe and Wulf 2010;
Meagher and Wait 2014), although the results on the effect of import competition are
mixed in these studies too. From a theoretical point of view, negative association
between competition and decentralization is possible (Alonso et al. 2015): Competition
could favor centralization if the principal has better knowledge about other markets (e.g.,
global markets) than the agent and thus holds an advantage in coordinating adaptation
to multiple markets (Alonso et al. 2015).
6.3 Additional Results on Need for Coordination and Self-centeredness
I also estimate equation (3.1) using the 71-industry-based IndCoord2 instead of
29
It should be noted that the effects of industry characteristics that are common across countries are absorbed by the industry dummies.
the 34-industry based IndCoord1. The estimation results are reported in Table 6.3. The
column numbers (2–4) indicate that the specification is the same as the corresponding column number in Table 6.1, except that the IndCoord2 coefficient is unidentified and
that export and import ratios of the industry are not controlled, owing to data
unavailability. IndCoord2 is industry-specific and common across countries, and thus,
industry dummies absorb its effect. The results are mostly similar to those when using
IndCoord1. The coefficient of SocK is mostly insignificant and that of IndCoord2*SocK is always significantly positive.
The analysis so far mitigates the possible endogeneity bias by controlling for
various individual and workplace characteristics, including multiple ability-related
measures and industry-specific and country/region-specific factors. It is also reasonable
to consider the industry-level need for coordination (in particular, IndCoord2, which is
taken from US data) exogenous for the firm’s HQ that chooses the optimal degree of
delegation. Region-level social capital (in particular, the one taken from the different
source [WVS-EVS]), which is likely to be slow changing, is also considered almost
exogenous for the firm. However, reverse causality from decentralization to social
capital might still be possible. For example, Appelbaum et al. (2000, Chapter 9) argue
that workers’ greater opportunity to participate in decision making leads to their higher
trust of managers.
To deal with such potential reverse causality, SocK is instrumented with the
country-specific ethnic segregation index (Segregation) constructed by Alesina and
Zhuravskaya (2011).30 Alesina and Zhuravskaya (2011) find that more segregated
30
More precisely, SocK is instrumented with [1-Segregation] to generate positive association between SocK and Segregation, because Segregation ranges from 0 to 1 and becomes larger when the country is more segregated. Alesina and Zhuravskaya (2011) also construct linguistic and religious segregation indices, but these are not used due to their limited country coverage. It should be noted that, among countries included in the estimation sample in Tables 6.1–6.3, ethnic segregation index is not available for Poland.
countries, where ethnic groups live more spatially separately, have lower levels of trust.
Then, the decentralization measure is regressed on IndCoord2*SocK, industry and
region dummies, and other control variables (Control 1’ or Control 3’ in Table 6.3) by
the two-stage least squares (2SLS) method. The results are reported in Table 6.4. Note
that, owing to the inclusion of industry and region dummies, βˆ1and βˆ2 are not identified. First, the instrument (IndCoord2*[1-Segregation]) is strongly correlated with
IndCoord2*SocK in all specifications, except when using Trust1_piaac as SocK. This is shown by the F statistic in the first stage regression, which is substantially larger than
10 (the rule of thumb by Staiger and Stock [1997]) or 16.38 (Stock and Yogo [2005]’s
critical values with the 10% maximal size of Wald test) in all specifications except the
Trust1_piaac case. Next, the results of the endogeneity test show that the null hypothesis that SocK is exogenous is not rejected in all specifications at 5% (or 1% in
most cases) significance level. These results indicate that the results obtained in Tables
6.1, 6.2, and 6.3 are robust.
7. Conclusion
Despite the various benefits of delegation to workers, the actual degree of
delegation substantially varies across countries/regions and industries. As an important
reason for such variation, this paper focuses on the differences in two types of
delegation costs: (1) region-specific social capital that proxies workers’ degree of
self-centeredness and (2) industry-specific need for coordination. Based on the
theoretical framework by Alonso et al. (2008), I have empirically examined the effect of
these two cost measures on the degree of delegation to non-managerial and
non-supervisory workers utilizing worker-level PIAAC data from 14 countries.
The empirical results of this study have confirmed the theoretical predictions
needs and decentralization is mitigated in regions with lower self-centeredness of
workers. In particular, when self-centeredness of workers (respectively, coordination
need) is very low, the degree of delegation is very high and generally does not depend
on the level of coordination needs (self-centeredness of workers). These results are
robust to alternative indices for delegation, an industry’s coordination needs, and
self-centeredness of workers. The possibility of endogeneity bias is minimized by
controlling for various individual and workplace characteristics, and industry and
country/region dummies, by constructing social capital and coordination needs indices
from other sources, and by conducting endogeneity tests for social capital variables.
I also have found that delegation is positively associated with its potential
benefits, such as higher job satisfaction, higher wages (proxy for higher productivity),
more training, and increased demand for skills. These benefits are beneficial not only
for firms, but also for the welfare of workers and a country’s economic development.
The identified positive associations are consistent with the theoretical predictions that
delegation brings such effects. My empirical results are not necessarily causal and may
partly reflect the complementarities among decentralization and these “benefits.”
However, even in the complementary case, it is highly likely that social capital and
coordination needs affect firms’ joint decisions on the levels of delegation, wages, and
skill upgrading.
This study has important implications for the economic development patterns
of regions or countries. As summarized above, this study has shown that the degree of
delegation to workers becomes high in regions in which workers’ self-centeredness is
low, even when the industry’s coordination needs are extremely high. These industries
requiring greater coordination are those that need to combine greater amounts of
intermediate inputs (or require a greater number of production stages) and substantially
suffer from a poor performance in production processes. Many manufacturing industries,
fall into this type. These tendencies are generally observed, regardless of country.31
Then, the results of this paper imply that non-managerial and non-supervisory workers
in these manufacturing industries are delegated more authority, are more satisfied,
receive higher wages and more training, and achieve higher productivity in
regions/countries in which self-centeredness of workers is lower. Thus, by changing the
level of delegation and its “benefits,” social capital representing self-centeredness may
affect not only economic growth, but also the comparative advantage of regions or
countries. In addition, higher wages and higher skill demand for non-managerial and
non-supervisory positions may lead to less inequality in terms of both income and skill.
These possible links between social capital, delegation, and comparative
advantage and inequalities of regions/countries are interesting areas for future empirical
investigation. Examining whether greater delegation in the case of very low
self-centeredness and very high coordination needs are actually due to improved
horizontal communication and coordination among workers as modeled by Alonso et al.
(2008) is also left for future research, as data for horizontal and vertical communication
were not available for this study.
References
Aghion, Philippe, and Jean Tirole. 1997. “Formal and Real Authority in Organizations.”
Journal of Political Economy, 105(1): 1-29.
Alesina, Alberto, and Paola Giuliano. 2015. “Culture and Institutions” Journal of
Economic Literature, 53(4): 898–944.
Alesina, Alberto, and Ekaterina Zhuravskaya. 2011. “Segregation and the Quality of
Government in a Cross Section of Countries.” American Economic Review,
31
The level of coordination needs for each industry is highly correlated among various countries: The unweighted average of pairwise correlation coefficients among IndCoord1 over 18 countries is 0.834.