Multiple preference regimes and rules of
origin
著者
Hayakawa Kazunobu
権利
Copyrights 日本貿易振興機構(ジェトロ)アジア
経済研究所 / Institute of Developing
Economies, Japan External Trade Organization
(IDE-JETRO) http://www.ide.go.jp
journal or
publication title
IDE Discussion Paper
volume
738
year
2019-02
INSTITUTE OF DEVELOPING ECONOMIES
IDE Discussion Papers are preliminary materials circulated to stimulate discussions and critical comments
Keywords: Rules of origin; Least developed countries; Generalized system of
preferences; Regional trade agreements
JEL classification: F15, F53
* Senior Research Fellow, Economic Geography Studies Group, Development Studies Center, IDE ([email protected])
IDE DISCUSSION PAPER No. 738
Multiple Preference Regimes and
Rules of Origin
Kazunobu HAYAKAWA*
February 2019
Abstract: This study examines Japan’s preferential imports from three least developed countries (LDCs), i.e.,
Cambodia, Laos, and Myanmar, from 2013 to 2016. In these trade flows, two preference regimes are available in addition to a most favored nation regime: the Generalized System of Preferences (GSP) for LDCs (GSP-LDC) and a plurilateral trade agreement among Japan and ASEAN countries (AJCEP). We empirically examine how relaxing the rules of origin in GSP-LDC for knitted apparel in 2015 changed the utilization of the GSP-LDC and AJCEP regimes. Our identification strategy relies on comparisons not only between GSP-LDC and AJCEP but also between knitted and woven apparel. As a result, we found that such relaxation significantly increases the share of imports under the GSP-LDC regime out of total imports and reduces the share of imports under the AJCEP regime. We further investigate the main drivers of these changes in the shares.
The Institute of Developing Economies (IDE) is a semigovernmental, nonpartisan, nonprofit research institute, founded in 1958. The Institute merged with the Japan External Trade Organization (JETRO) on July 1, 1998. The Institute conducts basic and comprehensive studies on economic and related affairs in all developing countries and regions, including Asia, the Middle East, Africa, Latin America, Oceania, and Eastern Europe.
The views expressed in this publication are those of the author(s). Publication does not imply endorsement by the Institute of Developing Economies of any of the views expressed within.
INSTITUTE OF DEVELOPING ECONOMIES (IDE), JETRO 3-2-2, WAKABA,MIHAMA-KU,CHIBA-SHI
CHIBA 261-8545, JAPAN
©2019 by Institute of Developing Economies, JETRO
No part of this publication may be reproduced without the prior permission of the IDE-JETRO.
1
Multiple Preference Regimes and Rules of Origin
Kazunobu HAYAKAWA*#
Development Studies Center, Institute of Developing Economies, Japan
Abstract: This study examines Japan’s preferential imports from three least developed countries (LDCs), i.e., Cambodia, Laos, and Myanmar, from 2013 to 2016. In these trade flows, two preference regimes are available in addition to a most favored nation regime: the Generalized System of Preferences (GSP) for LDCs (GSP-LDC) and a plurilateral trade agreement among Japan and ASEAN countries (AJCEP). We empirically examine how relaxing the rules of origin in GSP-LDC for knitted apparel in 2015 changed the utilization of the GSP-LDC and AJCEP regimes. Our identification strategy relies on comparisons not only between GSP-LDC and AJCEP but also between knitted and woven apparel. As a result, we found that such relaxation significantly increases the share of imports under the GSP-LDC regime out of total imports and reduces the share of imports under the AJCEP regime. We further investigate the main drivers of these changes in the shares.
Keywords: Rules of origin; Least developed countries; Generalized system of preferences; Regional trade agreements
JEL Classification: F15; F53
1. Introduction
The overlap of preference regimes (e.g., regional trade agreements (RTAs)) complicates firms’ choice of tariff regimes. For example, the North American Free Trade Agreement (NAFTA) was formed among the U.S., Mexico, and Canada in 1995. When firms in Mexico export to Canada, they need to choose their tariff regime between NAFTA and a most favored nation (MFN) regime. Furthermore, on December 30, 2018, the Comprehensive and Progressive Agreement for Trans-Pacific Partnership (CPTPP) entered into force among 11 countries including Canada and Mexico. Thus, firms in Mexico can now utilize CPTTP tariff rates in exporting to Canada. As a result, those firms need to choose their tariff regime between NAFTA, CPTPP, and MFN regimes. As implied in this example, firms’ choice of tariff regimes becomes complicated as the number of available preference
* I would like to thank Fukunari Kimura, Kiyoyasu Tanaka, Maki Nakaoka, and seminar participants in Kochi University, Nanzan University, Chuo University, and the Institute of Developing Economies for their invaluable comments. The author acknowledges financial support from the JSPS under KAKENHI Grant Number JP17H02530.
# Author: Kazunobu Hayakawa; Address: Wakaba 3-2-2, Mihama-ku, Chiba-shi, Chiba, 261-8545, Japan. Tel: 81-43-299-9500; Fax: 81-43-299-9724; E-mail: [email protected]
2
regimes increases. The number of RTAs has been growing particularly since the 2000s; thus, this issue of overlapping preference regimes is becoming more important.
In this paper, we empirically investigate how the reform of rules of origin (RoOs) in one preference regime changes the utilization of all available preference regimes. Tariff regimes differ regarding various elements including tariff rates and RoOs. RoOs are criteria to certify that exported products are originated in exporting countries. To receive preferential treatment regarding tariff payment, exporting firms have to comply with the RoOs specified in the preference regime. Even if one preference regime provides the lowest tariff rates among all available regimes, the RoOs in that regime might be most restrictive. Given these differences, firms will choose the best regime when multiple tariff regimes are available. Thus, in the above example, change to the RoOs in the NAFTA will affect not only the utilization of the NAFTA but also the utilization of the CPTPP and the MFN. The analysis on these effects of RoO change in one preference regime on the utilization or choice of tariff regimes will contribute to uncovering the interaction among tariff regimes when multiple regimes are available.
Specifically, we examine Japan’s imports of apparel products from three least developed countries (LDCs) from 2013 to 2016: Cambodia, Laos, and Myanmar. The critical reason for our focus on this import flow is that two preference regimes are available in addition to the MFN regime. One is the Generalized System of Preferences (GSP) for LDCs (GSP-LDC). This regime is Japan’s unilateral tariff elimination against LDCs. The other is the ASEAN-Japan Comprehensive Economic Partnership (AJCEP), which is a plurilateral RTA among Japan and ASEAN member states including the above three LDCs. Exporters from these countries to Japan can choose their tariff regime among MFN, AJCEP, and GSP regimes. The data on imports under each regime are available in Japan’s Ministry of Finance on a monthly basis and at a Japanese tariff-line level, i.e., a nine-digit level of the harmonized system (HS) classification. By employing these country-product-level data, we investigate the effects of reforming RoOs on preference utilization.
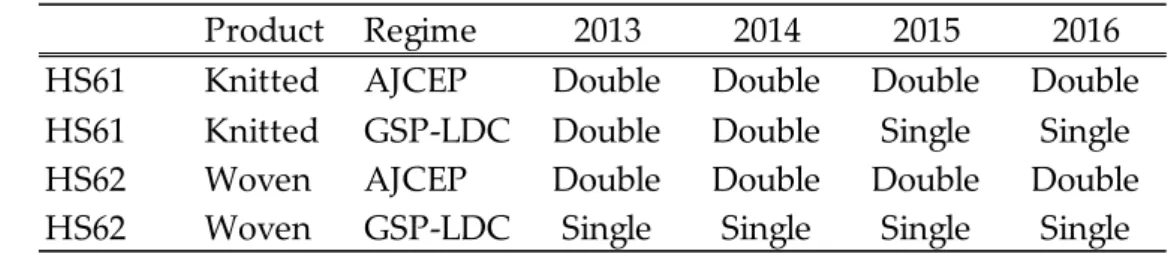
There is a crucial advantage of focusing on Japan’s imports of apparel products that include the HS 61 classification, i.e., knitted or crocheted apparel and clothing (“knitted apparel”), and the HS 62 classification (“woven apparel”). As summarized in Table 1, the Japanese government revised the RoOs in GSP-LDC for knitted apparel in April 2015. Those are relaxed from the so-called two-stage processing (or double transformation) rule to a single-stage processing (or single transformation) rule. The former requires fabrics and yarn for garment manufacturing to be produced within exporting countries to qualify for preferential treatment, whereas the latter does not impose any restrictions on the source of materials for garment production. In other words, during our sample period, the RoOs in GSP for knitted apparel become less restrictive. On the other hand, RoOs in AJCEP did not change and remained a two-stage processing rule. In addition, RoOs in GSP-LDC and AJCEP for woven apparel are single-stage and two-stage processing rules, respectively, and
3
do not change during our sample period1 . Thus, only the RoOs in GSP-LDC for knitted
products are relaxed during our sample period.
Table 1. RoOs for Knitted Apparel and Woven Apparel in AJCEP and GSP-LDC
Product Regime 2013 2014 2015 2016
HS61 Knitted AJCEP Double Double Double Double
HS61 Knitted GSP-LDC Double Double Single Single
HS62 Woven AJCEP Double Double Double Double
HS62 Woven GSP-LDC Single Single Single Single
Source: Author’s compilation
Note: “Single” and “Double” refer to single-stage processing and two-stage processing rules, respectively.
Our empirical analysis consists of the following three steps2. The first is to compare
the utilization of GSP-LDC with that of AJCEP in the imports of knitted apparel. The utilization of a preference regime is measured by the share of imports under the preference regime out of total imports (the sum of imports under GSP-LDC, AJCEP, and MFN regimes), which is called the “utilization rate” of the preference regime. The reform of RoOs for knitted apparel in GSP-LDC is expected to affect the utilization of both GSP-LDC and AJCEP in knitted apparel; the comparison of utilization rates in knitted apparel between GSP-LDC and AJCEP shows the relative effects of relaxing RoOs in GSP-LDC on the choice between the two preference regimes. As a result, we found that the relaxation of RoOs in GSP-LDC raises the utilization rates of GSP-LDC relative to those of AJCEP by 69–83 percentage points. In the second step, to see the absolute effects, we compare the utilization rates in knitted apparel with those in woven apparel. While knitted and woven apparels share similar production materials, they are different in terms, simply, of whether knitted (or crocheted) or woven. In other words, despite their similarity, the revision of RoOs in GSP-LDC for knitted apparel will not have direct effects on preference utilization in woven apparel. By exploiting this nature, we conduct a difference-in-differences (DID) analysis. Specifically, by comparing the effect on the utilization rate of GSP-LDC for knitted apparel with that for woven apparel, we will see the absolute effect of relaxing RoOs in GSP-LDC on the utilization rate of GSP-LDC. Similarly, the comparison in the utilization rate of AJCEP between knitted and woven apparels uncovers the absolute effect on the utilization rate of AJCEP. As a result,
1 More precisely, there are some woven apparel products that follow the two-stage processing rule in the GSP-LDC regime. In our empirical analysis, we do not exclude such woven apparel products because their RoOs do not change and are the two-stage processing throughout the sample period. We discuss this issue again in Section 4.
4
we found that the relaxation of RoOs in GSP-LDC significantly increases the utilization rate of GSP-LDC by 32–57 percentage points and results in a significant reduction in the utilization rate of AJCEP imports by 12–20 percentage points.
The last step is to examine the driving forces underlying the absolute effects described above. The utilization rate takes a share-form. Thus, even if the relaxation of RoOs does not change imports under the AJCEP regime at all, the increase in imports under GSP-LDC not only raises the share of GSP-LDC imports but also decreases the share of AJCEP imports. To uncover the source of changes in the utilization rates of each preferential regime, we investigate the level of imports under each tariff regime. In particular, we examine the source of the larger absolute effect in GSP-LDC imports (32–57 percentage points) in comparison with AJCEP imports (12–20 percentage points). Although there are various possible cases to yield this result, we found an insignificant change of the level of imports under AJCEP, which implies that the switching of firms from AJCEP to GSP-LDC is not a main driving force. On the other hand, we found that switching from MFN to GSP-LDC is one of the main drivers; however, this is still inadequate to fully explain the larger absolute effect in GSP-LDC imports. These results imply the existence of other possible drivers, such as the increase in export from existing GSP-LDC users and the start of export under the GSP-LDC regime. This paper contributes to two types of literature on the determinants of preference utilization3 . First, Bureau et al. (2007), Manchin (2006), and Hayakawa et al. (2019) are
studies that focus on the case where multiple preference regimes are available, as this paper does. In particular, Hayakawa et al. (2019) shed light on the difference in preferential tariff rates across preference regimes by examining the choice between AJCEP and bilateral RTAs in Japan’s imports from Malaysia, Philippines, Singapore, Thailand, and Vietnam. As a result, they found that the change of preferential tariff rates in one RTA affects not only the utilization of that RTA but also the utilization of another RTA. In contrast, this study sheds light on the interaction across preference regimes through RoOs. In this sense, these studies are complementary. This study is the first to examine how the reform of RoOs in one preference regime affects the utilization of all available preference regimes.
Second, some studies examine the negative effects of RoOs on preference utilization. For example, Carrere and de Melo (2006) found that the negative effect of the regional value content rule on NAFTA utilization rates is larger than the negative effect of the change-in-chapter rule4. RoOs usually do not change over time; therefore, the identification strategy in
these studies relies mainly on the difference in RoOs across products. However, the type of
3 The data on trade values according to tariff regimes are also used when examining the allocation of saved preference margin between exporters and importers (Cadot et al., 2005; Olarreaga and Ozden, 2005; Ozden and Sharma, 2006; Cirera, 2014).
4 There are some empirical studies that evaluate the restrictiveness of RoOs by employing the index proposed in Estevadeordal (2000). See, for example, Cadot et al. (2006), Estevadeordal and Suominen (2004), and Hayakawa et al. (2014). Conconi et al. (2018) also examined the impacts of RoO on trade diversion in inputs.
5
RoOs tends to be determined based on some product characteristics. For example, RoOs for apparel products are likely to be the technical requirement rules (e.g., single/two-stage processing rules) due to their clear production processes. As a result, in the cross-product analysis, the difference in preference utilization across types of RoOs is likely to contain the difference in product characteristics. In contrast, this study exploits the time-series change of RoOs within the same product. Thus, our estimates will capture the more causal effects of RoOs, especially the effects of relaxing RoOs from the two-stage to the single-stage processing rule5.
In addition, more broadly, our paper belongs to the large body of literature on the evaluation of trade creation in the nonreciprocal preferential trade agreements (NRPTAs) including GSP. Recent examples include Frazer and Van Biesebroeck (2010), Aiello and Demaria (2010), Herz and Wagner (2011), Gil-Pareja et al. (2014), and Ito and Aoyagi (2019). Although the trade creation effect in the context of NRPTAs is still controversial in these existing studies, their analyses are based on data on total trade values rather than trade values under NRPTAs. Therefore, unlike our third step above, those studies cannot investigate the mechanism underlying the change of total trade values6. By using the data
on trade values by tariff regimes, we can uncover how the trade values under each tariff regime change behind the increase of total trade. There is a clear advantage in using such data when evaluating trade creation in preference regimes including the NRPTAs.
The rest of this paper is organized as follows. The next section introduces AJCEP and Japan’s GSP. In particular, we discuss some differences between the two tariff regimes. After presenting our empirical framework in Section 3, we report our estimation results on the effect of relaxing RoOs on preference utilization in Section 4. Section 5 concludes the paper.
2. Background
In this section, we introduce AJCEP and Japan’s GSP. The Japanese government announced Japan’s RTA strategy in October 20027, which states that RTAs offer a means of
strengthening partnerships in areas not covered by the World Trade Organization (WTO) and of achieving liberalization beyond levels attainable under the WTO. The RTA with Singapore, which came into force the following month (November 2002), was the first RTA
5 In this sense, our strategy is similar to that in Andersson (2016), Augier et al. (2015), Bombarda and Gamberoni (2013), Gasiorek et al. (2009), and Tanaka (2018). These studies investigate the trade effect of RoOs relaxation by examining the time-series change of cumulation base (i.e., from bilateral to diagonal cumulation) or of product-specific rules mainly in Europe. However, they investigate the change of total trade values rather than those imported under preference regimes. Therefore, those studies neither consider the choice among tariff regimes nor clarify how the trade under each regime changes.
6 In the context of NRPTAs, the data on trade values according to tariff regimes are employed by some studies (e.g., Francois et al., 2006; Hakobyan, 2015). However, those studies examine only the extent of NRPTA utilization rather than its trade creation effect.
6
for Japan. Following this, Japan concluded bilateral RTAs with many countries, mainly ASEAN countries, including Brunei, Malaysia, Thailand, Philippines, and Vietnam. Furthermore, to enhance the regional production/distribution networks developed by Japanese firms in ASEAN, Japan also concluded a plurilateral RTA with ASEAN as a whole (AJCEP), which came into force in 2008. The cumulation rule in the RoOs in AJCEP, which is discussed later in this section, is expected to enable Japanese multinational firms to trade parts and finished products without paying tariffs among ASEAN countries and Japan. On the other hand, Japan’s GSP has been available since 19718. Under its GSP regime,
Japan applies reduced tariffs to designated import products originating from developing countries/territories, aiming to help them increase export income, advance industrialization, and promote economic development. In particular, almost all products (98.1% of all tariff lines) originating from LDCs are given special preferential treatment. They are given duty- and quota-free market access. Among ASEAN, Cambodia, Laos, and Myanmar are beneficiaries of Japan’s GSP-LDC. Importantly, this GSP-LDC regime is available even if the beneficiaries conclude on RTAs with Japan. Therefore, exporters in Cambodia, Laos, and Myanmar are required to choose a tariff regime among GSP-LDC, AJCEP, and MFN. The RoOs for apparel products, which is the focus of this paper, are as follows. Until March 2015, the RoOs for knitted apparel had been two-stage processing in GSP-LDC such that both processes of “spinning” and “knitting” were required to receive preferential tariff treatment. Such a two-stage processing rule was also adopted for knitted apparel in AJCEP. However, in April 2015, the Japanese government relaxed RoOs in GSP-LDC to single-stage processing to further encourage LDCs to export knitted apparel. Thus, since then, RoOs in GSP-LDC have been less restrictive than those in AJCEP. On the other hand, in the case of woven apparel products, which require materials and production processes similar to that of knitted apparel products, RoOs have been single-stage processing in GSP-LDC and two-stage processing in AJCEP.
The revision of RoOs for knitted apparel in GSP-LDC in 2015 could be taken as an exogenous change for the three LDCs in ASEAN because one of the crucial triggers on this revision was the request by Bangladesh, which is one of the major exporters of apparel products to Japan. Mr. Shinzo Abe, Prime Minister of Japan, officially visited Bangladesh from September 6–7, 2014 on the invitation of Prime Minister Sheikh Hasina and, based on that request, “Prime Minister Abe expressed that relevant ministries started their further consideration of reviewing the existing rules of origin of Japanese GSP scheme for knitted articles (Chapter 61 of the HS)9.” Based on this statement, the Council on Customs, Tariff,
Foreign Exchange and Other Transactions in the Ministry of Finance proposed to relax RoOs
8 http://www.mofa.go.jp/policy/economy/gsp/explain.html 9 http://www.mofa.go.jp/mofaj/files/000050978.pdf
7
in HS 61 to single-stage processing on November 14, 201410. The three LDCs in ASEAN did
not play a significant role in these processes.
Although tariff rates have been already eliminated, i.e., zero, for all apparel products (including both knitted and woven apparel) under both GSP-LDC and AJCEP at least since 2013, there remain some differences between the two preference regimes. First, in the case of the GSP regime, to receive preferential tariff treatment, the goods to be imported have to be directly consigned to Japan in principle. In AJCEP, on the other hand, it is allowed for firms to store their export products in a bonded warehouse in a third country and to export to Japan under the AJCEP regime when orders are received from Japan. Second, cumulation among ASEAN countries (and Japan) is allowed in the compliance of RoOs only for AJCEP. Thus, if both production processes (i.e., processes of spinning and knitting) are conducted within ASEAN, the two-stage processing rule in AJCEP may not be restrictive in comparison to complying with the single-stage processing rule in GSP-LDC. On the other hand, materials produced in Japan can be allowed to be cumulated in not only AJCEP but also GSP-LDC11.
Practically, based on the difference in the cumulation base, the source of fabrics in the three LDCs is likely China, Japan, or Thailand. These LDCs cannot produce fabrics by themselves and, thus, need to import from other, mostly neighboring, countries. As mentioned above, because the two-stage processing rule in GSP-LDC requires fabrics to be produced in export countries or to use those produced in Japan, it is difficult to comply with the two-stage processing rule unless using fabrics produced in Japan. In the case of AJCEP, on the other hand, due to the above-mentioned cumulation rule12 , apparel products
produced in the LDCs can comply with the two-stage processing rule if firms use fabrics produced in Thailand and cumulate those to certify the origin of the apparel products. After the RoOs in GSP-LDC become single-stage processing, LDCs can enjoy preferential exports even if they use fabrics produced in China, which are cheaper than those produced in
10 In this proposition, the Council claimed that most of the domestic demand for knitted apparel is met by imported products. As is consistent with this claim, the import penetration ratio in knitted apparel, which is computed by using Japan’s Input–Output Table for 2011 (Ministry of Internal Affairs and Communications), shows approximately 80%.
11 More precisely, “cumulation rule” is a bit different between GSP and AJCEP. In GSP, it is called “donor country content rule,” which allows the use of imports from Japan. Importantly, such inputs do not need to be originated in Japan. Thus, it is practically possible to use the fabrics made in China when utilizing the GSP-LDC regime if those fabrics are first exported to Japan and then from Japan to the LDCs. However, when importing fabrics from China into Japan, firms have to pay customs duty in Japan’s customs. In addition, it costs more to transport from China to the LDCs via Japan than to directly transport from China to the LDCs.
12 Indeed, as shown in Hayakawa (2015), Thailand exports cotton (HS52) and man-made filaments (HS54) to the LDCs under AJCEP.
8
Thailand and Japan13. In short, depending on tariff regimes and RoOs, LDCs need to adapt
their source of materials14.
3. Empirical Framework
This section provides our empirical framework to examine how the reform of RoOs in one preference regime changes the utilization of all available preference regimes. We first specify our estimation equation and then overview Japan’s preferential imports.
3.1. Specification
We start by examining the preference utilization in Japan’s imports of only knitted apparel from Cambodia, Laos, and Myanmar from 2013 to 2016. In these imports, AJCEP and GSP-LDC regimes, in addition to the MFN regime, are available. From a theoretical point of view, various elements affect preference utilization. Demidova and Krishna (2008) and Cherkashin et al. (2015) demonstrate that a larger preference margin (i.e., MFN rates minus preferential tariff rates), less restrictive RoOs in terms of lower input adjustment costs, higher productivity, and lower fixed costs for preference utilization (e.g., documentation costs to certify the origin of goods) lead to the higher utilization of preference. The significant role of these basic elements has been empirically shown in previous studies on preference utilization rates. For example, Cadot et al. (2006) and Carrere and de Melo (2006) found the positive effect of preference margin and the negative effect of RoOs. Thus, in our case, the larger preference margin in the AJCEP (the GSP-LDC) will result in the higher utilization rate of the AJCEP regime (the GSP-LDC regime). The relaxation of RoOs in the GSP-LDC is also expected to have a positive effect on the utilization rate of the GSP-LDC.
Furthermore, Hayakawa et al. (Online Appendix, 2019) theoretically examine the determinants of preference utilization rates when multiple preference regimes are available. Suppose that exporters choose the best tariff regime, i.e., which yields the highest exporting profits, among all available regimes. In this case, for example, the reduction of preferential tariffs in a preference regime encourages the exporting firms using other regimes (including MFN regime) to switch to choose that preference regime. Such tariff reduction also increases exports by existing users of that preference regime. These effects on so-called “extensive
13 We discuss and show such differences in the material prices in Section 4.4.
14 According to the Survey of Japanese-affiliated firms in ASEAN, India, and Oceania conducted by Japan External Trade Organization (JETRO), among Japanese affiliates in apparel industry (including both knitted and woven apparel) who export from the three LDCs to Japan, the average procurement shares from Japan, the other ASEAN countries, and China are 20%, 30%, and 46% in 2013, respectively. Then, those shares, respectively, change to 25%, 12%, and 53% in 2016. These three sources account for more than 90% of total procurement value for apparel exporters in the three LDCs. In addition, the procurement share from the other ASEAN countries declines while that from China rises.
9
margin” and “intensive margin” result in raising the product-level share of imports under that preference regime and decreasing the shares of imports under the other regimes. In short, the utilization rate of a preference regime is affected by not only the own preference’s characteristics but also the other preferences’ characteristics. These mechanisms suggest that the relaxation of RoOs in GSP-LDC is expected to have positive and negative effects on the utilization rates of GSP-LDC and AJCEP regimes, respectively.
Based on these theoretical determinants, we specify our simple reduced-form model as follows:
𝑆ℎ𝑎𝑟𝑒𝑖𝑝𝑟𝑡 = 𝛼 × 𝐺𝑆𝑃𝑟× 𝑌𝑒𝑎𝑟2015𝑡+ u𝑖𝑝𝑟 + u𝑖𝑝𝑡+ 𝜖𝑖𝑝𝑟𝑡. (1) 𝑆ℎ𝑎𝑟𝑒𝑖𝑝𝑟𝑡 is the share of imports of knitted apparel product p from country i under preference regime r in year t out of total imports of product p from country i in year t15. The
denominator is the sum of imports under the MFN, AJCEP, and GSP-LDC regimes. Sample products are defined at an HS nine-digit level, Japan’s tariff-line level, and include the codes in the HS 61. The sample preference regimes include AJCEP and GSP-LDC. 𝑌𝑒𝑎𝑟2015𝑡 is the dummy variable taking the value of one if year t is either 2015 or 2016 and zero otherwise. 𝐺𝑆𝑃𝑟 takes the value of one if regime r is GSP-LDC and zero if it is AJCEP. u𝑖𝑝𝑟 and u𝑖𝑝𝑡 are country-product-regime and country-product-year fixed effects, respectively. Last, 𝜖𝑖𝑝𝑟𝑡 is a disturbance term.
We introduce all possible combinations of fixed effects, taking as given that our main variable, i.e., an interaction term, has a regime-year dimension. These fixed effects control various elements discussed above. Preferential tariff rates in both AJCEP and GSP-LDC are zero in all knitted apparel products, thus, the preference margins of both preference regimes with the MFN regime are exactly the same as the level of MFN tariff rates, which is controlled by product-related fixed effects16. We exclude products with zero MFN rates, i.e.,
zero-preference margin, from our sample products (only four products). The productivity distribution and fixed costs for preference utilization in each exporting country are controlled by country-product-year fixed effects. The effects of RoOs are discussed below. As mentioned in the previous section, the two preference regimes are different regarding direct consignment and cumulation. Importantly, these regime-specific characteristics do not change over time, at least in our sample. Therefore, no other regime-specific time-variant characteristics will affect the preference utilization rates (i.e., no confounding factors in our model). The time-invariant regime-specific characteristics are controlled by country-product-regime fixed effects17.
15 The observations in which the denominator of the dependent variable is zero are excluded from our estimation sample. The denominator is country-product-year specific; therefore, the selection mechanism here is controlled by our inclusion of country-product-year fixed effects. The observations with a zero-valued numerator are included in our estimation sample.
16 MFN rates in all products do not change over time during our sample period. Even if those change, our product-year fixed effects completely control for MFN rates.
10
By controlling for these elements by our fixed effects, we capture the effects of relaxing RoOs by the coefficient for the interaction term 𝑌𝑒𝑎𝑟2015𝑡× 𝐺𝑆𝑃𝑟. Under the AJCEP regime, RoOs do not change over time in our sample. The effects of time-invariant RoOs are controlled by product-regime-related fixed effects; therefore, the coefficient for the interaction term indicates the effect of RoO relaxation from two-stage processing to single-stage processing on preference utilization. Such relaxation of RoOs will have positive and negative effects on the utilization of GSP-LDC and AJCEP, respectively. Thus, our estimates from the sample pooling imports under the two preference regimes show the relative magnitude of these contrasting effects within a product. In this sense, our empirical framework is not the same as the standard DID method. Nevertheless, the interaction term
per se can be taken as an exogenous variable for exporters in the three LDCs because
Bangladesh, not the three LDCs, was a key player in this revision of RoOs as mentioned in the previous section. In short, our estimates show the relative magnitude of the effects but should be econometrically consistent. Later, we also investigate the absolute effect by adding imports of woven apparel products (HS62) in our estimation.
3.2. Data Overview
The source of the product-level data on imports by tariff regimes is the Trade Statistics from Japan’s Ministry of Finance. These data cover all commodity imports for Japan. We aggregate our import data according to Japanese fiscal years (from the beginning of April to the end of March) because the above reform of RoOs in knitted apparel started on April 1, 2015. In Japan’s tariff system, tariff-line codes in a small number of products change even during the period of the same HS version (i.e., HS 2012 in our case). Specifically, new numbers are created when some tariff-line-level codes are integrated or are differentiated within the same HS six-digit code. By using the converter of tariff-line codes presented by the Japan Tariff Association18, we create nine-digit codes common across years, which are
used to define product-related fixed effects. As a result, the HS 61 includes 263 tariff-line codes. The average, median, minimum, and maximum values of MFN rates are, respectively, 9.2%, 8.4%, 5%, and 10.9%.
fixed effects will contribute to controlling for NTBs in Japan. Hakobyan (2015) also introduced the share of local content values added for the production of exporting products when examining the utilization rates of GSP in the U.S. This variable plays a good role in examining the effects of RoOs in her context because the RoOs for all products are the regional value content rule in the U.S. GSP. On the other hand, specific process rules are set to our sample products. Thus, use of the local content share is not appropriate in our context. In addition, Francois et al. (2006) and Manchin (2006) introduce some gravity variables such as GDP, population size, distance, or the past colonial relationship. In our empirical model, these elements are controlled by country-product-related fixed effects.
11
Figure 1. Imports from the Three LDCs (Left Axis) and Their Shares in Imports from the World (Right Axis)
Source: Author’s compilation using Trade Statistics from Japan’s Ministry of Finance.
Note: “Woven or Knitted imports from LDC3” refers to the total import values of woven or knitted apparel from Cambodia, Laos, and Myanmar. The values are rescaled to be the value of one as of 2013. “Share of LDC3 in Woven or Knitted” is the share of imports from those three countries out of total imports of woven or knitted apparel from the world.
Before showing our estimation results, we take an overview of Japan’s imports of apparel products. Figure 1 shows the total import values of woven or knitted apparel from the three LDCs (Woven or Knitted imports from LDC3). This figure comprises all apparel products including those with zero MFN rates. The values are rescaled to be the value of one as of 2013. The import values from the three LDCs experience a steady increase in both knitted and woven apparels. In particular, their increase in knitted apparel in 2015 looks remarkable. The imports of knitted apparel in 2015 become nearly three times larger than those in 2013. The share of these imports from the three countries out of total imports from the world is also shown in the figure (Share of LDC3 in Woven or Knitted). The share in knitted apparel rises by three percentage points, from 1% in 2013 to 4% in 2016. Thus, during this period, the presence of these three LDCs in Japan’s market for knitted apparel increases, but it is still very low. On the other hand, the share in woven apparel is higher than that in
0 0.01 0.02 0.03 0.04 0.05 0.06 0.07 0.08 0.09 0 0.5 1 1.5 2 2.5 3 3.5 4 2013 2014 2015 2016
Woven imports from LDC3 Knitted imports from LDC3
Share of LDC3 in Woven imports
Share of LDC3 in Knitted imports
12
knitted apparel and rises from near 5% in 2013 to near 8% in 2016. In both, therefore, the share of Japan’s imports from the three LDCs is still not relevant.
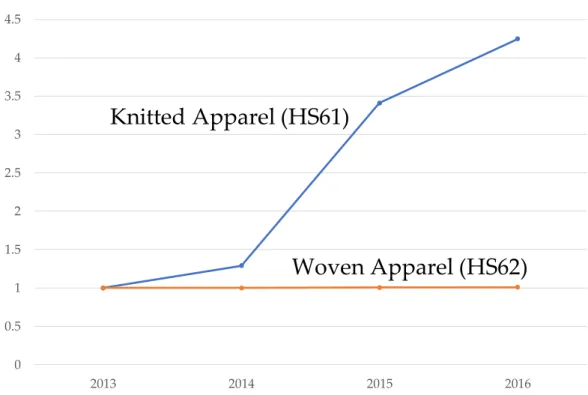
Next, we overview the preferential imports of apparel products from the three LDCs. Figure 2 depicts the evolution of the share of GSP-LDC imports from the three countries out of total imports from those countries. In this figure, we do not include apparel products with zero MFN rates19. We aggregate into imports of knitted apparel (HS61) and woven apparel
(HS62) separately and rescale each share to be the value of one as of 2013. It is found that the share of GSP-LDC imports in knitted apparel dramatically rises from 2015, which is the year when RoOs were relaxed to single-stage processing. On the other hand, the share in woven apparel remains almost constant during the whole period. The case of AJCEP imports is shown in Figure 3. From 2015, the shares sharply decline in both knitted and woven apparel; however, the decline in knitted apparel is more remarkable. Thus, these two figures indicate the contrasting trend in knitted apparel imports between two preference regimes; in other words, compared with woven apparel, the share of GSP-LDC imports in knitted apparel increases while that of AJCEP in knitted apparel imports decreases20.
Figure 2. Share of GSP-LDC Imports in Total Imports
Source: Author’s compilation using Trade Statistics from Japan’s Ministry of Finance. Note: Each share is rescaled to be the value of one as of 2013.
19 As mentioned above, in our sample, MFN rates do not change over time.
20 These similar trends before 2015 may indicate the validity of the "parallel trend assumption" in our analysis. 0 0.5 1 1.5 2 2.5 3 3.5 4 4.5 2013 2014 2015 2016
Knitted Apparel (HS61)
Woven Apparel (HS62)
13 Figure 3. Share of AJCEP Imports in Total Imports
Source: Author’s compilation using Trade Statistics from Japan’s Ministry of Finance. Note: Each share is rescaled to be the value of one as of 2013.
The above shares are shown by export countries in Table 2. There are four noteworthy points. First, we can see the similar time-trend as in Figures 2 and 3, that is, the share of GSP-LDC imports in knitted apparel remarkably increases while that of AJCEP imports decreases. Second, except for a few cases, the sum of import shares under two preferences is near the value of one. This implies that most of the imports are conducted under either AJCEP or GSP-LDC rather than under the MFN regime. Third, while most of the imports in woven apparel are done under GSP-LDC, the share of AJCEP imports in knitted apparel is higher than that of GSP-LDC particularly before the RoO reform, i.e., 2015. Especially in Laos, even after the reform, the share of AJCEP imports is still higher than that of GSP-LDC. The rather high share of GSP-LDC imports in woven apparel would be because of the less restrictive RoOs in GSP-LDC (RoOs in GSP-LDC and AJCEP are single-stage processing and two-stage processing rules, respectively).
4. Empirical Results
This section reports our estimation results. We first estimate Eq. (1) and then conduct some robustness checks. Next, by modifying our model, we show the absolute effects on two preference regimes separately. We also investigate the impacts on the level of import values under each regime. Last, we examine the change of import prices to investigate the possible change of the materials through the relaxation of RoOs.
0 0.2 0.4 0.6 0.8 1 1.2 1.4 2013 2014 2015 2016
Knitted Apparel (HS61)
Woven Apparel (HS62)
14
Table 2. Shares of Preferential Imports in Total Imports
Exporter Year AJCEP GSP-LDC AJCEP GSP-LDC
Cambodia 2013 0.35 0.22 0.02 0.94 2014 0.41 0.28 0.02 0.95 2015 0.23 0.66 0.02 0.96 2016 0.07 0.86 0.01 0.96 Laos 2013 0.87 0.00 0.05 0.94 2014 0.89 0.05 0.01 0.97 2015 0.81 0.16 0.01 0.98 2016 0.91 0.06 0.02 0.98 Myanmar 2013 0.38 0.15 0.01 0.98 2014 0.51 0.20 0.01 0.98 2015 0.17 0.82 0.01 0.99 2016 0.09 0.89 0.01 0.98
Knitted Apparel Woven Apparel
Source: Author’s computation using Trade Statistics from Japan’s Ministry of Finance.
4.1. Relative Impacts on Shares
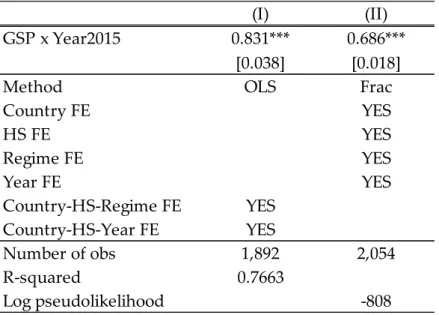
Column (I) in Table 3 reports our estimation result for Eq. (1)21. Our dependent variable
lies in the unit interval; therefore, the ideal method for estimation is the fractional logit estimation technique proposed by Papke and Wooldridge (1996). However, as discussed in the previous section, we need to introduce many kinds of fixed effects, which makes us difficult to obtain the convergence of log-likelihood when we estimate by fractional logit models. Also, there is an interpretation issue of the interaction term in the non-linear models (Puhani, 2012). Therefore, we first estimate Eq. (1) by the ordinary least square (OLS) method. The coefficient for an interaction term is estimated to be significantly positive, indicating that the relaxation of RoOs in the GSP-LDC regime increases the GSP-LDC utilization rate relative to the AJCEP utilization rate as is consistent with our expectation. In column (II), as a robustness check for our result in column (I), we estimate our model by the fractional logit model (Frac). Indeed, the result by OLS in column (I) shows a very large effect, which is the expansion of the share of GSP-LDC imports by 83 percentage points relative to the share of AJCEP imports. One reason for this large effect might be our
21 Originally, our dataset included 263 dutiable knitted apparel products, three countries, and four years. Thus, the total number of observations was expected to be 3,156 (= 263 x 3 x 4). However, country-product-year pairs were dropped if they had zero-valued denominators in the dependent variable. Depending on the estimation method and set of fixed effects, singleton observations were also dropped.
15
use of OLS techniques for our model, in which the dependent variable lies in the unit interval. On the other hand, as mentioned above, we cannot control for all fixed effects included in Eq. (1) when employing the non-linear estimation techniques. Therefore, in column (II), we control for the only export country, product, tariff regime, and year fixed effects and then estimate by the fractional logit model. The coefficient for the interaction term is again estimated to be significantly positive. The absolute magnitude of the coefficient decreases and indicates the expansion of the share by 69 percentage points.
Table 3. Estimation Results for Knitted Apparel
(I) (II)
GSP x Year2015 0.831*** 0.686***
[0.038] [0.018]
Method OLS Frac
Country FE YES HS FE YES Regime FE YES Year FE YES Country-HS-Regime FE YES Country-HS-Year FE YES Number of obs 1,892 2,054 R-squared 0.7663 Log pseudolikelihood -808
Notes: ***, **, and * represent significance at the 1%, 5%, and 10% statistical levels, respectively. Parentheses contain the standard error clustered at the country-HS-regime level. The dependent variable is the share of imports of product p from country i under preference regime r in year t out of total imports of product p from country i in year t. Sample countries include Cambodia, Laos, and Myanmar, products do HS nine-digit codes in the HS 61, and years do from 2013 to 2016. The preference regimes include AJCEP and GSP-LDC. In columns (I) and (II), we estimate our model by OLS and the fractional logit model (Frac), respectively.
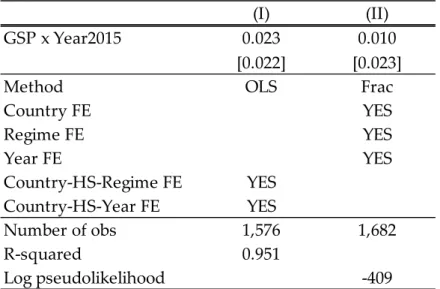
We also check if our results are not driven by any other shocks to the GSP-LDC regime after 2014. Specifically, we estimate Eq. (1) for the shares of imports of woven apparel products (HS62). This analysis might be called a “placebo test”; that is, if RoOs in GSP-LDC for woven apparel do not change during our sample period and the change of RoOs for knitted apparel is expected to have no effects on imports of woven apparel, then we should have an insignificant coefficient for the interaction term. The results are reported in Table 4. The HS 62 includes 192 tariff-line codes. Again, we also estimate by the fractional logit
16
technique by replacing the fixed effects22 . Both columns in the table show insignificant
coefficients for the interaction term as is consistent with our expectation23.
Table 4. Estimation Results for Woven Apparel
(I) (II)
GSP x Year2015 0.023 0.010
[0.022] [0.023]
Method OLS Frac
Country FE YES Regime FE YES Year FE YES Country-HS-Regime FE YES Country-HS-Year FE YES Number of obs 1,576 1,682 R-squared 0.951 Log pseudolikelihood -409
Notes: ***, **, and * represent significance at the 1%, 5%, and 10% statistical levels, respectively. Parentheses contain the standard error clustered at the country-HS-regime level. The dependent variable is the share of imports of product p from country i under preference regime r in year t out of total imports of product p from country i in year t. Sample countries include Cambodia, Laos, and Myanmar, products do HS nine-digit codes only in HS62, and years do from 2013 to 2016. The preference regimes include AJCEP and GSP-LDC. In columns (I) and (II), we estimate our model by OLS and the fractional logit model (Frac), respectively.
4.2. Absolute Impacts on Shares
In this subsection, we investigate the absolute effects on preference utilization rates. As discussed in the previous section, the relaxation of RoOs in GSP-LDC is expected to have positive and negative effects on the utilization rates of GSP-LDC and AJCEP, respectively. Therefore, our estimates above show the net effect of these two contrasting effects. To investigate these two effects separately, we add the utilization rates in woven apparel to our
22 We do not introduce product fixed effects in this estimation due to less variation across woven apparel products.
23 We also investigated the heterogeneous effects of RoOs relaxation across export countries by further interacting export country fixed effects with the interaction term in Eq. (1). The results reported in Table B1 in Appendix B indicate that the positive effect is largest in exporting from Myanmar and least in exporting from Laos. Although we do not have any more statistical evidence to interpret these results, the case study by the JETRO reports that when the RoOs for knitted apparel were revised, apparel companies in Myanmar started to actively invest in the facility to produce knitted apparel and import more fabrics from China. These active adjustments to export under the single-stage processing rule may result in the relatively large effects found above.
17
estimation sample and then estimate the following model for imports under GSP-LDC and AJCEP separately:
𝑆ℎ𝑎𝑟𝑒𝑖𝑝𝑡 = 𝛼 × 𝐻𝑆61𝑝× 𝑌𝑒𝑎𝑟2015𝑡+ 𝛽 ln 𝐼𝑚𝑝𝑜𝑟𝑡𝑠𝑝𝑡+ u𝑖𝑝+ u𝑖𝑡+ 𝜖𝑖𝑝𝑡. (2) 𝐻𝑆61𝑝 is a dummy variable taking the value of one for knitted apparel products (i.e., HS61) and zero for woven apparel products (i.e., HS62); hence, by taking the utilization rates for woven apparel as a comparison group, we examine how the utilization rates of each preference regime for knitted apparel change after 2014. In this model, we cannot control for product-year fixed effects because our interaction term has the same dimension. Thus, as one product-year characteristic, we control for Japan’s total imports of product p in year
t from the world, which can be taken as a proxy for Japan’s demand size for a concerned
product24.
Our analysis above can be taken as a DID. The crucial assumption in this analysis, which is known as the stable unit treatment value assumption, is that the relaxation of RoOs in knitted apparel does not have any influence on preference utilization in woven apparel. Indeed, in Table 4, we found that RoO relaxation in knitted apparel does not significantly affect the relative use of either preference regime in woven apparel. Nevertheless, in both supply and demand sides, there will be some possible sources that have an influence on at least total imports of woven apparel. In the supply side, if there is some resource constraint in exporting countries, then the original producers of woven apparel may switch to producing and exporting knitted apparel. In the demand side, if knitted and woven apparel are substitutable for consumers, then the import increase of the former may decrease the imports of the latter. If knitted and woven apparel are substitutable in terms of supply and demand, then the import increase of knitted apparel leads to the import decrease of woven apparel. However, our simple correlation analysis does not show the alternative relationship between the total exports (imports) of knitted apparel and woven apparel25.
The estimation results for Eq. (2) are reported in Table 5. As in the previous table, we estimate by the OLS and the fractional logit26. The sample tariff regime is restricted to the
GSP-LDC in column LDC” and to the AJCEP in column “AJCEP.” In column “GSP-LDC,” on the one hand, we can see that the share of GSP-LDC imports significantly rises by 32–57 percentage points. Unlike the result in Table 3, this rise is taken as an absolute effect of RoO relaxation on utilization rates in GSP-LDC regime. On the other hand, column "AJCEP"
24 As mentioned in the previous section, MFN rates do not change over time in our sample and, thus, are controlled by country-product fixed effects.
25 Specifically, we examined for trade by more than 200 countries in the world, the correlation between total exports (imports) of knitted and woven products. As a result, we found that a 1% rise in total exports (imports) of woven apparel is associated with the increase in total exports (imports) of knitted apparel by 1.0%. Their trade patterns are not alternative. Such relationship is also found in exporting from the three LDCs. The results are reported in Table B2 in Appendix B.
26 Alternatively, we may estimate the models in columns (I) and (III) simultaneously by using the seemingly unrelated regression (SUR) model. The results are the same in terms of coefficient magnitude and statistical significance as those in columns (I) and (III).
18
shows the significant decline in the share of AJCEP imports by 12–20 percentage points. In short, the relaxation of RoOs in GSP-LDC regime raises the share of GSP-LDC imports but decreases that of AJCEP imports. Conceptually, the sum of the absolute magnitude of these coefficients in GSP-LDC and AJCEP becomes the net effect shown in the coefficient for the interaction term in Table 3, though the magnitude does not become exactly same because the estimation model (i.e., a set of explanatory variables) is different.
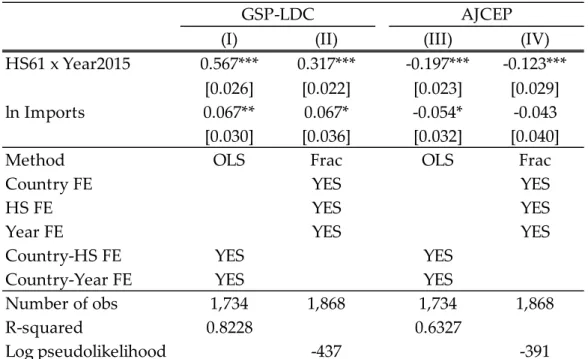
Table 5. Separate Estimation Results for GSP-LDC and AJCEP
(I) (II) (III) (IV)
HS61 x Year2015 0.567*** 0.317*** -0.197*** -0.123***
[0.026] [0.022] [0.023] [0.029]
ln Imports 0.067** 0.067* -0.054* -0.043
[0.030] [0.036] [0.032] [0.040]
Method OLS Frac OLS Frac
Country FE YES YES
HS FE YES YES
Year FE YES YES
Country-HS FE YES YES
Country-Year FE YES YES
Number of obs 1,734 1,868 1,734 1,868
R-squared 0.8228 0.6327
Log pseudolikelihood -437 -391
GSP-LDC AJCEP
Notes: ***, **, and * represent significance at the 1%, 5%, and 10% statistical levels, respectively. Parentheses contain the standard error clustered at the country-HS level. The dependent variable is the share of imports of product p from country i under preference regime r in year t out of total imports of product p from country i in year t. Sample countries include Cambodia, Laos, and Myanmar, products do HS nine-digit codes in HS 61 and HS62, and years do from 2013 to 2016. The preference regimes include only AJCEP in column “AJCEP” and only GSP-LDC in column “GSP-LDC.” In columns (I) and (III), we estimate our model by OLS while the fractional logit model (Frac) is used in columns (II) and (IV).
There are two other noteworthy results. One is that the absolute magnitude is larger in GSP-LDC than in AJCEP. This result implies the existence of new exporters under the GSP-LDC regime who used neither GSP-LDC nor AJCEP before, in addition to the increase in exports by existing GSP-LDC users. Such new exporters under GSP-LDC regime will be either firms who start exporting or those who switch from the MFN to the GSP-LDC regime. In the next subsection, we further investigate what is the main driver of this result. The other
19
result is that the coefficients for total imports are positive in GSP-LDC and negative in AJCEP, though the coefficient is insignificant in column (IV). This contrasting result indicates that the GSP-LDC regime is likely to be chosen rather than the AJCEP regime for products with a larger demand size in Japan27.
4.3. Absolute Impacts on Levels
Next, we estimate Eq. (2) by replacing the dependent variable with the level of import values. As mentioned just above, our results in Table 5 can be driven by the increase of preferential exports by existing GSP-LDC users, firms switching from AJCEP or MFN to GSP-LDC, or their starting exporting. Indeed, even if imports under the AJCEP regime do not change at all, the increase in imports under the GSP-LDC regime not only raises the share of GSP-LDC imports but also decreases the share of AJCEP imports. To further investigate the sources of our results in Table 5, we replace the dependent variable in Eq. (2) with the level of imports under each regime28 . The results are reported in Table 6. Not only
preferential imports but also imports under MFN regime are also investigated. In columns (I), (III), and (V), we use a log of (one-plus) import values under GSP-LDC, AJCEP, or MFN as a dependent variable and estimate by using OLS.29 In columns (II), (IV), and (VI), on the
other hand, we estimate for import values (without adding the value one) by the Poisson pseudo-maximum likelihood (PPML) estimation technique. Unlike the previous analyses, we also include country-product-year pairs in which any imports, regardless of tariff regime, are not observed, i.e., pairs with zero-valued denominators in the dependent variable in Eq. (2)30.
The results are as follows31. Imports under the GSP-LDC regime significantly increase
after the revision of RoOs. In the case of imports under AJCEP, the OLS result shows a
27 In Table 6, we estimate our model for imports under GSP-LDC and AJCEP separately. In Table B3 in Appendix B, we pool both kinds of imports and estimate the model with 𝐻𝑆61𝑝× 𝑌𝑒𝑎𝑟2015𝑡× 𝐺𝑆𝑃𝑟 and 𝐻𝑆61𝑝× 𝑌𝑒𝑎𝑟2015𝑡× 𝐴𝐽𝐶𝐸𝑃𝑟, where 𝐴𝐽𝐶𝐸𝑃𝑟 is a dummy variable taking the value of one if regime r is AJCEP and zero if it is GSP-LDC. The results are qualitatively unchanged with those in Table 6. We also estimate these models by excluding woven apparel products of which the RoOs for GSP-LDC are the two-stage processing rule. The results are again unchanged and are reported in Table B4 in Appendix B.
28 In the analysis in Table 3, the difference between the use of levels and that of shares in our dependent variable does not matter because we control for country-product-year fixed effects.
29 In Table B5 in Appendix B, we also estimate the model without adding the value one. This estimation drastically reduces the number of observations by dropping the zero-valued imports but yields similar results.
30 In Tables B7 and B8 in Appendix B, we also estimate the model by excluding those pairs. The sign and significance of the coefficients are not changed from those reported in Table 6.
31 We also estimate the model by pooling preferential imports under AJCEP and GSP-LDC (see footnote 27). The results are reported in Table B3 in Appendix B and are qualitatively unchanged from those in Table 6. In addition, we estimate these models by excluding woven apparel products of which the RoOs
20
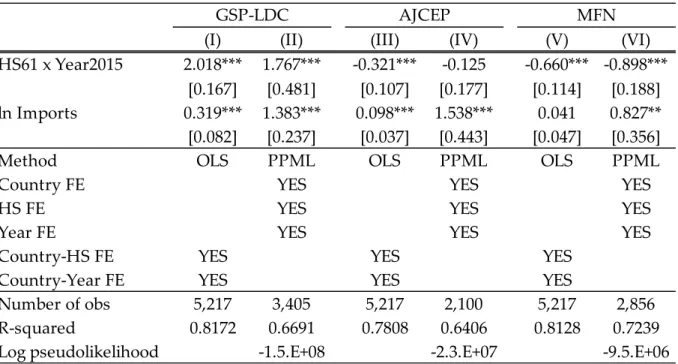
significantly negative coefficient for the interaction term while it is insignificant in the PPML result. In either case, the absolute magnitude of the coefficients is much smaller than that in the case of LDC. These results indicate that firm switching from the AJCEP to the GSP-LDC regime is not the main force of the contrasting results between the shares of GSP-GSP-LDC imports and AJCEP imports found in Table 5. In other words, the decrease in the share of AJCEP imports found in Table 5 is driven mainly by the increase of GSP-LDC imports rather than by the decrease of AJCEP imports. This insignificant result in AJCEP would be because AJCEP users already adjust their production structure to meet the RoOs in AJCEP (i.e., two-stage processing) and do not need to switch to other preference regimes. This result may indicate the existence of some inertia in the utilization of preference regimes through the compliance of RoOs. In addition, the imports under MFN regimes significantly decrease. This result implies that switching from the MFN to the GSP-LDC regime is one of the main drivers.
Table 6. Estimation Results: Impacts on Trade Values by Tariff Regimes
(I) (II) (III) (IV) (V) (VI)
HS61 x Year2015 2.018*** 1.767*** -0.321*** -0.125 -0.660*** -0.898***
[0.167] [0.481] [0.107] [0.177] [0.114] [0.188]
ln Imports 0.319*** 1.383*** 0.098*** 1.538*** 0.041 0.827**
[0.082] [0.237] [0.037] [0.443] [0.047] [0.356]
Method OLS PPML OLS PPML OLS PPML
Country FE YES YES YES
HS FE YES YES YES
Year FE YES YES YES
Country-HS FE YES YES YES
Country-Year FE YES YES YES
Number of obs 5,217 3,405 5,217 2,100 5,217 2,856
R-squared 0.8172 0.6691 0.7808 0.6406 0.8128 0.7239
Log pseudolikelihood -1.5.E+08 -2.3.E+07 -9.5.E+06
GSP-LDC AJCEP MFN
Notes: ***, **, and * represent significance at the 1%, 5%, and 10% statistical levels, respectively. Parentheses contain the standard error clustered at the country-HS level. The dependent variable is a log of one-plus imports of product p from country i in year t in columns (I), (III), and (V), i.e., the case of OLS estimation. It is simply imports of product p from country i in year t, in columns (II), (IV), and (VI), i.e., PPML estimation. Sample countries include Cambodia, Laos, and Myanmar, products do HS nine-digit codes in HS 61 and HS62, and years do from 2013 to 2016. In columns (I), (III), and (V), we estimate our model by OLS while the fractional logit model (Frac) is used in columns (II), (IV), and (VI).
for GSP-LDC are the two-stage processing rule. The results are again unchanged and are reported in Tables B6 and B7 in Appendix B.
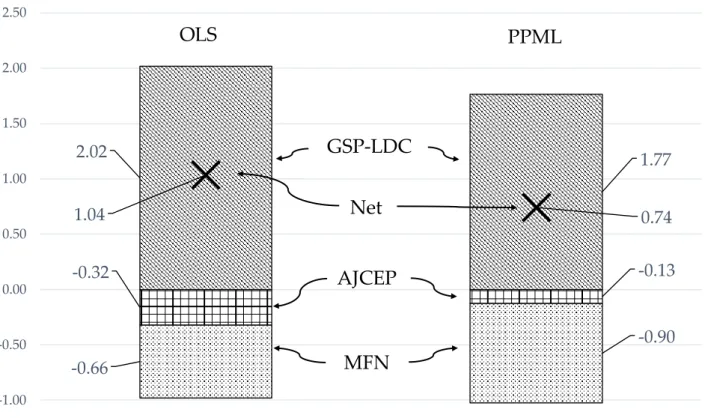
21 Figure 4. Total Impacts on Import Values
Source: Table 5.
Note: These cumulative bar charts show the magnitude of the coefficients for 𝐻𝑆61𝑝× 𝑌𝑒𝑎𝑟2015𝑡 obtained in Table 5. The cases of OLS and PPML are separately provided. The sum of the coefficients in GSP-LDC, AJCEP, and MFN is shown as the net effect on total imports (Net).
These magnitude relations are graphically presented in Figure 4, which simply shows the magnitude of each coefficient obtained in Table 6 by cumulative bar charts. The cases of OLS and PPML are separately provided. The sum of coefficients in GSP-LDC, AJCEP, and MFN is shown as the net effect on total imports (“Net”), and it suggests the increase in total imports by 182% in OLS and 110% in PPML. Among this increase, the contribution by the decrease of MFN imports is larger than that by the decrease of AJCEP imports. This implies that switching from the MFN to the GSP-LDC regime is more relevant than their switching from AJCEP. Before the relaxation of RoOs, many exporters under the MFN regime were not able to comply with the two-stage processing rule, perhaps, because of the use of imported fabrics, e.g., those from China. However, they can comply with RoOs (even in the use of imported fabrics) after their relaxation and change their tariff regime from MFN to GSP-LDC to enjoy duty-free exports. Furthermore, the sum of these two decreases is still not enough to create the increase of GSP-LDC imports shown in the figure. Other possible
2.02 1.77 -0.32 -0.13 -0.66 -0.90 1.04 0.74 -1.50 -1.00 -0.50 0.00 0.50 1.00 1.50 2.00 2.50 GSP-LDC AJCEP MFN OLS PPML Net
22
drivers will include the increase in exports from existing GSP-LDC users32 and the start of
export under the GSP-LDC regime33.
4.4. Price Changes
In this section, we examine the change in import prices after the relaxation of RoOs. As mentioned in the previous section, the three LDCs tend to import fabrics from China, Japan, or Thailand, depending on RoOs. Particularly in the GSP-LDC regime, those are, respectively, imported from Japan and China under the two-stage and single-stage processing rules, whereas these LDCs import from Thailand under the two-stage processing rule in AJCEP. We expect that the main source of the fabrics in exporting knitted apparel under GSP-LDC changes from Japan to China after the relaxation of RoOs. Obviously, this change lowers material costs and, thus, the export price of knitted apparel because fabrics made in Japan are much more expensive than those from China. Indeed, during our sample period, the import prices of knitted or crocheted fabrics in these LDCs from Japan were 33% higher than those from China34.
To investigate if the import prices of knitted apparel decrease after the relaxation of RoOs, we estimate the following simple equation35:
ln 𝑃𝑟𝑖𝑐𝑒𝑖𝑝𝑟𝑡 = 𝛼 × 𝐺𝑆𝑃𝑟× 𝑌𝑒𝑎𝑟2015𝑡+ u𝑖𝑝𝑟 + u𝑖𝑝𝑡+ 𝜖𝑖𝑝𝑟𝑡. (3) 𝑃𝑟𝑖𝑐𝑒𝑖𝑝𝑟𝑡 is the unit import price of tariff line p from country i under preference regime r in year t. Our sample design is the same as in Equation (1) in Section 4.1; the sample products are restricted to knitted apparel products, i.e., HS 61. The sample preference regimes include AJCEP and GSP-LDC. With this model, we compare the price change in the imports of knitted apparel under GSP-LDC with that for imports under AJCEP. In the latter imports, the three LDCs will use fabrics mainly from Thailand and will not change their sources during the sample period because RoOs do not change in AJCEP. In the former imports, as mentioned above, the change of the main sources from Japan to China will decrease import prices. In short, we expect a negative sign in the coefficient for the interaction term, i.e., 𝛼. The estimation results by OLS are reported in column “Knitted” in Table 7. As is consistent with our expectation, the coefficient for the interaction term is estimated to be significantly negative, indicating the decrease of import prices by 19%. This decrease is
32 For example, if existing GSP-LDC users change their materials to the cheaper ones through the relaxation of RoOs, then their exports will increase due to the reduction of variable costs.
33 We also introduce the interaction term with a log of one-plus MFN rates in order to investigate if the absolute effects of relaxing RoOs are larger in the products with the larger preference margin. The results are reported in Table B9 in Appendix B. However, we did not find clear results.
34 Table B10 in Appendix B also shows that import prices of knitted or crocheted fabrics in these LDCs from Thailand are 29% higher than those from China.
35 We do not examine the change of imports of fabrics in the three LDCs because those imports are affected by policy changes in not only Japan but also other countries.
23
attributed to a switch to cheaper production materials, i.e., fabrics from China, through the relaxation of RoOs. Notice that if the import prices of knitted apparel under AJCEP are forced to be lowered by the fiercer competition with reduced import prices under GSP-LDC in Japan’s market, then our estimates will be underestimated but not be overestimated. As in Section 4.1, we estimate this model for woven apparel products only. Because RoOs do not change in HS 62, we will not see a significant change of import prices in the woven apparel products. The results are reported in the column “Woven” and show the insignificant coefficient for the interaction term as expected.
Table 7. Estimation Results for Import Prices: GSP-LDC versus AJCEP
Knitted Woven
GSP x Year2015 -0.205** -0.015
[0.098] [0.091]
Number of obs 588 272
R-squared 0.8532 0.8451
Notes: The dependent variable is the unit price of imports of product p from country i under regime r in year t. ** represents significance at the 5% statistical level. Parentheses contain the heteroscedasticity-consistent standard error. Sample countries include Cambodia, Laos, and Myanmar, products do HS nine-digit codes in the HS 61 in column “Knitted” and those in the HS 62 in column “Woven,” and years do from 2013 to 2016. The preference regimes include AJCEP and GSP-LDC. In both specifications, we control for country-HS-regime and country-HS-year fixed effects. We estimate these models by OLS.
5. Concluding Remarks
This study examined Japan’s preferential imports of apparel products from three LDCs, i.e., Cambodia, Laos, and Myanmar, during the period 2013–2016. In these trade flows, two preference regimes were available in addition to an MFN regime, including GSP-LDC and AJCEP. In particular, we focused on the effect of relaxing RoOs in GSP-GSP-LDC for knitted apparel in 2015. As a result, we found that such relaxation not only significantly increased the share of GSP-LDC imports out of total imports but also resulted in reducing the share of AJCEP imports significantly. Furthermore, it was also found that such contrasting effects are not driven by firms switching their utilization across preference regimes but rather because the existing preference users keep using their original preference regimes. Last, we found evidence that the relaxation of RoOs induced the three LDCs to change the import source of the materials to produce the apparel products.
There are some implications from our findings. First, connecting with the findings in Hayakawa et al. (2019), we revealed the interaction among tariff regimes through two key
24
elements in preference regimes, i.e., tariff rates and RoOs. Changes to the elements in one tariff regime potentially affect the utilization of all available regimes. Second, from the viewpoint of trade creation effects, we showed that the relaxation of RoOs in one preference regime increased the level of total trade between member countries. Although trade values under the other regimes decrease, the increase of those under the preference regime in which RoOs are relaxed is much larger in terms of absolute values. Third, our finding on the inertia in the choice of preference regimes implies that the timing of preference regimes’ entry into force persistently affects their utilization rates. The choice of preference regimes has a significant effect on trade with a third country through RoOs as shown in Conconi et al. (2018); thus, its timing plays a key role in shaping a country’s trade with the world.
25
References
Aiello, F. and Demaria, F., 2010, Do Trade Preferential Agreements Enhance the Exports of
Developing Countries? Evidence from the Eu Gsp, Working Papers 201002, Università della Calabria, Dipartimento di Economia, Statistica e Finanza “Giovanni Anania” - DESF.
Andersson, A., 2016, Export Performance and Access to Intermediate Inputs: The Case of
Rules of Origin Liberalisation, The World Economy, 39(8): 1048-1079.
Augier, P., Gasiorek, M., and Tong, C.L., 2005, The Impact of Rules of Origin on Trade
Flows, Economic Policy, 20(43): 567–624.
Bombarda, P. and Gamberoni, E., 2013, Firm Heterogeneity, Rules of Origin, and Rules of
Cumulation, International Economic Review, 54(1): 307-328.
Bureau, J., Chakir, R., and Gallezot, J., 2007, The Utilisation of Trade Preferences for
Developing Countries in the Agri-food Sector, Journal of Agricultural Economics, 58(2): 175-198.
Cadot, O., Carrere, C., De Melo, J., Portugal-Perez, A., 2005, Market Access and Welfare
under Free Trade Agreements: Textiles under NAFTA, World Bank Economic Review, 19(3): 379-405.
Cadot, O., Carrere, C., De Melo, J., and Tumurchudur, B., 2006, Product-specific Rules of
Origin in EU and US Preferential Trading Arrangements: An Assessment, World Trade
Review, 5(2): 199-224.
Cadot, O. and de Melo, J., 2007, Why OECD Countries Should Reform Rules of Origin, World Bank Research Observer, 23(1): 77–105.
Carrere, C. and de Melo, J., 2006, Are Different Rules of Origin Equally Costly? Estimates
from NAFTA, In: O. Cadot, A. Estevadeordal, A. Suwa-Eisenmann, and T. Verdier (Eds.) The Origin of Goods, Rules of Origin in Regional Trade Agreements, Oxford University Press.
Cherkashin, I., Demidova, S., Kee, H., and Krishna, K., 2015, Firm Heterogeneity and
Costly Trade: A New Estimation Strategy and Policy Experiments, Journal of
International Economics, 96(1): 18-36.
Cirera, X., 2014, Who Captures the Price Rent? The Impact of European Union Trade
Preferences on Export Prices, Review of World Economics, 150(3): 507-527.
Conconi, P., Garia-Santana, M., Puccio, L., and Venturini, R., 2018, From Final Goods to
Inputs: The Protectionist Effect of Rules of Origin, American Economic Review, 108(8): 2335-2365
Demidova, S. and Krishna, K., 2008, Firm Heterogeneity and Firm Behavior with