権利
Copyrights 日本貿易振興機構(ジェトロ)アジア
経済研究所 / Institute of Developing
Economies, Japan External Trade Organization
(IDE-JETRO) http://www.ide.go.jp
シリーズタイトル(英
)
ASEDP
シリーズ番号
71
journal or
publication title
Impact of Socio-Economic Changes on the
Livelihoods of People Living in Poverty in
Vietnam
page range
[17]-51
year
2005
Vu Tuan Anh
1. INTRODUCTION
Vietnam is among the poorest countries in the world. The country has suffered seriously from one of the longest wars in recent history. The current per capita GDP accounted by real exchange rate is 480 USD and accounted by purchase power parity (PPP) is approximately 2,500 USD (data 2003). Vietnam’s GDP per capita is ranked at 125 out of 160 countries in the world.
Over the last 20 years, the government has introduced significant macroeconomic reforms, marked by the transition from a centrally planned economy to that of a market economy. This has led to notable improvements in some macroeconomic indicators such as the GDP growth rate, inflation rates, and the fiscal balance. As a result, the living standard of Vietnamese has increased significantly. In correspondence, the poverty rate has also seen a significant decrease: from 70% in the mid 1980’s to 51% in 1993, 37% in 1998 and 27% in 2003 (General Statistical Office [2000], [2004]). Vietnam is considered a successful case of poverty reduction among developing countries.
There are two main factors contributing to this achievement, namely continuous high economic growth and implementation of nationwide poverty reduction policies with the active participation of all governmental authorities, social organizations and population communities. Beginning with local initiatives, poverty reduction has been extended quickly and is becoming a national movement. It is considered by the State as one of the key long-term tasks in the national socio-economic development strategy. Indicators of poverty reduction have to be a necessary component of the development strategy and plan at every governmental level. The national programs and local projects of poverty reduction have been formulated and implemented. They involve not only local resources, significant part of the national budget, but also international support through increasing ODA agreements and various development projects of non-governmental organizations. National programs for poverty reduction play the role of strategic framework and also as tools for coordinating resource allocation and the organization of poverty reduction activities throughout the whole nation and in each location.
This paper reviews the poverty reduction policies of the Vietnamese Government and the formulation process of the national programs for poverty reduction (Section 2). The content of these programs and some major results of implementation of these programs in the last five years is described (Section 3). Based on reports from governmental and non-governmental agencies, the paper examines the impacts of these programs on the poor from a macro-level point of view. Then, using data from the author’s own household survey, it is shown how far the poor have accessed the benefits of national poverty reduction programs (Section 4). Finally, some remarks and recommendations are raised to show lessons learned and to improve the planning and implementation of the national programs for poverty reduction in the coming period (Section 5).
2. FORMULATION OF VIETNAM’S NATIONAL PROGRAMS FOR POVERTY REDUCTION
2.1 Socio-economic context in early 1990s
In Vietnamese documents concerning poverty, it is considered to be 'the situation where a part of the population cannot satisfy the basic needs of life'. This definition refers to concept of absolute poverty. The concept of relative poverty is sometimes raised by researchers but does not have practical significance in the drawing up of policies because absolute poverty is the first objective of hunger eradication and poverty reduction.
Besides this is, the concept of poverty applied to families and individuals, in Vietnam the concept of 'poor area' or 'area faced with extreme difficulties' is also used in the field of state management. A poor area is a locality with a much higher ratio of poor households and much lower living standard than all others in the country at the same period of time. Poor areas usually have unfavourable natural conditions (Poor soil, frequent natural calamities) or the infrastructure is less developed (especially in high mountainous areas). For poor areas the government has special policies of investment and construction to improve the infrastructure and give social aid.
In the 1980’s, the Vietnamese economy was seriously destroyed by a 30-year-long war and faced many problems due to an external embargo, limited domestic production capacity and low level of technology. The living standard of Vietnamese was low. The fundamental economic reform in the mid 1980’s created more favourable conditions for
population was still poor. According to the first Vietnam Living Standards Survey (VLSS) conducted in 1992-1993, the average income per capita over the whole country was 1,105 thousand VND, i.e. equivalent to about 200 USD (accounted by PPP). 58% of the population was defined as poor, e.g. they had an expenditure level that was insufficient to support a healthy life1. The average income per capita in quintile 5 (the richest 20% of the population) was 2,190 thousands VND (420 USD by PPP) which is 4.43 times greater than quintile 1 (the poorest 20% of the population). The average income difference between quintiles 5 and 1 is 3.85 times in rural areas and 3.41 in urban areas. The Gini coefficient calculated for the whole country was 0.36 (General Statistical Office and State Planning Committee [1994]).
At the same time, the Ministry of Labour, Invalids and Social Affairs (MOLISA) used a lower poverty line, that was based on income per capita per month (approximately 30,000 VND per month or 75 USD per year by PPP), and assessed that 26.4% of the rural population and 9.8% of the urban population were poor in 1994. More seriously, there was still a significant part of the population who suffered from hunger.
Besides low income and a shortage of food, clothes and other necessities, poverty expressed itself in a shortage of necessary technical infrastructure (roads, irrigation, electricity, etc.) and poor social service (health care, education). The First Agricultural and Rural Census conducted by the General Statistical Office in 1995 showed that among a total number of 8,791 rural communes, 60.4% were connected to electricity grids, 87.9% had motor-roads and 93.2% had health clinics. As a result, 46.8% of rural households did not use electricity yet, 45% used an unsafe water source and 43% lived in temporary housing (General Statistical Office [2003: 13-14]).
2.2 Formulation of the national poverty reduction programs and policies:
Before the 1990s, poverty reduction and improvement of people's living conditions were one of the main tasks of the government at central and local levels. However, there was no special national action program for poverty reduction. The VIIth Congress of the leading
1 The VLSS determined two poverty lines, following the World Bank's method. The low poverty
line is called the food poverty line. The other poverty line is called the general poverty line. The food poverty line is determined by the standards adopted by most developing countries and international agencies, i.e. it is the requirement of 2,100 Kcal per person per day. People having a level of expenditure lower than the costs needed to obtain this quantity of calories (food poverty line) are considered poor. The food poverty line in VLSS 1992-1993 was calculated at 749,722 VND per year. The overall poverty line is defined by adding the costs of some non-food
Communist Party of Vietnam (CPV) in 1991 recognised that poverty was a serious barrier to development and called the government to pay more attention to supplying better social services and improving infrastructure in poor regions. In 1992, the administration of Ho Chi Minh City initiated to establish a hunger eradication and poverty reduction action plan. Provincial budget was specially allocated for this purpose. Governmental authorities and social organisations were involved in supporting the economic development and social insurance of poor households. The experience gained in Ho Chi Minh City was adopted and extended to some other provinces. Hunger eradication and poverty reduction quickly became a nation-wide movement. Special funds for poverty reduction were created in 45 of 53 provinces in 1995. These funds were mobilised from the population and allocated by local government.
During the period 1992-1995, the Government took various actions for poverty reduction within a framework of 14 national development programs, such as; program for reforestation, job creation, provision of preferential credit, eradication of illiteracy, reduction of child malnutrition, etc. The budget allocated for these national programs was 2,855 billion VND, of which 1,328 billion VND was provided as credit for households, 629 billion VND for essential goods supplied to the poor (e.g food, salt, clothes, blankets, kerosene, etc.), and 835 billion for the construction of communal infrastructure (rural roads, electricity grids, irrigation, schools, commune clinics, etc.). In addition to the state budget, local people voluntarily contributed 425 billion VND for poverty reduction activities (Ha Que Lam [2002]). A special financial service institution – the Bank for the Poor (now renamed the Bank for Social Policies) – was established in 1995 to encourage the economic development of the poor. In 1993, MOLISA promulgated the national poverty line to guide the identification process of poor households, who were targets of poverty reduction policies and projects.
In 1996, the Government established the National Targeted Program for Hunger Eradication and Poverty Reduction with the aim of co-ordinating poverty reduction actions and mobilising more resources to fight against poverty2. The National Targeted Program for Hunger Eradication and Poverty Reduction (HEPR) for the period of 1998-2000 was approved in July 19983. For the period 2001-2005, it also included a job creation component and was named the National Targeted Program for Hunger Eradication, Poverty Reduction and Job Creation (HEPR for short or Program 143)4. Another program – the Program for Socio-Economic Development in Communes faced
2
Government's Decision No. 531/TTg dated 8 August 1996.
3
with Extreme Difficulties (PDCED also known as Program 135), which focused on poverty reduction in the poorest regions, was also promulgated in 19985. From 2000, the earlier national targeted projects for support to especially disadvantaged households of ethnic minorities, sedentarisation, and construction of inter-commune centres in mountainous regions were integrated into Program 135 and made it the program focussing on poverty reduction in the poorest communes and ethnic minority groups. There were some other national targeted programs, poverty alleviation programs and development projects supported by international donors implemented in different regions, which also considered poverty reduction one of their major goals.
Besides the above specialised programs for poverty reduction, the Vietnamese Government issued several policies for social protection, health insurance, exemption of education fees, support for improvement of private housing, supply of safe water, additional allocation of cultivated land to the poor, support for ethnic minority groups, etc. which have been implemented by different authorities. These programs have been directly impacting poverty reduction.
2.3 Content of the major national poverty reduction programs:
As mentioned above, HEPR and Program 135 are considered the major national programs for poverty reduction. They have been implemented from 1998. In late 2004, the final assessment for the period 2001-2005 and preparation of an action plan for the new five-year period were conducted. An overview of the content of these programs will be given in the following sections.
2.3.1 HEPR
The objective of HEPR during the period of 1998-2000 was eradication of chronic hunger and reduction of the poverty rate (by MOLISA's 1993 poverty definition) from 17.7% in 1997 to 10% in 2000. This objective was reached after three years of HEPR implementation. Initially, HEPR consisted of nine main projects: construction of rural infrastructure, resettlement and migration to new economic zones, support for poor ethnic minorities, development of off-farm activities, credit provision, education, health care, agricultural extension, and training of local staff. 9,600 billion VND was invested in HEPR projects during 1999-2000, of which 4,000 billion VND was from the state budget.
Between 2001-2005, HEPR includes a job creation function and has two main objectives, those being (i) reduction of the poverty rate from 17 % in 2001 to lower than 10 % in 2005, an average annual reduction of 1.5-2.0 %; supplying poor communes with adequate essential infrastructure, and (ii) creation of 1.4-1.5 new jobs, a reduction of urban unemployment of 5-6 %, an increase in employment time in rural areas to 80 % in 2005.
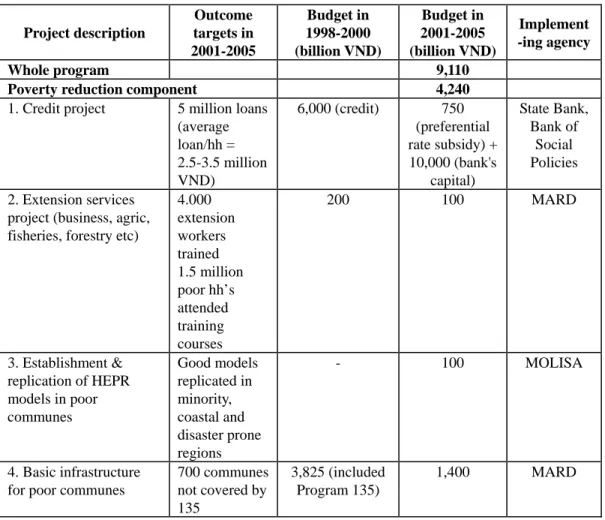
Based on the new regulations of organisation and management of national targeted programs, HEPR is understood not as a "normal program", but as a planning and management mechanism for co-ordination of activities and resource use. It consists of 12 projects and also the implementation of 6 national policies supporting the poor (Table 1).
Table 1: HEPR targets and budget allocation
Project description Outcome targets in 2001-2005 Budget in 1998-2000 (billion VND) Budget in 2001-2005 (billion VND) Implement -ing agency Whole program 9,110
Poverty reduction component 4,240
1. Credit project 5 million loans (average loan/hh = 2.5-3.5 million VND) 6,000 (credit) 750 (preferential rate subsidy) + 10,000 (bank's capital) State Bank, Bank of Social Policies 2. Extension services
project (business, agric, fisheries, forestry etc)
4.000 extension workers trained 1.5 million poor hh’s attended training courses 200 100 MARD 3. Establishment & replication of HEPR models in poor communes Good models replicated in minority, coastal and disaster prone regions - 100 MOLISA 4. Basic infrastructure for poor communes
700 communes not covered by 135 3,825 (included Program 135) 1,400 MARD
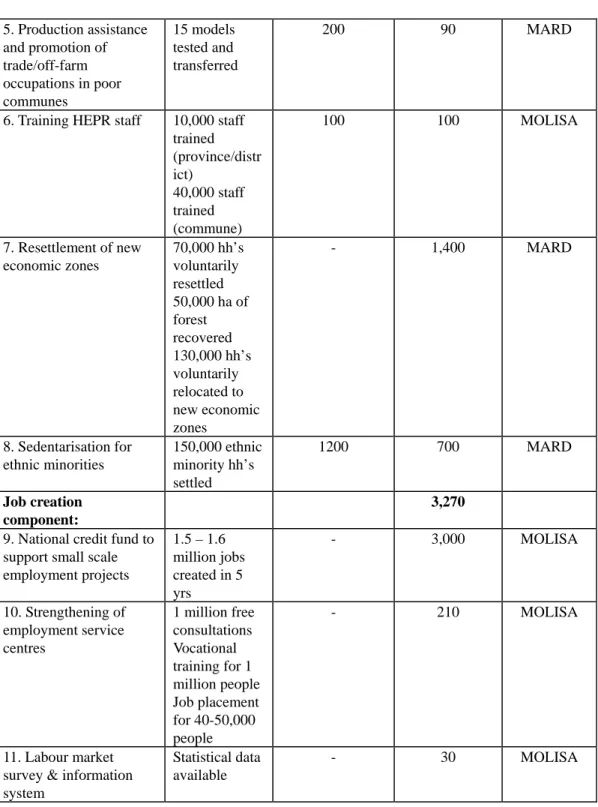
Table 1 (cont.) 5. Production assistance and promotion of trade/off-farm occupations in poor communes 15 models tested and transferred 200 90 MARD
6. Training HEPR staff 10,000 staff trained (province/distr ict) 40,000 staff trained (commune) 100 100 MOLISA 7. Resettlement of new economic zones 70,000 hh’s voluntarily resettled 50,000 ha of forest recovered 130,000 hh’s voluntarily relocated to new economic zones - 1,400 MARD 8. Sedentarisation for ethnic minorities 150,000 ethnic minority hh’s settled 1200 700 MARD Job creation component: 3,270
9. National credit fund to support small scale employment projects 1.5 – 1.6 million jobs created in 5 yrs - 3,000 MOLISA 10. Strengthening of employment service centres 1 million free consultations Vocational training for 1 million people Job placement for 40-50,000 people - 210 MOLISA 11. Labour market survey & information system
Statistical data available
Table 1 (cont.)
12. Training for staff involved in employment management
Training - 30 MOLISA
Support policies 1,600 billion
VND non-refundab
le
1. Low cost, easier access and better quality medical care for the poor
Free medical care (treatment, health insurance), improvement of local medical services (infrastructure and staff capacity) 800 500 MOH
2. More opportunity for education Reduced or exempted school fees, free textbooks and notebooks, free scholarships and vocational training. 834 n.a. MOET
3. Special support for ethnic minorities in poorest regions Provision of basic needs, production inputs, technical extension, and technology transfer.
Table 1 (cont.)
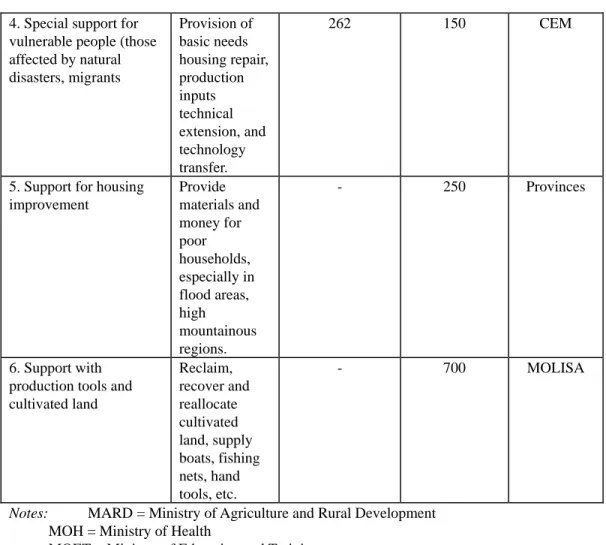
4. Special support for vulnerable people (those affected by natural disasters, migrants Provision of basic needs housing repair, production inputs technical extension, and technology transfer. 262 150 CEM
5. Support for housing improvement Provide materials and money for poor households, especially in flood areas, high mountainous regions. - 250 Provinces 6. Support with production tools and cultivated land Reclaim, recover and reallocate cultivated land, supply boats, fishing nets, hand tools, etc. - 700 MOLISA
Notes: MARD = Ministry of Agriculture and Rural Development MOH = Ministry of Health
MOET = Ministry of Education and Training CEM = State Committee for Ethnic Minorities
Source: Ministry of Labour, Invalids and Social Affairs and UNDP (2004)
As a National Targeted Program, HEPR is managed by a National Steering Committee. One of the Vice Premier Ministers is the Chair of this Committee. Members of the Committee are ministers or deputy ministers of related ministries, such as Ministry of Planning and Investment, Ministry of Finance, MOLISA, MARD, MOH, MOET, CEM, etc. MOLISA is the standing agency in the Committee and is in charge of management. A Managing Office of HEPR is located in MOLISA.
At the local levels (provincial, district and commune), the local administrations (People's Committees) are the implementing agencies. People's Committees have the task of implementing, and enforcing the program within its locality. Provinces arrange funds and allocate them to each activity whilst integrating them with other programs. Provinces mobilize extra funds and are responsible before Government on the use of all resources. A Committee for Hunger Eradication and Poverty Reduction is established at each local level. Members of this Committee are the leaders of related governmental agencies and representatives of major social organisations in each locality (CPV, the Fatherland Front, the Women’s Union, the Youth Union, the Farmers' Union, etc.). At provincial and district level, the Committee for HEPR holds a similar role to the Steering board at the centre. Projects are often implemented at district level, so there is Project and Construction management board formed at this level. That board abides by the guidelines of Project management bodies at different line ministries but is responsible before the district in terms of areas of investment, level and type of work etc.
The National Steering Committee of HEPR decides budget structure and leads implementation. Related ministries and local agencies are the implementing agents. Local Committees for HEPR play the role of consultant and monitor of implementation.
2.3.2 Program 135
Although program 135 is not listed as one of the 6 national targeted programs for 2001-2005, it is considered a national focus program. In terms of budget it is double that of HEPR's poverty reduction component.
In 1998, Program 135 was first implemented in 1,715 communes, of which were 1,568 mountainous communes and 147 plain communes with 1.1 million households and over 6 million people. From 2001 Program 135 has expanded to 2,362 communes. Funding for the 2,233 poorest communes is allocated from the central state budget and the other 129 communes from provincial funds. The number of targeted communes has increased to 2,374 communes, accounting for 22% of the total number of communes in the country.
The Program 135 aims: (i) to reduce poor household rate in communes faced with extreme difficulties less than 25 % in 2005, and (ii) to ensure to provide adequate clean water, over 70 % school-age children attending school, further training on production for poor people, dangerous and social diseases control, roads to inter-commune centres, rural market development.
Program 135 consists of 5 main components such as:
(1) Construction of infrastructure at the village and commune level (roads, clinics, schools, irrigation systems, safe water supply systems, markets, etc.),
(2) Construction of infrastructure at commune-cluster level, (3) Settlement and sedentarisation of ethnic minorities, (4) Agricultural / forestry extension, and
(5) Training of commune cadres, especially for the management and monitoring of construction works.
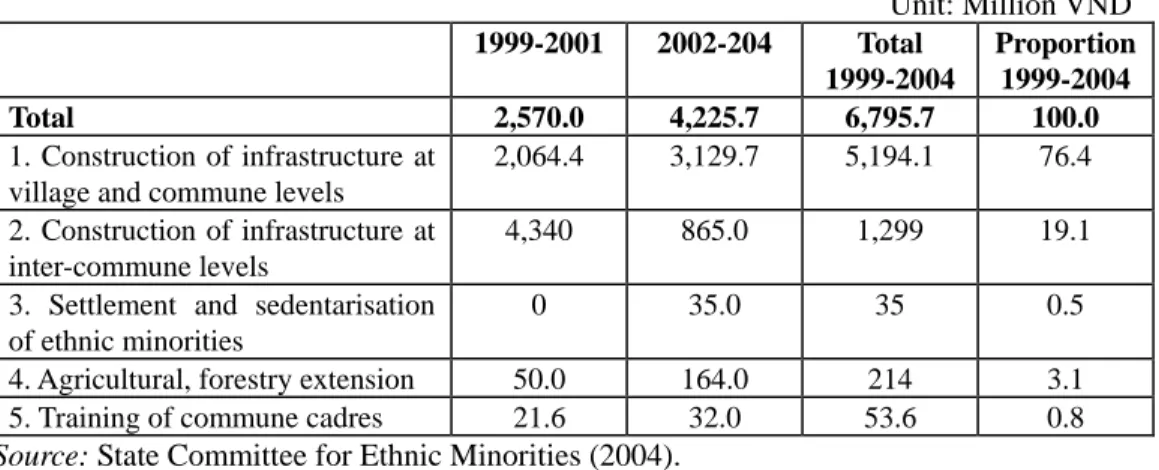
The total investment of in Program 135 during 1999-2004 was 6,795 billion VND, equivalent to 430 million USD. Most of the funds (95.5%) were invested in construction of infrastructure (components (1) and (2)). Less than 4% of the funds (3.9% exactly) were used for capacity building (technical extension (4) and training of cadres (5)). 0.5% of the funds were used for the settlement of households of ethnic minorities, who still practiced shifting-cultivation. (Table 2).
Table 2: Budget allocation of the Program 135
Unit: Million VND 1999-2001 2002-204 Total 1999-2004 Proportion 1999-2004 Total 2,570.0 4,225.7 6,795.7 100.0 1. Construction of infrastructure at village and commune levels
2,064.4 3,129.7 5,194.1 76.4 2. Construction of infrastructure at
inter-commune levels
4,340 865.0 1,299 19.1 3. Settlement and sedentarisation
of ethnic minorities
0 35.0 35 0.5 4. Agricultural, forestry extension 50.0 164.0 214 3.1
5. Training of commune cadres 21.6 32.0 53.6 0.8
Source: State Committee for Ethnic Minorities (2004).
Similarly to HEPR, the managing agency of Program 135 is the National Steering Committee with one Vice Premier Minister as the chair and leaders of related governmental agencies as members. The State Committee for Ethnic Minorities (CEM) is in charge of co-ordination and management at the central level. Managing Boards of Program 135 have been created at local levels (provincial, district and commune) in those localities that have communes on the target list of Program 135.
3. IMPLEMENTATION OF THE NATIONAL POVERTY REDUCTION PROGRAMS
The following sub-sections will describe how far the national poverty reduction programs have been implemented in practise. With this information, one can argue more for evaluating the impacts of poverty reduction efforts and designing new solutions and actions for the next period.
The implementation of poverty reduction policies and measures can be monitored and assessed at different levels such as (i) monitoring inputs, e.g. checking the quantity and quality of the applied interventions and making sure these interventions are applied to the correct subjects, (ii) monitoring the mechanism of policy implementation, e.g. checking the ways intervention is carried out to ensure equality, transparency, democracy and wide participation of communities and the poor themselves in the implementation, and (iii) evaluating outputs, e.g. checking the results of intervention both quantitatively and qualitatively, whether the poor can sustainably escape from poverty, and whether the interventions bring about unexpected social inequality.
Some recent studies (Ministry of Labour, Invalids and Social Affairs and UNDP [2004], State Committee for Ethnic Minorities [2004], World Bank et. al. [2003]) have focused on monitoring the mechanism of policy implementation, i.e. point 2 above. Point 3, i.e. evaluating outputs will be presented in Section 4 by reviewing the results of some field surveys. In this sub-section, the first point, i.e. monitoring inputs, will be implemented with the aim of showing how the projects and activities of poverty reduction programs are realised in practise. Crucial intervention towards poor households from the national programs for poverty reduction will be listed below, i.e. construction of infrastructural facilities in poor communes, support in the areas of health care, education, housing, credit and production knowledge extension.
3.1 Construction of rural infrastructure facilities
By the amount of allocated budget, construction of infrastructure in poor communes, including both communes with extreme difficulties (targets of Program 135) and poor communes (those not on the list of Program 135, but defined by MOLISA criteria) is the biggest component of the national poverty reduction programs. 95.5% of budget in Program 135 and 33% of budget of the poverty reduction component of HEPR was allocated for this goal.
The target is 2,374 communes of Program 135 plus 997 poor communes of HEPR. In total 3,371 communes (about 30% of communes nationwide). The number of targeted communes increases each year, in accordance with the demand of provinces and the feasibility of budget allocation.
The identification of targeted communes in both programs was made based on a set of combined criteria of availability of basic infrastructure facilities of seven types (motor-road connected to the commune centre, primary and secondary schools, irrigation systems, electricity from national grids, clean water, health clinics, market halls) and the poverty rate in the communes. The list of targeted communes was compiled from the bottom up – from communes to higher administrative levels.
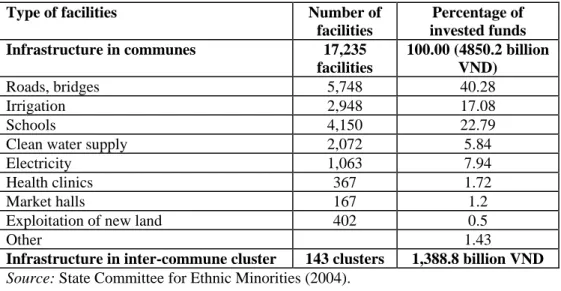
During the five years between 1999 and 2003, in the framework of Program 135 there were 17,235 infrastructural facilities constructed in 2,362 communes, 317 districts and 49 provinces (Table 3).
Table 3: Construction of infrastructure facilities in Program 135 in 1999-2003
Type of facilities Number of
facilities Percentage of invested funds Infrastructure in communes 17,235 facilities 100.00 (4850.2 billion VND) Roads, bridges 5,748 40.28 Irrigation 2,948 17.08 Schools 4,150 22.79
Clean water supply 2,072 5.84
Electricity 1,063 7.94
Health clinics 367 1.72
Market halls 167 1.2
Exploitation of new land 402 0.5
Other 1.43
Infrastructure in inter-commune cluster 143 clusters 1,388.8 billion VND
Source: State Committee for Ethnic Minorities (2004).
By the end of 2003, the infrastructure in 2,362 communes in the targeted list of Program 135 had been improved as below:
• 1,549 communes (85% of targeted communes) had electricity, 64% of households used electricity,
• 2,148 communes (94%) had roads connected to the commune centre, • 1,686 communes (81.2%) had irrigation facilities,
• 973 communes (59.4%) had safe water supply systems,
• 1,848 communes (84%) had primary schools of permanent construction, • 1,397 communes (73%) had secondary schools of permanent construction, • 795 communes (48%) had market halls,
• 1,353 communes (76%) had a post office, and
• 872 communes (66%) had radio broadcasting equipment.
Within the framework of HEPR, 997 communes were defined as poor and to be targets of the Program. However, the central state budget could not allocate funds for infrastructure construction in these communes yet. During the three year period from 2001 to 2003, a fund of 776 billion VND was mobilised from local budget, other development programs and contributions of the local population; of which 200 billion VND came from population communities. More than 1,000 infrastructural facilities were built in 800 communes.
Improvement of infrastructure positively effects the socio-economic development of poor communes. It helps overcome the geographical and social isolation of poor communities, making the social services (education, health care, safe water supply) better, and creating more favourable conditions for production, trade and communication.
3.2 Support in health care
The Vietnamese Government has issued a policy of free health examinations and treatment for the poor, providing free medical insurance certificates to the poor, subsidising a proportion of the transportation fee of medicines to mountainous areas, and upgraded the grassroots health care infrastructure (in districts, communes and villages).
The latest decision of the Government on support policy for the poor is Decision No. 139 /2002/QD-TTg issued on 16 December 2002 with the aim of securing access to health care by the poor, and in particular for in-patient treatment. It created provincial health care funds for eligible individuals to finance out-of-pocket costs of publicly provided health services. Decision 139 directs these funds to either buy health insurance cards for the poor, or to pay directly for the out-of-pocket costs of services supplied to beneficiaries by hospitals and possibly other public providers. Decision 139 is designed to benefit the poor in two ways: increase utilisation of health services, and reduce poverty in terms of income.
Depending on the context of provinces, there are currently five types of health care benefit provided to the poor:
• Hospitals exempt the poor from treatment fees in accordance with the budget framework of hospitals. MOH recorded that 7-8% of patients in state-owned hospitals paid either a reduced fee or were exempted due to being poor.
• Provincial government allocates an additional budget to hospitals to cover the real treatment costs of the poor.
• Provincial government provides certificates of free health care to the poor and covers the medicine and equipment costs of their treatment; hospitals provide other costs (health examination, hospital beds).
• Health insurance cards are provided free to the poor.
• Other forms of health support for the poor have been implemented in provinces, such as charity clinics providing free treatment for the poor, mobile medical brigades to poor areas, treatment for some vulnerable groups (invalids, children, etc.), voluntary contributions from business, agencies and local communities for food, medication, etc.
The latest report of MOLISA says that up to the end of 2004, 33 provinces had provided health insurance cards for 1,845 thousand people, and 39 provinces has provided certificates for free health examinations to 2,452 thousand people (Ministry of Labour, Invalids and Social Affairs [2004]).
3.3 Support in education
Besides general education policies, such as building schools, training teachers, raising salaries and allowances of teachers who work in exceptionally difficult areas; there are policies with direct support for poor students, such as lending or giving out textbooks, exemption from or reduction (50%) of tuition fees and other educational fees, providing scholarships to students in mountainous areas and poor students.
In 1999, MOET arranged to allocate funds from the National Targeted Program for the Improvement of Education Facilities to the 1,000 poorest communes in order to construct or repair schools. Each commune received 50 million VND. The National Project for Primary Education (with borrowed funds from the World Bank) provided 1 million USD to equip schools in the poorest communes with textbooks. Annually, 18 billion VND is allocated from the state budget to supply the poorest communes with children's newspapers and books. Several other projects and programs are implemented with a focus on the poor6.
6
MOLISA reports that annually, 3 million children eligible for reduced tuition fees or complete exemption. 2.5 million children receive granted notebooks and textbooks. The state budget allocates 150 billion VND annually for the education support of the poor (Ministry of Labour, Invalids and Social Affairs [2004]).
3.4 Support for housing improvement
As estimated, more than 40% of poor households (approximately 900 thousand households) live in low-quality housing and needs support to improve their dwelling (Ministry of Labour, Invalids and Social Affairs [2004]). Housing support is a new policy of the Vietnamese Government and is being first implemented in some key areas such as the Mekong River Delta, the Central Highlands and the Northern Mountainous Region in the form of preferential credit, free construction materials, mutual aid for the construction and reparation of houses. Funds for this purpose are mobilised from various sources: local budget, commercial banks, contribution of enterprises and the local population and international aid. As of the end of 2004, all 64 provinces have been implementing measures for housing support to the poor. Three provinces – Hai Duong (in the Red River Delta), Ha Tinh (in the Central Region) and Tuyen Quang (in the Northern Mountainous Region) have completed their plan on 'the deletion of temporary housing', i.e. there are no more temporary houses in the province. 30 other provinces plan to reach this goal in 2005.
By the end of 2004, about 260 thousand poor households in the country received assistance for housing improvement, of which 180 thousand constructed new houses and 80 thousand repaired their existing houses. Approximately, 847 billion VND has been spent on this goal7. This activity attracts very active participation of communities and the Fatherland Front plays an important role in mobilising the funds. The Fund for the Poor mobilised and managed by this organisation grows yearly: in 2001 the fund at central level was 2 billion VND, in 2002 – 10 billion, in 2003 – 20 billion, and only in December 2004 – 'the Month for the Poor' more than 10 billion VND was contributed by enterprises and the local population. This demonstrates clearly that poverty reduction is a nation-wide movement.
Hanoi 3-4 October 2003.
7
Pham The Duyet (Chairman of the Fatherland Front of Vietnam) – Speech at the Meeting
In terms of support form, free provisions are more common than giving loans. Poor households who have received housing support are mainly those that have suffered natural calamities or ones who belong to the most vulnerable groups. Credit provision is too risky for the commercial banks unless they are subsidised by the state budget for this operation.
3.5 Provision of credit for poverty reduction purposes
Lack of capital is an extended constraint for poor households. Therefore, providing loans to poor households with preferential conditions (low interest rates or no collateral) is an important poverty reduction policy of the Vietnamese Government.
In the four years from 2002 to 30 September 2004, the Bank for Social Policies has granted loans amounting to 9,654.5 billion VND to 2,861 thousand poor households (15.8% of households nationwide). MOLISA estimates that 75% of poor households have accessed preferential credit. The average loan per household increased from 2.2 million VND to 3.1 million VND in 2004. It is to note that the percentage of overdue debt is small, only 1.71% (Ministry of Labour, Invalids and Social Affairs [2004]).
3.6 Allocation of agricultural land to landless households
Lack of land led poor farmers to unemployment and low income. This situation is critical in some mountainous areas. By implementing the Government's decrees on allocation of additional land to landless households, the provinces in the Northwest Mountainous Region supported ethnic minority households in their exploitation of new land and increasing of production intensification. In the Central Highland Region, state-owned farms have had to reallocate a part of their land to landless households of ethnic minorities. During the period 2002-2004, approximately 5,140 hectares of agricultural land was given to 10,455 households. In the Mekong Delta, preferential credit was provided to landless households to buy additional land or to buy back previously owned land. 4,325 households have benefited from this decree.
Besides this, many resettlement projects were implemented in order to support migrating households and those practicing shifting cultivation to obtain new land, construct houses, supply safe water and build infrastructure in new economic zones. Between 2001 and 2004, 479 such projects were conducted with a total investment of 279 billion VND. Almost 50,000 households were resettled.
3.7 Technical extension in agriculture, forestry and fishery
The Ministries of Agriculture and Fishery and social organisations such as the Farmers Union, the Women’s Union have organised more than 30,000 training courses on technology transfer with the participation of over half a million people. More than 5,000 demonstration models of agricultural, forestry and fishery development were established to show poor people how to use new technology and manage business.
4. IMPACTS OF THE NATIONAL POVERTY REDUCTION PROGRAMS
4.1 Achievements of poverty reduction viewed from macro level
In the last decade, poverty reduction in Vietnam has obtained good results. The rate of poverty has significantly reduced. Quality of life has improved in most regions in the country. Infrastructure in the poorest areas has developed and positively influenced the socio-economic development of these areas.
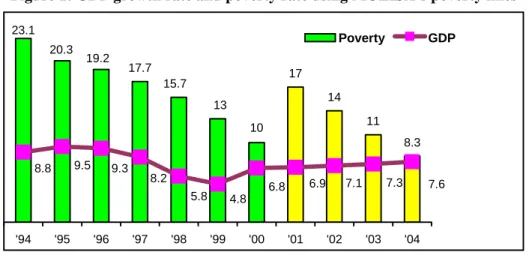
According to the poverty definition provided by MOLISA, the poverty rate of Vietnam has declined from 30% in 1992 to 17.7% in 1997 and about 10% in 2000. In 2001, this poverty line was raised; therefore, the poverty rate in 2001 was 17% and went down to 8.3% in 2004 (Figure 1).
Figure 1: GDP growth rate and poverty rate using MOLISA’s poverty lines
17 14 11 8.3 10 13 15.7 17.7 19.2 20.3 23.1 7.6 7.3 7.1 6.9 6.8 4.8 5.8 8.2 9.3 9.5 8.8 '94 '95 '96 '97 '98 '99 '00 '01 '02 '03 '04 Poverty GDP
Source: General Statistical Office, Ministry of Labour, Invalids and Social Affairs
According to the poverty definition of the Vietnam Living Standard Surveys (VLSS), the overall poverty rate has reduced from 58% in 1993 to 37% in 1998, 28.9% in 2002 and 25% in 2003. Food poverty has reduced from 24.9% in 1993 to 15% in 1998 and 11% in 2003 (Figure 2).
Figure 2: Poverty rate given by VLSS
58.1 37.4 28.9 24.9 15 10.9 1993 1998 2002
Overall poverty Food poverty
Source: General Statistical Office and State Planning Committee (1994),
General Statistical Office (2000), General Statistical Office (2003).
This amounts to halve the share of poverty in less than a decade. In other words, almost a third of the total population was lifted out of poverty in less than ten years. With these achievements in poverty reduction, Vietnam is considered by international observers as "one of the greatest success stories in economic development". It is also noted that "while some regions and some population groups gained more than others, Vietnam continues to reduce poverty considerably faster than other countries at a similar developmental level. In the early 1990s, its poverty rate was higher than could be expected, given the country's level of economic development. Some time during the second half of the 1990s Vietnam caught up with the 'average' country at its developmental level, and it largely surpassed it by 2002." (World Bank et. al [2003: 1]) (Table 3).
There are three main factors leading to the achievements in poverty reduction in Vietnam.
Table 3: Comparable poverty rates in selected countries
GDP per capita in USD (PPP)
Population living with less than one USD (PPP) per day (%)
Malaysia 8,922 2.0 Thailand 6,788 2.0 Russia 7,926 6.1 Sri Lanka 3,447 6.6 Indonesia 3,138 7.2 Mexico 8,707 8.0 Brazil 7,516 9.9 Vietnam 2,240 13.4 Mongolia 1,651 13.9 Philippines 4,021 14.6 China 4,475 16.1 Lao 1,678 26.3 India 2,571 34.7
Source: World Bank et. al. (2003). p. 15.
Firstly, it is good economic performance over the last decade. Reforms in
socio-economic policies, that began in the early 80’s and officially promulgated as Doi
Moi (Renovation Policy) by the state leadership in 1986, have dramatically changed the
Vietnamese economy and improved the living standards of the people. Doi Moi was associated with the distribution of agricultural land to rural households, marketisation of the rural economy and created the right incentives for farm production. Doi Moi also opened more free space for development of private business and created a favourable environment for job creation and income generation. Trade and service sectors quickly expanded. Mobilisation of the increasing volume of official development assistance, the involvement of direct foreign investment and development of external economic relations contributed a greatly to economic growth. In the past 10 years, although faced with many difficulties and challenges, the Vietnamese economy gained a high GDP growth rate of 7 to 8 % (Figure 1). This rapid economic growth contributed considerably to poverty reduction.
Secondly, the Vietnamese government has issued policies and mechanisms to
implement and encourage poverty reduction. The national poverty reduction programs and policies play the key role of mobilisation, allocation and use of resources for prioritised objectives and localities. They have not only to solve directly the most actual problems of poverty and are considered the 'driving force' of the whole poverty reduction movement in the country. (The next sub-section 3.2. will analyse the contribution of the
national programs to poverty reduction goals).
Thirdly, wide participation in poverty reduction activities has become a national
awareness. Fighting against poverty is not only the responsibility of the government, but a prioritised task of all political and social organisations, enterprises, communities and the general population.
4.2 Challenges of poverty reduction
Despite of a remarkable reduction in poverty, the achievements are not seen as stable yet. Vietnam still has to overcome many challenges to the poverty reduction process as below:
(a) The rate of poor households and the poor is still high
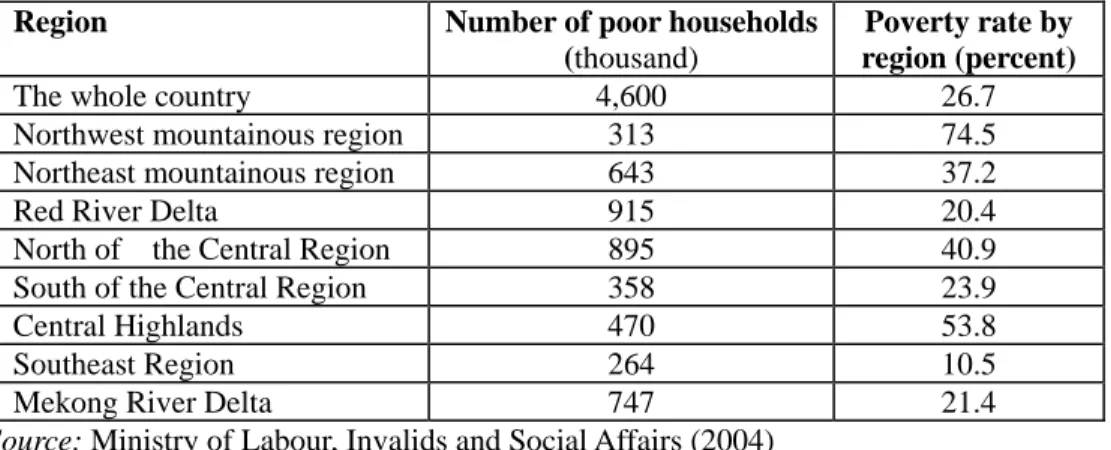
In the end of 2004, there are 1.4 million poor households (8.3% of total) in Vietnam, measured using MOLISA's poverty definition. According to the VLSS definitions using a much higher poverty line, there are 4.6 million poor households, of which 0.5 million in urban areas, almost 2 million in rural plain areas and 2.1 million in rural mountainous areas. Spatial distribution of the poor by region is as follows.(Table 4)
Table 4: Spatial distribution of the poor
Region Number of poor households
(thousand)
Poverty rate by region (percent)
The whole country 4,600 26.7 Northwest mountainous region 313 74.5 Northeast mountainous region 643 37.2
Red River Delta 915 20.4
North of the Central Region 895 40.9 South of the Central Region 358 23.9 Central Highlands 470 53.8 Southeast Region 264 10.5 Mekong River Delta 747 21.4
Source: Ministry of Labour, Invalids and Social Affairs (2004)
As our data shows, the poverty situation is not the same among different provinces and ethnic groups. The mountainous areas have the highest rate of poverty. The great majority of the poor (90%) live in rural areas while only 10% of the poor live in urban settings. It is estimated that the poverty rate among the ethnic minority is about 45% or 0.4 million households, accounting for one third of the total number of poor households
nationwide.
(b) The rate of poverty reduction reduced and stratification of living standards increases
The poverty rate decreases by a slower speed. From 1993 to 2002, the poverty rate in urban areas went down from 25.1% to 6.6%, but it reduced at half that rate in rural areas - from 66.4% to 35.6%. The poorest regions, such as the Northwest Mountains and the Central Highlands have the lowest rate of poverty reduction.
(c) Poverty is still deep in many dimensions
Although hunger does not exist in Vietnam, part of the poor population still suffers from seasonal shortages of food. Every year, the Government has to provide support for 1 – 1.3 million people in remote mountainous regions, in areas which are affected by drought, flooding and other natural disasters.
The poor live in bad housing. According to records of the provincial administration, more than 0.7 million households live in temporary housing (constructed with bamboo, straw and other non-permanent materials). In some mountainous provinces, most households do not yet have electricity for use. Almost half the rural population has no safe water yet.
The poor have a low level of education. 25% to 50% of the heads of poor households in mountainous areas are illiterate. Children of poor households tend to drop out from secondary and higher schooling. Access to health care is also still limited among poor households.
Apart from infrastructure, the quality of social services, especially healthcare, education, clean water supply and family planning in poor areas and communes is still extremely poor.
(d) Poverty reduction is fragile
The achievements in poverty reduction are not firm enough, leaving the possibility of falling back into poverty. Vietnam is located in an area where natural calamities and floods often occur and 80% of the poor are working in agricultural fields, leading to the high risk of becoming poor again. The majority of the population lives close to the poverty line. They are always at threat of falling back into poverty due to the slightest risk. MOLISA records that each year there are about 20,000 - 25,000 households falling back into poverty.
4.3 Contribution of the national programs to poverty reduction viewed from micro level
With various types of activities and support policies, the national poverty reduction programs have made significant contributions to different fields of economic development of poor households and poor areas. To evaluate the contribution and impacts of the national programs and policies on the well-being of the poor, field survey data is to be used.
In 2003-2004, the author co-operated with the Managing Office of the National Target Programme for Hunger Eradication, Poverty Reduction and Job Creation (HEPR) and conducted a nation-wide household survey on the poverty situation and implementation of the activities of HEPR. The survey sample includes representatives of: (i) major geographical areas of the country (in particular delta regions, high and low mountainous regions, coastal regions, suburban regions, small, medium and large urban centres); (ii) different types of inhabitant communities, in particular rural and urban areas; (iii) some typical ethnic groups. The sampling combines both random and representative methods.
The survey sample includes 20 communes in 12 provinces, of which 17 are rural communes and 3 are urban wards. There are 4029 households in the sample, with 19,696 people, of which 78.5% are of Kinh ethnicity (the majority ethnic group), 21.5% belong to 8 ethnic groups: Thai, Muong, Dao, Khang, San Diu, Hoa, and Ede. The data in the survey expresses various aspects of the livelihoods of different social groups (Vu Tuan Anh and Vu Van Toan [2004]).
Below, we will present some aspects directly related to the poor and the effects of the national poverty reduction programs on the poor.
4.3.1 Present poverty status
Although the poverty rate (in terms of income or expenditure of households) decreased significantly and poverty reduction activities have had positive effects on various aspects of people's lives, the number of poor households and poor communities is still high in Vietnam. The poor face many problems. This sub-section will describe the present well-being of the poor with the aim of showing the impacts of poverty reduction policies and measures on households, their needs and which actions could be planned for the next stages
(a) Characteristics of the poor
Our household survey shows some characteristics of the poor as described below:
• The average size of poor households is 5.22 people, larger than the average household size of the whole survey sample (4.89 people).
• Compared with Kinh people, ethnic minority people are poorer. While the poverty rate of Kinh households is just 25.5%, the poverty rate of ethnic minority ones is 47%. • In terms of gender relations, females make up 51.59 % of the poor people, and males
48.41%. 77.6% of household heads are men, 32.4% are women.
• In terms of age of household heads, young households (where the household head is less than 30-years-old) account for 9% of the poor households. The majority of heads of poor households (74%) range from 30 to 60 years old. The old household heads make up 17%. In households whose heads are old, it is not necessarily that these old men or women take a decisive economic role. Usually, they are only registered as the head of the family, while the main bread earners for the entire family are the younger members.
• Nearly half the heads of poor households have no more than primary education, and 12% are illiterate. Most of these people are of ethnic minority groups and live in mountainous areas. The rate of household heads who have a higher education background (upper secondary school) is identical to the rate of those who are illiterate. They mostly live in northern delta and midland areas.
• In terms of main occupation, 81% of the household heads engage in agriculture, forestry and fishery; among which 5% work as hired labourers. Household heads who are working in the non-agricultural sectors account for about 8%, of which 5% is in trade and services. Poor households which have old, disabled heads represent 9% of the total households.
(b) Dimensions of poverty
Despite efforts to improve the living conditions of people in all regions and provinces, the basic needs of the population are still not met.
• Housing: Nearly 48% of poor households live in temporary, bamboo houses; 36% have semi-permanent housing; the rest have one-story permanent housing. In total, 84% of poor households live in low quality housing. Compared with the average rate of 20% the rate for poor households is 2.5 times higher.
• Electricity: 35.5% of poor households do not have access to electricity (while the average rate of the total sample is 13%)
• Clean water: 3% of poor households are using untreated water from ponds, rivers, and streams for drinking (the average rate of the total sample is 1.4%). Water from dug wells (not really clean) accounts for 50% of total water used by poor households (while the average figure of the total sample is 44%).
• Lavatory: 91% of poor households do not have sanitary lavatories (average rate of total sample is 60%). In particular, there are nearly 20% of poor households, who do not have their own lavatories (average rate of total sample is 12%)
• Audio-, video-equipment: 80% of poor households do not have a radio set, 53% do not have a TV (not even black and white). Only 19% have a black and white TV, 28% have a colour TV (compared with the average rate of the total sample at 14% and 56% respectively). About 50% of poor households do not have any audio or video-equipment.
• Private vehicle: 27% of poor households do not have a private vehicle (bicycle, motorcycle). Only 19% have motorcycles and 54% have bicycles.
• Education: 11.7% of poor households have children of school-age that do not go to school. The main reason for this is economic: 7.7% do not go to school due to the high expenses of education, 3.2% due to lack of labour in the family (they have to stay at home and help). In all, these two reasons account for 10% out of 11.7% of the households. The remainder is due to health problems (disabled or sick children) or poor performance in school leading to dropping out. As mentioned above, heads of poor households have an education background that is lower than the average level of the total survey sample.
• Income: On average, the income per capita per month of poor households remains at approximately 70,000 VND, equivalent to only one third the average figure of the whole sample (216,000 VND).
These figures show that indicators such as housing, sanitation, audio / video-equipment, and private vehicles have a close relationship with the poverty rate of households. Meanwhile, other indicators, such as access to electricity, and clean water, depend more on the common local conditions and public capability. All households can gain benefit from these public services.
(c) Reasons for poverty
The reasons for poverty were assessed by the poor households themselves. In the household questionnaire of our survey, each household had to give at most 3 major reasons for their own poverty.
According to the opinion of poor households, the main reason that leads to the general poverty lies in the lack of capital (71.8%); second is the lack of knowledge and business experience (52.9%); third is the lack of labour and numerous dependants in the family (42.8%); and then lack of agricultural land (32%) and health reasons (26.9%) ranking fourth and fifth respectively.
The reason for poverty concerned with markets and prices only accounts for a minor figure of 8%, due to the strong self-substitution in the household economy. Only in regions where market-oriented production outdoes this do market and price factors significantly influence the life of households. For example, in the Central Highlands where coffee production is the main means of livelihood, unfavourable prices in the world market made many households fall into poverty (23%).
The rate of poor households who considered natural calamities, accidents and risks as the main reasons of their poverty accounts for 3 to 5%. Social evils, such as alcoholism, addiction, gambling, etc., also lead a considerable number of urban households into poverty (4.5%).
In brief, the main reason of poverty lies in the lack of production factors such as capital, land, and production knowledge. The human factor (numerous children, lack of labour force, chronic illness) represents the second reason.
Specific characteristics of poverty reasons in different regions may provide useful information for building and adjusting poverty reduction policies and measures. Between rural and urban areas, the reasons of poverty differ in some noticeable points:
• The main reason of poverty in urban areas is due to human resources: numerous dependants, lack of labourers, chronic illness. This reason represents employment difficulties in urban areas. Meanwhile, in rural areas, production factors play the most important role. Therefore, poverty reduction measures in urban areas should focus on job creation, while in rural areas households should be supplied with sufficient production factors.
• Lack of production and business knowledge and limited experience constitutes an important reason of poverty in rural areas. Therefore, access to knowledge and new production technology should be improved. Business abilities need to be enhanced. This is to be more clearly reflected in the poverty reduction policies and programs. • In urban areas, the number of people who suffered due to social evils is much higher
than that in the rural areas.
surveyed households) ranging from the lowest to the highest, we can see that the average income disparity between the richest and the poorest quintiles is 11.1 times. The gap inside regions remains at about 5 to 6 times. In poor regions, namely mountainous and coastal areas, the gap is higher mainly because of the very low income of self-sufficient households.
The average income of the poorest quintile in urban areas is 3 times higher than that in rural areas. The income of the richest quintile in urban areas is 3.5 times higher than that of the 20% richest households in rural areas.(Table 5)
Table 5: Average income of household quintiles and gap between the richest and the poorest quintiles
Total Urban Rural Delta Subur
-ban Coastal Low mount -ainous High mount -ainous Average income * Quintile 1 52,923 152,040 47,849 65,820 119,161 68,321 50,699 19,972 * Quintile 2 110,323 259,430 98,588 108,694 175,693 121,222 88,137 43,630 * Quintile 3 167,977 353,766 144,931 149,100 224,242 164,383 121,696 76,071 * Quintile 4 250,801 493,038 200,061 203,154 295,232 230,546 185,958 126,676 * Quintile 5 588,180 1,026,306 292,731 374,929 621,176 616,385 394,476 289,389 Gap (quintile 5/ quintile 1, times) 11.11 6.75 6.12 5.70 5.21 9.02 7.78 14.49
Source: Author's own survey. See also Vu Tuan Anh and Vu Van Toan (2004).
4.3.2 Benefits of national poverty reduction programs to the poor
Our field survey checked how far the poor accessed the benefits of the national poverty reduction programs.
(a) Health care:
• In the whole sample, 32.5% of the poor households have access to free health examinations and treatment. In urban areas, this rate is higher (61%), while in rural areas it is 30.4%.
• 49% of poor households received medical insurance certificates, but only 28% used them. Compared with the national data, these figures are quite optimistic. A recent report from the Ministry of Health indicates that by the mid-2002, two thirds of the provinces had bought medical insurance for the poor, but only 20% of the poor, e.g.
1.54 million people, received their certificate and it was of low value (30,000 VND per year)8.
• It is noticeable that the high mountainous communes in the survey sample are better supported medically: 37% of poor households are eligible for free health examinations and treatment. The rate of poor households having medical insurance certificates reached 74%, of which 32% have used them.
(b) Education
• 48.8% of poor households have children who pay reduced tuition fees or are exempted, in particular in urban areas 75.8%, high mountainous areas 70.8% and midland and low mountainous areas 53%.
• 34.7% of poor households have children who are exempted from other education fees, in particular in urban areas 60.6%, midland and low mountainous areas 52% and high mountainous areas 37%.
• 9.2% of poor households have children who are provided with textbooks, mostly in high mountainous areas (30%).
• 2.5% of the poor households have children who received scholarships, mostly in urban and suburban areas, where charitable financial resources can be raised from businesses and the local community.
• Only 0.21% of poor households benefited from free vocational training courses. In general, this kind of support is not of great concern since the rate of vocational training students is quite low, especially in rural areas and the vocational training centers usually do not give preferential conditions to poor households.
(c) Credit
In 2002, 58% of poor households received loans, the average amount being 3 million VND. The rate in urban areas was quite high (83%) while in rural area the figure was just 56%. The midland and low mountainous areas showed the highest rate of 71.2%, while the rate in the high mountainous areas was 53.7% (Table 6). These figures show the utmost exertion in providing loans to the poor in mountainous areas, since these areas have bad transportation and communication conditions.
8
Le Ngoc Trong (Vice Minister of Health) – Renovation of policy and mechanism of health
Table 6: Credit provision for poor households
The rate of poor households receiving loans (%)
The average amount borrowed by each household (million VND)
Total 58.39 3.07 - Urban areas 83.33 4.31 - Rural areas 56.56 2.94 By region: + Delta 49.07 2.38 + Suburban 53.33 3.16 + Coastal 51.85 2.10 + Low mountainous 71.23 2.88 + High mountainous 53.70 3.80
Source: Author's own survey. See also Vu Tuan Anh and Vu Van Toan (2004).
There are various credit sources for poverty reduction purposes, namely: the Bank for Social Policies, the National Fund for Job Creation, social and mass organisations, the Bank of Agriculture and Rural Development, the People’s Credit Funds and other sources.
Among these, the Bank for Social Policies plays the decisive role. Loans from this bank are provided with low interest (0.5 to 0.6% per month, only half that of the short-term interest rate of commercial banks). 37.9% of poor households are using capital from the Bank for Social Policies with an average loan of 2.4 million VND. These figures are identical to those reported by government agencies. According to data stated by the Bank for Social Policies, it has provided loans to 868 thousand poor households, equivalent to 37% of poor households in 2002. According to the Vietnam State Bank, by mid-2002, each poor household had received an average loan of 2.33 million VND9.
The second important source is the Bank of Agriculture and Rural Development. Poor households seldom borrow loans from this source due to lack of preferential conditions (0.8 to 1% per month with collateral). Only 7.6% of poor households in rural areas take loans from this bank with the average loan being 4.3 million VND per household.
9
The Vietnam State Bank – Improving mechanism, policies and procedures of credit
1.9% of poor households borrowed from social and mass organisations with an average loan of 2 million VND per household. The social and mass organisations play an active role in providing loans for poverty reduction purposes. This may be considered as the best participation of the masses in poverty reduction activities. In particular, local branches of such organisations as the Association of Farmers, the Women’s Union, the Association of Veterans, and the Youth Union operate very efficiently. Capital that goes through these associations comes from two main sources such as (i) banks and poverty reduction programs, and (ii) capital mobilised from their members. With active and efficient loan provisions, combined with providing technical extension and knowledge on business and financial management to poor households, these organisations show best practices in mini-finance activity for poverty reduction purposes.
Informal credit sources also play an important role in micro-financial markets in Vietnam. First, the sources are friends, relatives, neighbours – the ones on whom the poor can rely when they meet difficulties in their life, and can borrow loans without interest rates or time limits. But there exists also capital sources from private lenders, who provide credit with market interest rates, which in some urgent cases are very high and the payback term is counted in days. The poor have to borrow from this source when they do not have any other feasible sources. 8.9% of poor households have borrowed from these sources, more particularly 7.1% of rural households and 33.3% of urban households.
5. REMARKS ON POVERTY REDUCTION PROGRAMS IN VIETNAM
5.1 On the concept of poverty reduction in Vietnam
A combination of economic growth and social development in the national development strategy and in policies of every locality is one policy option that is not easily selected and implemented. Poor countries used to focus solely on economic growth; and poverty reduction waited for the 'trickle-down' effects of economic growth. Vietnam long ago implemented and still follows Ho Chi Minh's principle, that fighting hunger, poverty and illiteracy have to the first priority of the State. In development plans at all administrative levels, both objectives – economic growth and poverty reduction are considered as equally important. Attention to poverty reduction in policy-making process is right especially in the context of market-oriented economic reforms, which used to leave the poor outside development flow.
The poverty reduction movement in Vietnam is the result of initiatives and efforts of all Vietnamese. Overcoming poverty is not only the responsibility of the Government and the poor themselves, but is a part of the spirit and ethical traditions of the society. The Government encourages the initiatives of the people and extends the scope of poverty reduction activities through the national programs and supporting policies. A combination of the strong commitment of the Government and wide participation of the whole society secures the success of poverty reduction in Vietnam. It is an important approach, one that few countries in the world follow, and it is the explanation for the achievements Vietnam has made over the last decade in the fight against poverty.
Poverty reduction is a long and complicated process. Poverty in such under-developed countries as Vietnam is absolute and deep. The poorest people suffer from extreme hunger, illiteracy and a lack of minimum basic resources for their existence. Therefore, poverty reduction programs must combine the policies and actions from different ideologies such as:
• Charitable action, social protection and subsidies to help the poor satisfy their urgent basic needs of existence,
• Developmental action, to help the poor mobilise their resources for economic and human development, and
• Communal and regional projects to create more favourable conditions for socio-economic development of the whole poor community.
Vietnam's poverty reduction concept combines these policies and actions, thus securing successful and sustainable poverty reduction over the last decade.
5.2 On structure and implementation of the national poverty reduction programs
The current programs for poverty reduction are tools of the State for implementing poverty reduction concepts. As described in the above sections, they positively influence the reduction of poor households and improvement of socio-economic development of poor communes and regions.
According to our observation, the current national programs have the following
advantages:
(a) The national programs have the right targeting mechanism. The process of targeting of poor households and poor communes includes identification of poor households and communes, based on relatively simple but effective criteria. Selection of targets involves the participation of communities, representatives of local mass organisations and the poor
bottom-up procedure. With this targeting process, the benefits of programs go to the correct addresses and this secures the success of the national programs.
(b) The national programs are an effective mechanism for providing resources directly to
the poorest households, communes and areas. Budget amounts for poverty reduction
goals, which are decided by the highest level of the state administration – the National Assembly – are transferred directly to the addresses of defined targets.
(c) The national programs supply core resources for some key actions for poverty
reduction. With this initial fund, communities and local administrations can mobilise
additional resources, extend the scope of actions and diversify forms of assistance to the poor. In this mean, national programs play the role of driving force for the whole poverty reduction movement. From 2001 to 2003 the fund allocated from the central budget for HEPR was 1,800 billion VND, while the local governments allocated 1,500 billion VND, other programs and development projects spent 1500 billion VND, and communities contributed 700 billion VND for poverty reduction purposes.
Implementation of the current national programs for poverty reduction also shows some problems, which must be studied in order to increase effectiveness and the effects of actions.
(a) In terms of type of activities, the current national programs for poverty reduction focused more on construction of infrastructure and less on enhancing the human capacity of the poor. The major function of Program 135 is to build infrastructure and more than
95% of budget is allocated to this end. HEPR spent approximately 50% of budget on this activity.
Recently, there have been many programs and projects, even large scale ones up to hundreds of million USD, such as the rural infrastructure project with funds from ADB, WB, JBIC and rural roads project from WB. It is roughly estimated that rural infrastructure costs (incl. electricity, drinking water, health facilities and such like) for the next five years to be about 1 billion USD (roughly 200 million USD per annum). Calculations for half the total numbers of communes so far, show us that each will receive about 200 thousand USD (equivalent to 3 billion VND) in the next five years. Although it is tried to avoid the duplication of projects in the same area when planning, in practice there are already many infrastructure projects that overlap. In the mountainous districts of Bat Xat, Bao Thang (Lao Cai province), there were 10 different sources of infrastructure construction. Only for schooling, there were five programs: concretizing schooling, Program 135, infrastructure building program using WB credit, rural infrastructure
can be carried out with grants or credit funds.
In the framework of the national programs for poverty reduction, projects for human development resources, such as training agricultural workers, agricultural extension, make up a small percentage. The activity equipping the poor with business skills and agricultural, forestry and fishery extension knowledge is small in scope while the main causes of poverty are lack of knowledge, techniques and experience of poor households.
It is similar for the training of social workers in charge of poverty reduction work at grassroots level. While they are the leading force implementing the HEPR work in districts, communes, and villages, so far most of them are not trained in the necessary techniques and lack knowledge. The duration of existing training courses is also very short – from 1 to 3 days. During training time, the content of training is generally only focused on communicating and distributing some relevant poverty reduction policies. Improving relevant knowledge and skills for poor communities is not a focus. Besides, communes that have not been listed as poor also do not have budget planning and allocations for staff training.
Demand for full-time HEPR staff at district and commune level is high. Few localities arrange one full-time staff member from their cadres for HEPR at commune level.
Thus, for national poverty reduction programs to be more effective, focus should significantly change toward technical transfer, using this as a milestone to help the poor fight poverty by themselves so making HEPR more sustainable.
(b) In terms of targets, the current national programs focus higher priority on expenses for communes and less for households and individuals. Capital being allocated to direct
intervention in poor households doesn’t ensure efficiency.
As the survey results showed, most poor households are credited. It is a good solution to help the poor to develop their production activities and increase their income. Though if having credit only, it is very hard for the poor to cross the poverty line. Activities and costs for training and technical transfer are still very limited, making it very hard for poor households to gain necessary knowledge of production and business management. Moreover, knowledge needs to be comprehensive both in terms of content and time before they can use the funds. So far these two types of interventions have been separated. Banks provide credit, but different channels do the training. The integration and combination of training and credit is rare.