Musical Noise Generation Analysis for Noise Reduction Methods Based on Spectral Subtraction and MMSE STSA Estimation
4
0
0
全文
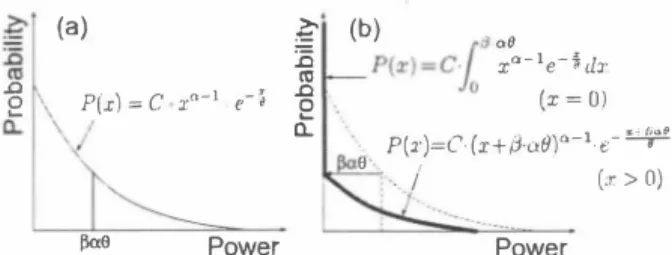
(2) (a) ぎ 守. ‘竺. 会= 2悶ao』 仏. い 九時 , ‘J wo 羽 R L 3 Y6 』U ,a,、 鳴 e IBIIFlIωlML F ヨ ω g hu ] Z N {. { N Zpc sz£. 〉、. (a). 正コ 偲. ê t\ P(xl = c a.. 1 \ /. Xo-1. e-í. (b) , a αe P(x) =c.! xα le→d�' JO (x = 0). て. Fα,6. P(z)=Ci(z+β由。)α4ピヰ争Z ー/ (x > 0). E. 出三ιー. Power. Power. Fig. 2. Shapes of p.d.f. (a) Original signal. (b) Processed signal. artificial signal pl∞essing. Hence, we turn our attention to l.:urtosis change ratio (kurtosis ratio) between before/after signal processing.. priori and a posterioげsignal-to-noise ratios (SNR), res戸C臥!ely. h品1SE STSA can estimate the clean speech spectral anlpl山de as above‘ideally. However, in actual case, we can not know a p円on and a posterior SNR, and thus we estimate白em by the following equatlon,. 《. λ;(m ー 1). 会(m) =ηーよ一一一一 +(1- η)P[れ(m)ー1],. Àd(k, m - 1 ). 0<ワ< 1,. 3.2. Kurtosis ratio in SS. We deriv巴 the relationship hetween kurtosis and the strength of SS Moreover, the relationship between kurtosis of processed signal and kurtosis of unprocessed signal are r巴vealed.. (8). 3.2.1. Gamma distribution lIlodeling. where Ak(川一1) i s the amplitud巴 巴stimator o f the k出 signal spec汀al component in the (111 - l)th analysis企arne, and P[.] is an operator which is defined by. l. P[x] = <. _ 0. I. 江x> O.. We utilize山e garnma dis凶bution as a model of speech or noise sig nal [6). The ganuna dis凶bution have a lot of nseful mathematically a町ibutes which 紅e derived合om白e gamma function The p.d.f. of the garnma distribution is written as. (9). otherwise.. 3. MlJSICAL NOISE METRIC VL主KURTOSIS RATIO. J.I�. (10). μ3 where kurt denotes kurtosis and J.ln is the nth order moment which is given by. E [P(x)] =α(J,. α-. 12y. E[x]. α where y = log( E[x] ) - E[ log x] (see Refs. [7]).. (14). (15) (16). 3.2.2. Kurtosis ofmodeling signal. h出is way of modeling by the g釘凶na distribution. k."Urtosis is deter mined by the shape and the scale p紅白neters as below. At fi.rst, we rt"present the n白ーorder moment as (17) (岨 X"P(x) d x = C. (J"+n . r加的 JO Using (17) and useful relation,r紛=(σ-1)・。. (α-j)T(αーj), we c組 obtain kurtosis of the mod巴led raw signal by the garnma dis往ibution as follows [4).. μn =. JO. Here, P(x) is p.d.f. of白e signal. We consider the SS in power spectral domain, so the integral range is only positive Although we can measure the number of the tonal compon巴nts by kurtosis, note that kurtosis itself is not enough to measure the rnusical noise. This is obvious in that kurtosis of some unpr∞essed signals, e.g., speech signals, is also high, but we do not recogniz巴 speech as musical noise. Jn order to set aside the genuine tonal com ponents, we focus on the fact th.at musical noise is generated only in. 3-γ+、I(y-3)2 +24γ ô=. (. I )." P(x)d x.. (13). σ. where E[.] is an expectation operaωr. Th巴 garnma distribution mod eling is the estimation of the shape and the scale param巴ters from the raw input signal. In出is paper, we use the maximum likelihood estimation rnethod for estimating two pararnetersαand (J, as follows,. ) 1. μn =. r(め= fflf dx. H己reafter, in出is papeにl巴t C = 1 /[T(α) (J ]. lf ()' = 1,血is is白e exponential distribution. It is well known that the average of the g出nma distribution is given by. 3.1. Rel ationsbip between kurtosis ratio and musical noise. kuロ=. (12). JO. In this section, we introduce a basic idea of musical noise evaluation and musical noise metric for SS [4]. Hereinafter we give 組以場 planation of出e adequacy applying the metric to gen巴ral norùinear prω巴ssmg Nonlinear processing, including SS釦d恥仏1SE STSA, often gener ates characteristic isolated power spectral components (see Fig. 1 (a) and (b)). We define the musical noise as the generated audible iso笥 lated sp巴ctral components血rough nonlinear processing τbus we speculate that the arnount of musical noise is highly relat巴d to th巴 number of isolated components and the isolated level of them. Con sequently we realize the evaluation of the isolated components by kurtosis. We could say也at kurtosis can evaluate也e percentage of tonal cornponents in total cornponents. Bigger value indicates a signal with heavy skirt in its probability density function (p.d.fよit means that a signal has a lot of tonal components. Kurtosis is defined as. P(x) =ー土-:::- . xo-1 e-j,. T(,α)(Jcr where x三0,α> 0 and (J > O. Alsoσdenot巴s the shape par組leter and (J is the scale paranleter. The Garnma function is defined by. Consequently MMSE STSA is managed by estimating白e mth frarne spectral gain using previous frarne spectral g出n.. 一向一 一一一 ku広 ー日一 可 岡. μJ. ( α+ 2)(α+ 3) α(α+1). (18). 3ユ3. Change ofmodeling sigllal's kurtosis Í11 processing. SS is regarded as p.d.f. deforrning processing, i.e., lateral shift of p.d.f. (See Fig. 2). Thus processed signal's kunosis depends on the S官'ength of processing. We formulated the deforrned signal's kurtosis. 4434. ハHV 内〈U.
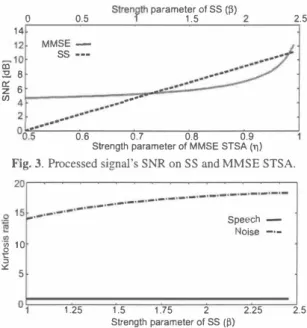
(3) 1ra ble 1. Expected situation of musical noise generation. |. SS. I. 剛SE STSA estimaTor. 14. I. 12f. _1011 国 3:!.8 � 6 cn. (Unclear) Moderate. noise: wb.ite Gaussian noise:. Mixing. e'quivale泊t SNR mixing. I I. Evaluation noml. placed by zero witb 0.01 increments in between SNR 釦d kurtosis ratio of clean speech初d cle組 noise signal. 5. コ 出. Noise. 10. +. ,-. .. o. i. 1.25. ( 1 9). _.. (x=O).. we have. .;- 1 J,.1円一 le-_ �dxl. αの2 .") ,_ , S脚 〈 向吋 �一加-I + 2. (rr+:!)- l. ,. o. 側. ( 2 尺r 小 ケ 柑 f} a門+叫肘叶 CαE一均吻 仙 州w伊le判 dx 壬d. 2. 2. 01 SS (日). 2.25. 2.5. 0.5. 町田・h・田4四,_,田・. ・_,_. 0.6. 0.7. 0.8. Strength parameter 01 MMSE STSA. 0.9. (η). Fig. 5. Relationshíp between noise's and speech's kurtosis ratio and. (, . � " . � .,. "n , . �"" I)+ � " "Î' " . (β叫2 kurt括〉一一一{(α+2)(肘3)+向(a+2)(av �' (α-3)(σ一叫 '' 2 ' 一α(α+ 1) l' J (22) Here,αdenotes tbe shape par創neter of modeled garnma distribution, andβís tbe p紅四leter of SS processing strengtb. Thus ku巾.SIS ralto ín SS can be given as. th巴S釘巴ngth parameter MMSE STSA (.,,).. apply tbe above-mentioned tbeoη! to speech-noise mixed signal, and obtain the following theoretical prediction about tbe gen巴rat巴d mu sical noise when SS is applied to speechjnoíse-dominant íntervals. Speech signal has higher kurtosís than noise signal, in general. kurt.s. Therefore generated musical noise in speech-domínant intervals is. = l.'Urtorg. バ βα (α ー 1) Gβα)2(α-2)(a - 1) Î e吋{l +一一 一一一+ = ト (α+ 3) 2 (α+ 2)(σ+ 3) J 1. Speech・ Noise 田市. F"・由畠幅・岨唱帽. 。. Thus p叩c∞芯s鉛sed s凱19I伊】al's kur式tos釘:is is est“imat犯.ed as. M凶s ralto. 1.75. the s田ngth parameter of SS (,β). Aω I the 2nd-order moment ís estimated as belo哨,. x+リβ. 1.5. Strength parameter. Fig. 4. Relationship between noise's and speech's kurtosís ratio and. (X〉O).. Here we appro啄imate (x+ β αw - I in (19) by Tay lor exp組sion, and. ρω心[fx(a門α. _,_. 5. 。。 ,,戸OEa凋骨内。 0 2 偲 』 ω一 的 o t コ リL. (c. (x βー αe)αーl eーヰd ,:s lC._ tcr�9 x"._ 九- �ûdx. P(x) = {. (η). Speech -. s田ngth parameter: configure from 0.5ω0.99. signal is w吋tten as. 子2 [ドO:. 0.9. 201. negative power compollellts訂e re. and change ofkmtosis in SS[4]. The resultant p.d.f. of the processed. μ2. 0.8. 0.7 S廿ength parameter of MMSE STSA. Fig.3. Processed s氾nal's SNR on SS and MMSE STSA.. S仕engtb parameter: configure仕om0 to 2.5 with. MMSE STSA. 0.6. 0.5. 0.05 increments in between floorillg:. ___. 2. speech: Japan News Article Sentences SS. 2.5. MMSE噛由 SS. .. 時• r ---_.. --__-f .. .. .. __--0..4... Table 2. Su句巴ctive evaluation conditions Database. Stren g th parameterol SS (ß) 1.5 1. 0.5. 。. relatively less. Conversely, a lot of musical nO.ises generate in noise. (23). Also we found that tbe musical noise metric based 0司kurtosis ra tio is highly related with the amount of perceived musical noise by hum釦[4). Kurtosís ratio is strongly related witb tbe generated isolated. components in nonlinear processing, Thus we can evaluate the de gree of generated musical noise according to magnitude of kurtosís ratio value,. only intervals because noíse signal ís low kurtosís signal, e.g., Gaus SJan nOlse. On the otber h組d, we can not formulate generated musical noise amoUl1t in },仏1SE STSA estimator, but we can s凶speculate出e de gree of generated musical noise in only instance of noise intervals Here, we suppose that noise signal is stationary and has low kurto sis. In血is inst組ce, the obtained spectral gain by r-.仏1SE STSA es timator is stationary and small value in noise intervals. Thus output signal's p.d.f. does not change so rnuch frorn original one. Conse quently, the amount of generated musical noise is less白組曲e case. 4. THEORETlCAL ANALYSIS As indicated in. of using SS. Howev巴r, in speech intervals. we can not forecast be. (23), we can now白nd a relatíonship between the. amount of generated musícal noíse in SS and the orígínal sígnal's. cause the estimation of spec仕al gain using a. prior and a posterior. SNR depends on previous合出ne and is ex出mely complicated. k.'Urtosís. That ís, SS for hígh k'Urt . osis sígnal (αís small) results in. Table 1 lists the summary of the points about musical noise gen. less musical noise than SS for low kurtosís signal (αis laτge) even. eratíon. We will confirm the predictioTls and bring out the unclear. if we set tbe fixed subtraction parameter β.百lUS in tbis paper, w巴. points with 巴xperiment in the next section.. 4435. 司ペU 114.
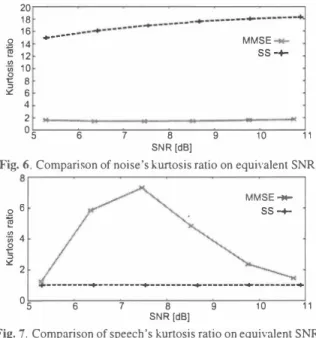
(4) 20. 16. ,g �. �. 14. F-_ .. ...・p 噌p ・・・・. 一 � 一一 一一 ・..---・・-一ー. 一一一 ・・ 司h・・・・・・・・・ 一ー一 -�----ー・. i. SS -←. 12. 10 6 6. 4. 2. 0. 6. 5. 7. B. SNR. [dBl. 9. 11. 10. Fig.6Compariωn of noise's k.-uれosis ratio on equivalent SNR 61. ozm』ωm。亡コ¥. au aa守内,‘ 0. (a) Original. 否6�. MMSE .... ←. 4. nu noco a匂内4 比 @』 廿 コ ω t hu uz UN工 {. '5. ピ. 16. MMSE-骨・ SS・←. -・・・・・・・・砂・・・・・・・・・司p--------�--------司þo --------咽・-. 5. 6. 7. B SNR. [dBl. 9. 10. 1.2. 11. Fig. 8. Spectrogram (a) Original speecb signal. (b) SS processed. Fig. 7. Comparison of speecb's kurtosis ratio on equivalent SNR.. speecb signal (SNR signal (SNR. 5. EXPERIMENT. = 11. =. 1 1 dB). (c) r.仏,fSE STSA processed speech. dB). mo凶y accepted theOlγthat �仏1SE STSA is superior to SS in terms. 5.1. Conditions We conduct an experiment and 0同巴ctive evaluation for musical noise on SS and MMSE STSA. One of our great inter巴st is cornparative merits and dem巴rits of SS and 1仏1SE STSA. Particularly. we are interested in the difference on the degree of gen巴rat巴d rnusical noise between both m巴thod,ωd betw巴en both signal of speech or noise. Conditions of experiment are listed in Table 2.. 1.4. Time(s). The s町ength. of musical noise. It is stiU仕ue凶noise-only p紅t. but, in speech. dominant part. rhis is misconceprion.τrus new tìndi.ng is con且nned by spectrogram (Fig. 8). Spectrogram of SS processed signal shows the degradation of speech signal but we can not detect the isolated component. On the other hand, spec甘ogram of 1仏1SE sbow the apparent isolated components. Th i. s is consist巴nt with our subjec tive impressions. Consequently 1ぬ1SE STSA gen巴rat巴s the isolated. parameter of MMSE STSA is set to comrno叫y-used value and the. components in speech signal and we have consci.ous access to mus】. strength parameter of SS is controlled as to 巴qual SNR perfoπnance. cal noise.. of noise r巴duction.. 6. CONCLUSION. 5.2. Results. We analyze the degree of generated musical noise in SS and MMSE. Figure 3 depicts processed signal's SNR on SS and �仏1SE STSA. As we can see from Fig. 3, both出巴 upper 1凶út performance of MMSE STSA and SS are about 1 1 d.B. Figur,巴s 4 and 5 show the re. STSA. Also we came up with the novel fact about bow to character isti.c generate musical noise in 1仏1SE STSA.. 7. REFERENCES. lationship between k.-urtosis ratio and the strength p紅ameter of each method. In SS. as we expected, kurtosis ratio is smaller value in. [ 1 ] S. F. Boll, "Suppression of acoustic . noise in spe巴:ch using spec 住al sub甘acti.on," IEEE Trans. Acoustics. Speech, Signal Proc., voI.ASSP-27, no.2, pp. I 1 3-1 20 , 1979. [2] Y. Ephraim and D. Malah,“Speech Enhancement Using a Min・. speech int巴rvals than noise int巴rvals. This is because kurtosis ratio in SS depends on unprocessed signal's original kurtosis On the other band, in r.仏1SE STSA, noise's kurtosis rati.o is very small. but speecb's kurtosis is very high and changes rapidly. It is particular note around commonly-used pararneter.. 1m凶n Mean-Square Error Short-Time Spec仕al Arnplitude Esti. This phe. mator," IEEE Trans. Acoustics. Speech and Signal Proc., vo1 . 32,. 出e sむengtb parameter of 1仏1SE STSA estimator and musical noise. no.6, pp . I I0 9- 1 1 2 1 , December 1984 [3] M. Kato, et a1.,“Noise Suppression with High Speech Quality. via the sllbjective evaluation [2]. Consequently, in SS, musical noise. Based on Weigbted Noise Estimation and r.仏1SE STSA (Digi. nomenon has already contìrrned as白e sensitive relationship between. mainly arises in noise interval, on another front,出払仏1SE STSA, tbe. tal Signal Processing)“IEICE Trans. FlIndamentals, vo1.E85 -A,. problem of musical noise generation is mainly boiled up in speech. no目7, July 2002. [4] Y. Uemura, et al.,“Automatic Optimization Scb巴me of Spectral. interval.. Subtraction Based on Musical Noise Assessment via Higher. We compar巴 MMSE STSA with SS in t巴rms of the degree of generated musical noise. Figures 6 and 7 present the kurtosis ratio. Order Statistics"ハμ4.ENC. 2008 [5] J. Li, et al.,“ nOls巴 r巴duction based on adaptiveβ-order g巴n. sults are v巴ry mt巴resting. Figure 6 shows the familiar phenomenon. eralized spectral subtraction for speech enhancement,"刀VTER・. on SS and MMSE STSA in condition of 巴quivalent SNR. These re. SPEECH, pp,802-805, 2007. [6] T. H. Dat, et al..“Gamrna modeling of speech power組d its. of SS tbat th巴 amount of generat巴d musical noise in SS is very much and gradually increasing as bigg巴r the s廿ength p紅白n巴ter, on the. on-li.ne estimati.on for statistical speech enhancement," IEICE. other hand, it is less in MMSE STSA. Figure 7 presents the interest. Tmlls. INF & SYST. vol.E89 -D, no.3, 2006 [7] M. Evans, et al., Statistical Distriblltions, 2nd ed. Wiley. 1 993. ing result that恥仏l.SE STSA generates more musical noise in speech signal than SS. This is a new findi.ng. We have believed tbe corn-. 4436. 円,l副 作、u 句14.
(5)
図
関連したドキュメント
In summary, based on the performance of the APBBi methods and Lin’s method on the four types of randomly generated NMF problems using the aforementioned stopping criteria, we
In this paper, we extend the results of [14, 20] to general minimization-based noise level- free parameter choice rules and general spectral filter-based regularization operators..
At the same time, a new multiplicative noise removal algorithm based on fourth-order PDE model is proposed for the restoration of noisy image.. To apply the proposed model for
Here we purpose, firstly, to establish analogous results for collocation with respect to Chebyshev nodes of first kind (and to compare them with the results of [7]) and, secondly,
We will show that under different assumptions on the distribution of the state and the observation noise, the conditional chain (given the observations Y s which are not
For instance, we show that for the case of random noise, the regularization parameter can be found by minimizing a parameter choice functional over a subinterval of the spectrum
In order to predict the interior noise of the automobile in the low and middle frequency band in the design and development stage, the hybrid FE-SEA model of an automobile was
For a fixed discriminant, we show how many exten- sions there are in E Q p with such discriminant, and we give the discriminant and the Galois group (together with its filtration of
