Automatic evacuation guiding scheme based on implicit interactions between evacuees and their mobile nodes
15
0
0
全文
(2) 2. Nobuhisa Komatsu et al.. Keywords Automatic evacuation guiding · implicit interactions between evacuees and their mobile nodes. 1 Introduction In the 2011 Great East Japan Earthquake, both fixed and mobile communication networks had not been available for a long time and/or in wide areas, due to damage to communication infrastructures. As a result, it has been reported that disaster victims and rescuers could not smoothly collect and distribute important information, e.g., safety information, evacuation information, and government information, even though they carried their own mobile nodes, e.g., smart phones [13].When disasters occur, disaster victims have to evacuate quickly to near safe places to keep their own safety. Under such situations, it is necessary to grasp the following information: safe places and safe routes to those places. Although they can acquire static information, e.g., map and locations of safe places, in usual time, they cannot grasp dynamic information, e.g., damage situations in disaster areas. Quickly grasping damage situations will help evacuees to determine actions for evacuation, but it is not necessarily easy to grasp the damage situations, e.g., outbreak of fire, collapse of buildings, flood, and cracks in the ground. It is possible to detect the damage situations by cameras and/or various types of sensors, but it has a potential drawback of restriction of coverage area and breakdown of both such devices and/or communication infrastructures. Therefore, the larger the disaster scale is, the more difficult it is for public institutions to quickly investigate damage situations and to distribute such emergency information to the evacuees. Under the background, Fujihara and Miwa proposed an evacuation guiding scheme that relies on cooperation among evacuees [4]. They use a Delay Tolerant Networks (DTN) [3], which is constructed by mobile nodes of evacuees, for communication among evacuees. When evacuees discover blocked road segments during their evacuations, they record the information on their nodes. After that, if they encounter other evacuees, they share these information through direct wireless communication between their nodes, such as Bluetooth and Wi-Fi Direct. Thus, they can find out evacuation routes that do not include blocked road segments, which have already been discovered by others. This scheme is useful because it utilizes mobile nodes that evacuees usually carry and can work without communication infrastructures. It, however, requires evacuees’ operations to record damage situations. Evacuees cannot afford to operate their mobile nodes in disaster areas because they may not be safe near the areas. They have to give top priority to their safety and avoid actions except evacuation until they finish evacuating. To solve the issue, we propose an automatic evacuation guiding scheme using evacuees’ mobile nodes, which can automatically grasp damage situations and guide evacuees. Evacuees can obtain the surrounding map and.
(3) Automatic Evacuation Guiding Scheme. 3. locations of safe places by pre-installing applications for evacuation guiding in their mobile nodes. When disasters occur, the applications calculate evacuation routes with these local information and navigate the evacuees using the routes. In addition, the applications can also grasp the actual evacuation routes of the evacuees, i.e., their trajectories, by measuring their positions periodically. With the help of the implicit interaction between evacuation guiding by mobile nodes and evacuees’ actual evacuations, the applications can automatically estimate blocked road segments and recalculate evacuation routes by using the estimated information of the blocked road segments. As in [4], evacuees share the information about blocked road segments among them through direct wireless communication with other mobile nodes and that with a server via remaining communication infrastructures. Note that we deploy the server on cloud systems to protect the server itself from disasters. Such shared information about blocked road segments will help evacuees who are late for evacuations. We evaluate the effectiveness of the proposed scheme through simulation experiments. The rest of this paper is organized as follows. Section 2 gives related work. Section 3 describes the proposed scheme. The simulation results are shown in Section 4. Finally, Section 5 provides conclusions and future work.. 2 Related Work Information and Communications Technology (ICT) based support for evacuation in disaster areas can be classified into evacuation planning and evacuation guiding. Evacuation planning is suitable for disasters which are predictable at a certain level, e.g., flood, hurricane, and typhoon. On the other hand, for disasters whose extent of damage is not easy to predict, e.g., earthquake, evacuation guiding in response to damage situations also becomes important. There are several existing studies on evacuation planning [11, 16]. Lim et al. formulate planning of evacuation routes in case of hurricane disasters as a network flow problem and propose an algorithm that can derive optimal solutions maximizing the number of evacuees who succeed in evacuation [11]. Takizawa et al. propose a method to partition appropriately a region into small areas such that a unique evacuation center is located in each area [16]. Considering the difficulty in predicting damage situations caused by an earthquake, e.g., the outbreak of fire and collapse of buildings, they propose a method to enumerate all partitioning patterns. On the contrary, evacuation guiding were originally studied in the field of psychology [15]. Sugiman et al. propose two kinds of evacuation guiding methods: follow-direction method and follow-me method. Both methods assume that a small number of leaders guide many evacuees. Follow-direction method means that each leader indicates a destination for the surrounding evacuees with loud voice and large gesture. On the other hand, follow-me method means that each leader takes the surrounding evacuees along with him/her. This.
(4) 4. Nobuhisa Komatsu et al.. study indicates that communication among leaders and evacuees is important for evacuation guiding. In recent years, proliferation of mobile nodes, e.g., smart phones, open a new vista of evacuation guiding [6, 19, 4]. Iizuka et al. propose an evacuation guiding system using an ad hoc network whose connectivity is almost always guaranteed [6]. It can present evacuees with both evacuation routes and timing to avoid crowds of evacuees. Winter et al. propose an evacuation guiding system using evacuees’ trajectories [19]. Evacuees continuously measure their trajectories by their mobile phones, share the trajectories with others through direct wireless communications, and try to find out available paths to safe places using the collected trajectories. As in the proposed scheme, Fujihara and Miwa propose an evacuation guiding scheme using a DTN, which is more inferior to an ad hoc network [4]. Note that the existing scheme in [4] requires evacuees’ operations to their mobile nodes to record information about blocked road segments, while the proposed scheme can automatically estimate the blocked road segments without any evacuees’ operations. It has been pointed out that movement of evacuees and rescuers has a great impact on how information propagates through direct wireless communications among them [1,17, 12]. Aschenbruck et al. propose a movement model which simulates rescuers’ movement after disasters occur [1]. It shows that characteristics of end-to-end packet loss rate and delay are different between conventional random way point model and the proposed model. In [12], Mart´ın-Campillo et al. compare the performance of various DTN routing protocols under the movement model proposed in [1]. Uddin et al. propose a crowd’s movement model after hurricanes occur and evaluates inter-meeting time between mobile nodes and the number of neighboring nodes [17]. In this paper, we assume that evacuees try to evacuate according to the evacuation routes presented by the evacuation guiding applications but autonomously avoid blocked road segments on the routes by their own decisions. There is a project that aims to construct a distributed regional network, called NerveNet, for robust communication infrastructures [7]. NerveNet can supply users with a local and stand-alone communication network, which consists of base stations that function as both wireless access points and servers. The proposed scheme can effectively navigate evacuees by deploying the cloud systems into this kind of regional networks. There are several studies on automatic estimation/detection of blocked road segments [2, 10,14]. In [2], Chen et al. propose a real-time detection scheme of anomalous trajectories from GPS trace data collected by taxis. Such anomalous trajectories will help the estimation of blocked road segments. Kumar et al. propose a system to detect road hazards by collecting information from Twitter and analyzing the obtained data [10]. Samadzadegan and Zarrinpanjeh propose a scheme to detect blocked road segments by analyzing satellite imagery using fuzzy inference systems [14]. As in [2], we also focus on anomalies of evacuees’ trajectories but the proposed approach to detect such anomalies is quite different from that in [2]. The proposed scheme enables automatic estimation of blocked road segments based on implicit interaction.
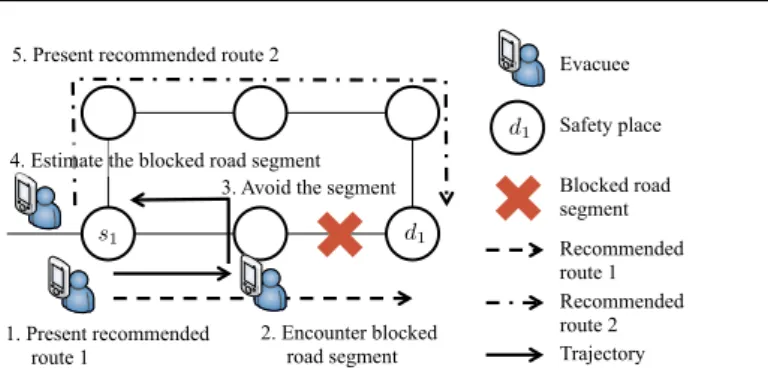
(5) Automatic Evacuation Guiding Scheme. 5. 5. Present recommended route 2 . Evacuee . d1 4. Estimate the blocked road segment 3. Avoid the segment . d1. s1. 1. Present recommended route 1 . 2. Encounter blocked road segment . Safety place Blocked road segment Recommended route 1 Recommended route 2 Trajectory . Fig. 1: Flow of evacuation guiding.. between evacuees and their mobile nodes, which can be conducted at each mobile node in a distributed manner.. 3 Proposed Scheme 3.1 Preliminaries G = (V, E) denotes a graph representing the internal structure of the target region, where V is a set of vertices, i.e., intersections, and E is a set of edges, i.e., roads in the map. There are K (K > 0) evacuees in the region and each of them has a mobile node. K = {1, 2, . . . , K} denotes the set of all the nodes. Each node k ∈ K measures its own locations by using Global Positioning System (GPS) at a certain interval of IM (IM > 0).. 3.2 Fundamental Scheme in Evacuation Guiding Using Trajectories Fig. 1 illustrates the flow of guiding one evacuee to a safe place. Note that the evacuee has to pre-install an application for evacuation guiding into his/her mobile node before disasters occur. The application obtains the surrounding map of the target region and the location information of the safe places in usual time. When disasters occur, the evacuee initiates the application on his/her node. The application first finds out the nearest safe place d1 from the location s1 of node k, which was recorded on start-up. Next, it calculates an evacuation route pbks1 ,d1 and presents him/her the route as a recommended route (Step 1 in Fig. 1). The recommended route can be calculated by existing graph search algorithms, e.g., Dijkstra’s shortest path algorithm. The evacuee tries to move along the recommended route. When the evacuee discovers a blocked road segment during his/her evacuation along the recommended route pbks1 ,d1 (Step 2 in Fig. 1), he/she will take another route by his/her own judgment (Step 3 in Fig. 1). The application can trace his/her.
(6) 6. Nobuhisa Komatsu et al.. actual evacuation route as the trajectory by measuring his/her positions periodically. Thus, the application can detect the road segment e ∈ E, which yields the difference between the recommended route and the actual evacuation route (See the details in Section 3.3). The application adds the road k segment e to the set ENG of blocked road segments (Step 4 in Fig. 1). After that, the application recalculates the nearest safe place d2 from the current location s2 . Next, it also recalculates a new evacuation route, which does not k include blocked road segments (∀e ∈ ENG ), and presents him/her the route (Step 5 in Fig. 1). The succeeding flow is the same as that for the first recommended route pbks1 ,d1 (Note that s2 = s1 , d2 = d1 in Fig. 1). Evacuation guiding finishes when the evacuee reaches the safe place or the application cannot find out any evacuation route to any safe place. In addition, the evacuee may encounter other evacuees and get a chance to communicate with infrastructures during his/her evacuation. Under these situations, the application will obtain new information about blocked road segments (See the details in Section 3.4). Then, it recalculates a new recommended route and present it to him/her.. 3.3 Estimation of Blocked Road Segments This section describes how the application estimates blocked road segments by using difference between the recommended route and the evacuee’s actual evacuation route, i.e., his/her trajectory. Suppose that the application of node k ∈ K shows its evacuee recommended route pbks,d between source s ∈ V and destination d ∈ V on map G. Recommended route pbks,d is given by a sequence of edges constructing the route, i.e., (eks,m1 , ekm1 ,m2 , . . . , ekmH−1 ,d ). Here, H denotes the number of edges in pks,d . For simplicity in description, we assume that s = m0 and d = mH . Note that mh ∈ V (h = 0, . . . , H), ekmh ,mh+1 = (mh , mh+1 ) ∈ E (h = 0, . . . , H − 1). Next, we focus on the trajectory of node k. Let lik denote location that node k measures at i-th (i = 1, 2, . . .) interval. lik is a two-dimensional coordinate composed of latitude and longitude. We require to map lik into graph G, because recommended routes are calculated over graph G. The process of estimating user’s positions on road segments is known as map matching [5]. The proposed scheme can apply any kind of the map matching techniques and some of the existing map matching techniques can achieve very high correct segment identification percentage, e.g., more than 95 % [5, Table 2]. In this paper, to focus on the effectiveness of the proposed scheme itself, we assume that lik is appropriately located on one of the edges, eki , in graph G. As a result, the trajectory of node k can be expressed by the sequence (ek1 , ek2 , . . .). The following phenomena may happen depending on the value of measurement interval IM . If IM is extremely small, eki and eki+1 may be identical for some i. In this case, the application can obtain trajectory pk of node k by eliminating the duplicate edges. On the other hand, if IM is extremely large,.
(7) Automatic Evacuation Guiding Scheme. 7. eki and eki+1 may not be connected on graph G. In this case, the application has to interpolate edges (road segments) between them. To reduce the trajectory disconnection problem, IM should be appropriately determined according to both the distribution of edges’ lengths and evacuees’ moving speed. IM also plays an important role in controlling the trade-off between battery consumption and response time of mobile applications. Small (resp. large) IM results in high (resp. low) battery consumption but short (resp. long) response time. All of the above features indicates that IM should be a moderate value, e.g., 10 [s]. For simplicity in explanation, we assume that eks,m1 = ek1 and the evacuee judges at the vertex mh−1 whether road ekmh−1 ,mh (h = 1, . . . , H) on the recommended route is a blocked road segment. When the evacuee finds out that the h-th road ekmh−1 ,mh on the recommended route pbks,d is a blocked road segment, k he/she selects another road ekmh−1 ,o (ekmh−1 ,o = (mh−1 , o) ∈ E \ ENG , o ̸= mh ) rather than ekmh−1 ,mh by his/her own decision. Here, the recommended route is given by pbks,d = (eks,m1 , . . . , ekmh−2 ,mh−1 , ekmh−1 ,mh , . . . , ekmH−1 ,d ) and his/her trajectory is as follows: pk = (eks,m1 , . . . , ekmh−2 ,mh−1 , ekmh−1 ,o ). Thus, when the application compares the recommended route and the trajectory, it will obtain the list of consensus edges (dotted lines) followed by the different edge (solid lines). As a result, the application can estimate and record the edge ekmh−1 ,mh on the recommended route as a blocked road segment. 3.4 Information Sharing As mentioned above, the application of each node k ∈ K automatically obtains k the information about trajectory pk and blocked road segments ENG on the way to the safe place. If nodes can share these information among them, the information acquired by evacuees at the early stage of evacuation will help evacuees who delay in evacuating. There are two ways to share the information among nodes: direct wireless communication among nodes and communication with the server via remaining communication infrastructures. As in [4], information sharing through direct wireless communication can be achieved by existing DTN routing protocols, e.g., epidemic routing [18]. When node k encounters node j (k, j ∈ K, k ̸= j), they exchange the information about discovered blocked-road-segments and update their local databases with it. Note that the encountering applications need not exchange their trajectories, because they do not directly use the trajectories for evacuation guiding. After disasters occur, communication infrastructures may be still available in the part of region. When the node can communicate with edge nodes of.
(8) 8. Nobuhisa Komatsu et al.. the communication infrastructures, e.g., access points of wireless LANs and base stations of cellular networks, it tries to access the cloud systems through the edge nodes. The cloud systems have databases to maintain information collected by mobile nodes, i.e., blocked road segments and trajectories. The application and cloud systems first exchange their own information of blocked road segments with each other. In addition, the application can also upload the information about its own trajectory to the cloud systems because the transmission rate between the node and the communication infrastructure is sufficiently high.. 4 Simulation Results Through simulation experiments, we evaluate the proposed scheme in terms of the following points: effectiveness of the proposed scheme, impact of disaster scenarios, and effect of information sharing.. 4.1 Simulation Model We used the ONE simulator [8]. We also used the street map of Helsinki, which is included in the ONE. The size of the map is 4500 [m] × 3400 [m] and its internal graph structure consists of 1578 vertices and 1986 edges. We assume that one thousand evacuees with their own mobile nodes start evacuating from initial positions, each of which is randomly chosen from the points on the streets of the map. In addition, we set one safe place near the center of the map, which has access to the Internet via communication infrastructures. We set the simulation time to be 7200 [s]. When the simulation starts, a disaster occurs and each of evacuees starts evacuating from their initial positions to the safe place at moving speed of 4 [km/h]. Each node calculates the recommended route by using Dijkstra’s shortest path algorithm. To reveal fundamental characteristics of the proposed scheme, we set the cost of each edge (road segment) to be static, i.e., the edge distance. If there are multiple routes with the same cost, mobile nodes randomly choose one of the routes. Dynamic edge cost, e.g., congestion degree on the edge, would help alleviate traffic congestion among evacuees. We set measurement interval IM to be 10 [s], which is obtained at the preliminary experiments and small enough to avoid the trajectory disconnection problem as mentioned in Section 3.3. We assume that direct wireless communications among nodes are given by either Bluetooth or Wi-Fi Direct whose transmission ranges RD are 10 [m] and 100 [m], respectively. We also assume that communications between nodes and servers are supported by Wireless LANs whose transmission ranges RS are 100 [m]. Wireless LAN access points are located at N × N grids. We define coverage as the ratio of the area of roads included in the transmission ranges of the access points to the whole area of all roads. We can control the coverage by changing N ..
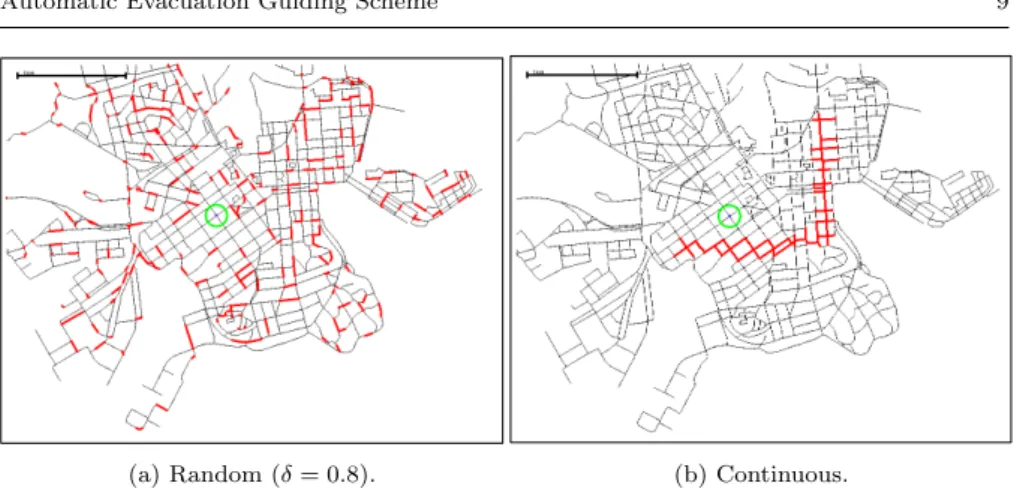
(9) Automatic Evacuation Guiding Scheme. (a) Random (δ = 0.8).. 9. (b) Continuous.. Fig. 2: Disaster scenarios.. We use two kinds of disaster scenarios: random disaster scenario and continuous disaster scenario. We use the random disaster scenario as default, in which we randomly choose a certain number of edges on graph G as blocked road segments. We evaluate the degree of disaster by evacuation possibility, δ (0 ≤ δ ≤ 1), which is defined by the probability that evacuation routes exist from arbitrary points to the safe place. In what follows, we change the degree of damage by controlling δ. Fig. 2a illustrates the random disaster scenario with δ = 0.8, where red lines mean blocked road segments and a green circle means the safe place. In the continuous disaster scenario, we select blocked road segments in a continuous manner, as shown in Fig. 2b. Note that we set the area of the continuous blocked road segments in Fig. 2b to be almost identical to that of the random blocked road segments in Fig. 2a. We evaluate the following two evacuation schemes for comparison. In ideal evacuation, all evacuees know all blocked road segments at the start of evacuation. In normal evacuation, evacuees only use the map and the information about blocked road segments that are discovered during their own evacuations, which can be regarded as the proposed scheme without information sharing. We assume only 100σ (0 ≤ σ ≤ 1) percent of the evacuees can initially set their destinations to be the safe place. Each of the remaining evacuees first moves to a place randomly chosen in the map and can follow other evacuees with the knowledge of safe place when he/she meets them [15]. We use average evacuation time Tavg , maximum evacuation time Tmax , and evacuation ratio as evaluation criteria. The evacuation time of an evacuee is the time interval from the evacuation start to the evacuation completion. We define the evacuation ratio as the ratio of evacuees that have finished evacuating to all evacuees. The succeeding results are the average of 100 independent simulation experiments..
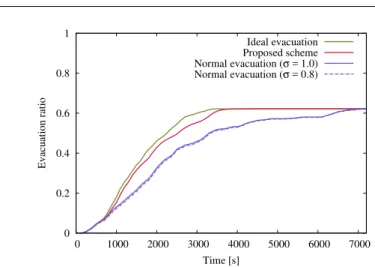
(10) 10. Nobuhisa Komatsu et al.. 1. Ideal evacuation Proposed scheme Normal evacuation (σ = 1.0) Normal evacuation (σ = 0.8). Evacuation ratio. 0.8. 0.6. 0.4. 0.2. 0 0. 1000. 2000. 3000 4000 Time [s]. 5000. 6000. 7000. Fig. 3: Transition of evacuation ratio. 4.2 Effectiveness of Proposed Scheme Fig. 3 illustrates the transition of evacuation ratio for the evacuation schemes: ideal evacuation, proposed scheme, and normal evacuation. Note that we set σ to be 0.8 and 1.0 in case of normal evacuation. Other parameters are given as follows: δ = 0.6, RD = 100, and the coverage is about 7 % where N = 5. First, we observe that the normal evacuation with σ = 0.8 shows almost the same result compared to that with σ = 1.0. This reminds us of the importance of cooperation among evacuees even if evacuees share only the location of safe place during their evacuations. Next, we compare the results of proposed scheme, ideal evacuation, and normal evacuation with σ = 1.0. Note that ideal evacuation and normal evacuation with σ = 1.0 correspond to the best case and the worst case of the proposed scheme, respectively. The evacuation ratio of the proposed scheme increases faster than that of normal evacuation with σ = 1.0. As a result, Tavg (resp. Tmax ) of the proposed scheme becomes about 28 % (resp. 47 %) shorter than that of the normal evacuation with σ = 1.0. On the contrary, comparing the results between the proposed scheme and the ideal evacuation, we observe that the proposed scheme can hold the increase of Tavg (resp. Tmax ) to about 10 % (resp. 11 %).. 4.3 Impact of penetration ratio of the proposed application In actual situations, the ratio of evacuees with the proposed application, penetration ratio ρ, may be less than one. We assume that 100ρ percent of the evacuees have the proposed application and play the role of leaders in the conventional evacuation guiding methods, i.e., follow-direction/follow-me method. The remaining evacuees without the proposed application initially move to.
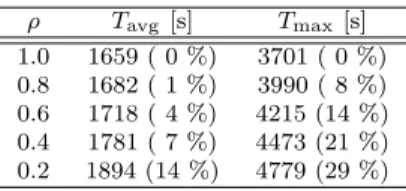
(11) Automatic Evacuation Guiding Scheme. 11. random destinations. When they meet leaders, they can follow the leaders. Table 1 presents the relationship between ρ and average/maximum evacuation time. We also give the degree of deterioration compared with the case of ρ = 1.0 in parentheses. We first observe that Tavg monotonically increases with decrease of ρ but the percentage of increase is suppressed at most 14 % even in case of ρ = 0.2. This indicates that the proposed scheme can effectively support many evacuees even in relatively low penetration ratio. On the other hand, we also find that the proposed scheme cannot sufficiently support the evacuee with the maximum evacuation time if ρ is 0.4 or below. Since such an evacuee does not have the proposed application and starts evacuating from a position distant from the safe place, he/she will require much time to meet leaders.. 4.4 Impact of Disaster Scenarios The effectiveness of evacuation guiding depends on the disaster scenarios. In this subsection, we evaluate the evacuation schemes in terms of degree of damage and pattern of damage. Other parameters are given as follows: RD = 100 and the coverage is about 7 % where N = 5. 4.4.1 Impact of Degree of Damage Fig. 4a illustrates the transition of evacuation ratio for the proposed scheme and normal evacuation (σ = 1.0) when δ is set to be 0.6 and 0.8. We observe that the evacuation ratio of the proposed scheme increases faster than that of the normal evacuation (σ = 1.0), regardless of the degree of damage. Average (resp. maximum) evacuation time of the proposed scheme is about 10 % (resp. 7 %) shorter than those of the normal evacuation (σ = 1.0) when δ is 0.8. Comparing the results of δ = 0.6 and those of δ = 0.8, we find that the larger the degree of damage is, the higher the effectiveness of the proposed scheme becomes. In the random disaster case with high δ, evacuees can easily find alternative evacuation routes by themselves when they encounter blocked road segments. Fig. 4b shows the relationship between initial locations of evacuees and the improvement of their average evacuation times when δ = 0.8. We define the norm pro pro norm )/Tavg , where Tavg − Tavg improvement of average evacuation time as (Tavg Table 1: Impact of the penetration ratio of the proposed application. ρ 1.0 0.8 0.6 0.4 0.2. Tavg [s] 1659 ( 0 %) 1682 ( 1 %) 1718 ( 4 %) 1781 ( 7 %) 1894 (14 %). Tmax [s] 3701 ( 0 %) 3990 ( 8 %) 4215 (14 %) 4473 (21 %) 4779 (29 %).
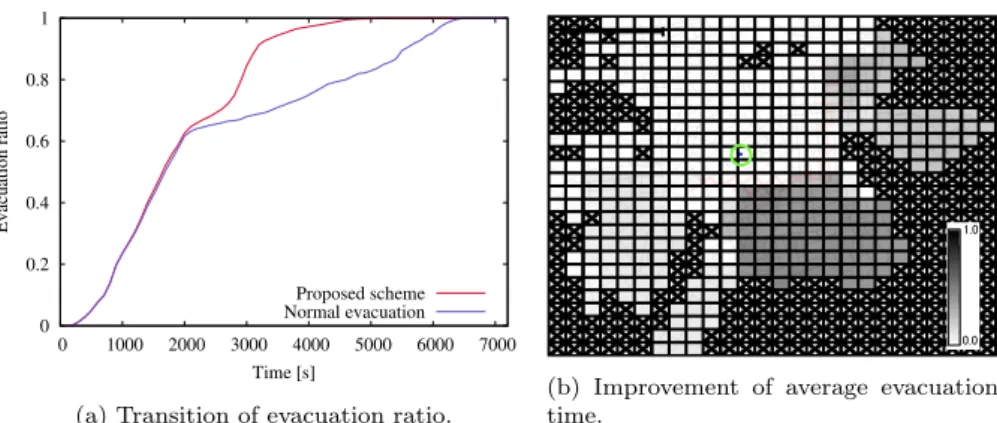
(12) 12. Nobuhisa Komatsu et al. 1 δ = 0.8. Evacuation ratio. 0.8 δ = 0.6 0.6 0.4 1.0 . 0.2. Proposed scheme Normal evacuation. 0 0. 1000. 2000. 3000. 4000. 5000. 6000. 0.0 . 7000. Time [s]. (b) Improvement of average evacuation time (δ = 0.8).. (a) Transition of evacuation ratio.. Fig. 4: Impact of degree of disaster (random disaster scenario). 1. Evacuation ratio. 0.8 0.6 1.0 . 0.4 1.0 . 0.2 Proposed scheme Normal evacuation. 0 0. 1000. 2000. 3000. 4000. 5000. 6000. Time [s]. (a) Transition of evacuation ratio.. 0.0 . 7000. (b) Improvement of average evacuation time.. Fig. 5: Impact of pattern of disaster (continuous disaster scenario). norm are Tavg of the proposed scheme and that of the normal evacuation and Tavg (σ = 1.0), respectively. We divide the whole area into 25 × 25 grids. In each grid, we calculate the average evacuation time among evacuees whose initial locations are included there. The dark (light) color means high (low) improvement. As we expected, evacuees distant from the safe place can much improve their evacuations than those close to the safe place.. 4.4.2 Impact of Pattern of Damage We expect that the proposed scheme will be more effective when the blocked road segments are not randomly scattered but spreads over a certain region in the form of lines, e.g., cracks in the ground, or circles, e.g., outbreak of fire. In this subsection, we use the continuous disaster scenario in Fig. 2b. Fig. 5a illustrates the transition of evacuation ratio for the proposed scheme and normal evacuation (σ = 1.0). We first observe that there is almost no.
(13) Automatic Evacuation Guiding Scheme. 13. difference between the proposed scheme and normal evacuation (σ = 1.0) from 0 [s] to 2000 [s]. In this period, evacuees starting from the left top to the blocked road segments can successfully reach the safe place regardless of the evacuation scheme because they are not affected by the disaster. We also find that the proposed scheme can quickly increase the evacuation ratio compared with the normal evacuation (σ = 1.0) after that period. In the normal evacuation (σ = 1.0), the evacuees affected by the disaster, i.e., those starting from the right or bottom to the blocked road segments, first encounter the blocked road segments and move along them in a counterclockwise direction. On the other hand, the proposed scheme can guide those evacuees to avoid the blocked road segments effectively. We can confirm this phenomenon in Fig. 5b, which gives the improvement of average evacuation time for this scenario.. 4.5 Effect of Information Sharing In this section, we evaluate the effect of information sharing based on communication infrastructures and direct wireless communication. In case of the proposed scheme, opportunities of both discovering blocked road segments and information sharing among mobile nodes will increase with the number of evacuees. To evaluate the impact of the number K of evacuees, we compare the results of K = 1000 with those of K = 100. We also set δ = 0.6 in what follows. First, we focus on the effect of communication infrastructure by setting RD to be 0, where the direct wireless communication is not available. Table 2 shows Tavg and Tmax of the proposed scheme where we set K = 1000 and the coverage to be 0 %, 15 %, and 100 %. We also give those results for K = 100 in Table 3. In these tables, we give the degree of improvement compared with the case of 0 % coverage in parentheses. Note that the proposed scheme with 0 % coverage and RD = 0 is equivalent to the normal evacuation (σ = 1.0).As we expected, both Tavg and Tmax improve with the increase of coverage. We observe that the increase of K also contributes to the improvement because large K accelerates to discover blocked road segments. Next, we focus on the effect of direct wireless communication by setting the coverage to be 0 % (N = 0). Table 4 shows Tavg and Tmax of the proposed scheme where we set K = 1000 and transmission range RD to be 0 [m], 10 [m], and 100 [m]. We also give those results for K = 100 in Table 5. The values in parentheses are the degree of improvement compared with the case of RD = 0. As we expected, the increase of RD can shorten both Tavg and Tmax . We also confirm that the increase of K has a large impact on the improvement, because of abundant opportunities of direct wireless communication. Comparing Table 4 with Table 2, we observe that Tavg of RD = 100 is almost the same as that of 100 % coverage when K = 1000. This indicates that the proposed scheme with only the direct wireless communication can effectively guide many evacuees even under highly damaged situations, when the number of evacuees is large. However, we also observe that the communica-.
(14) 14. Nobuhisa Komatsu et al.. Table 2: Effect of communication in- Table 3: Effect of communication infrastructure (K = 1000). frastructure (K = 100). Coverage 100 % 15 % 0%. Tavg [s] 1717 (25 %) 1849 (19 %) 2291 ( 0 %). Tmax [s] 4117 (41 %) 5339 (24 %) 7018 ( 0 %). Coverage 100 % 15 % 0%. Tavg [s] 1827 (20 %) 2052 (10 %) 2291 ( 0 %). Tmax [s] 4841 (31 %) 5546 (21 %) 7018 ( 0 %). Table 4: Effect of direct wireless com- Table 5: Effect of direct wireless communication (K = 1000). munication (K = 100). RD [m] 100 10 0. Tavg [s] 1757 (24 %) 1988 (13 %) 2291 ( 0 %). Tmax [s] 4763 (32 %) 5593 (20 %) 7018 ( 0 %). RD [m] 100 10 0. Tavg [s] 2042 (11 %) 2170 ( 5 %) 2291 ( 0 %). Tmax [s] 5930 (16 %) 6100 (13 %) 7018 ( 0 %). tion infrastructure is still important to improve Tmax . We should note that the information about a blocked road segment discovered by an evacuee is useful for others who are heading for that region. This indicates that information propagation with the opposite direction to evacuations is significant and the use of communication infrastructures is one of the ways that achieve it.. 5 Conclusion In this paper, we proposed the automatic evacuation guiding scheme using evacuees’ mobile nodes to achieve quick evacuation after disasters occur. With the help of the implicit interaction between evacuation guiding by mobile nodes and evacuees’ actual evacuation, the proposed scheme can automatically estimate blocked road segments. Evacuees try to improve their own evacuations by sharing the information about blocked road segments through both direct wireless communication and communication infrastructures. Through simulation experiments, we showed that 1) the proposed scheme works well when the degree of damage is high and/or road segments are continuously blocked, 2) the average evacuation time can be improved even in small penetration ratio of the proposed system, and 3) the direct wireless communication can support many evacuations at almost the same level as the communication infrastructure when the number of evacuees becomes large.. References 1. Aschenbruck, N., Gerhards-Padilla, E., Martini, P.: Modeling Mobility in Disaster Area Scenarios. Performance Evaluation 66(12), 773–790 (2009) 2. Chen, C., Zhang, D., Samuel Castro, P., Li, N., Sun, L., Li, S.: Real-Time Detection of Anomalous Taxi Trajectories from GPS Traces. Lecture Notes of the Institute for Computer Sciences, Social-Informatics and Telecommunications Engineering 104, 63–74 (2012).
(15) Automatic Evacuation Guiding Scheme. 15. 3. Fall, K.: A Delay-Tolerant Network Architecture for Challenged Internets. In: Proc. of SIGCOMM’03, pp. 27–34 (2003) 4. Fujihara, A., Miwa, H.: Disaster Evacuation Guidance Using Opportunistic Communication: The Potential for Opportunity-Based Service. In: N. Bessis, C. Dobre (eds.) Big Data and Internet of Things: A Roadmap for Smart Environments Studies in Computational Intelligence, pp. 425–446. Springer International Publishing (2014) 5. Hashemi, M., Karimi, H.A.: A Critical Review of Real-Time Map-Matching Algorithms: Current Issues and Future Directions. Computers, Environment and Urban Systems 48, 153–165 (2014) 6. Iizuka, Y., Yoshida, K., Iizuka, K.: An Effective Disaster Evacuation Assist System Utilized by an Ad-Hoc Network. In: Proc. of HCI International 2011, pp. 31–35 (2011) 7. Inoue, M., Ohnishi, M., Peng, C., Li, R., Owada, Y.: NerveNet: A Regional Platform Network for Context-Aware Services with Sensors and Actuators. IEICE Transactions on Communications E94-B(3), 618–629 (2011) 8. Ker¨ anen, A., Ott, J., K¨ arkk¨ ainen, T.: The ONE Simulator for DTN Protocol Evaluation. In: Proc. of the 2nd International Conference on Simulation Tools and Techniques, pp. 55:1–55:10 (2009) 9. Komatsu, N., Sasabe, M., Kawahara, J., Kasahara, S.: Automatic Evacuation Guiding Scheme Using Trajectories of Mobile Nodes. In: Proc. of The 12th International Conference on Mobile Web and Intelligent Information Systems, pp. 3–14 (2015) 10. Kumar, A., Jiang, M., Fang, Y.: Where Not to Go?: Detecting Road Hazards Using Twitter. In: Proc. of the 37th International ACM SIGIR Conference on Research & Development in Information Retrieval, pp. 1223–1226 (2014) 11. Lim, G.J., Zangeneh, S., Baharnemati, M.R., Assavapokee, T.: A Capacitated Network Flow Optimization Approach for Short Notice Evacuation Planning. European Journal of Operational Research 223(1), 234–245 (2012) 12. Mart´ın-Campillo, A., Crowcroft, J., Yoneki, E., Mart´ı, R.: Evaluating Opportunistic Networks in Disaster Scenarios. Journal of Network and Computer Applications 36(2), 870–880 (2013) 13. Ministry of Internal Affairs and Communications: 2011 WHITE PAPER Information and Communications in Japan. http://www.soumu.go.jp/johotsusintokei/ whitepaper/eng/WP2011/2011-index.html 14. Samadzadegan, F., Zarrinpanjeh, N.: Earthquake Destruction Assessment of Urban Roads Network Using Satellite Imagery and Fuzzy Inference Systems. The International Archives of the Photogrammetry, Remote Sensing and Spatial Information Sciences 37(B8), 409–414 (2008) 15. Sugiman, T., Misumi, J.: Development of A New Evacuation Method for Emergencies: Control of Collective Behavior by Emergent Small Groups. Journal of Applied Psychology 73(1), 3–10 (1988) 16. Takizawa, A., Takechi, Y., Ohta, A., Katoh, N., Inoue, T., Horiyama, T., Kawahara, J., Minato, S.: Enumeration of Region Partitioning for Evacuation Planning Based on ZDD. In: Proc. of of the International Symposium on Operations Research and its Applications, pp. 64–71 (2013) 17. Uddin, M.Y.S., Nicol, D.M., Abdelzaher, T.F., Kravets, R.H.: A Post-Disaster Mobility Model for Delay Tolerant Networking. In: Proc. of the 2009 Winter Simulation Conference, pp. 2785–2796 (2009) 18. Vahdat, A., Becker, D.: Epidemic Routing for Partially Connected Ad Hoc Networks. Tech. Rep. CS-200006, Duke University (2000) 19. Winter, S., Richter, K., Shi, M., Gan, H.: Get Me out of Here: Collaborative Evacuation Based on Local Knowledge. In: Proc. of Third International Workshop on Indoor Spatial Awareness, pp. 35–42 (2011).
(16)
図
+3

関連したドキュメント
We present and analyze a preconditioned FETI-DP (dual primal Finite Element Tearing and Interconnecting) method for solving the system of equations arising from the mortar
One of several properties of harmonic functions is the Gauss theorem stating that if u is harmonic, then it has the mean value property with respect to the Lebesgue measure on all
2 Combining the lemma 5.4 with the main theorem of [SW1], we immediately obtain the following corollary.. Corollary 5.5 Let l > 3 be
In this paper, under some conditions, we show that the so- lution of a semidiscrete form of a nonlocal parabolic problem quenches in a finite time and estimate its semidiscrete
Related to this, we examine the modular theory for positive projections from a von Neumann algebra onto a Jordan image of another von Neumann alge- bra, and use such projections
The implementation of the standard finite differences scheme is based on the ghost point formulation, which uses second order central difference scheme for Robin boundary conditions
In the special case of a Boolean algebra, the resulting SJB is orthogonal with respect to the standard inner product and, moreover, we can write down an explicit formula for the
Based on sequential numerical results [28], Klawonn and Pavarino showed that the number of GMRES [39] iterations for the two-level additive Schwarz methods for symmetric
