Liquidity Traps and the Limits of Monetary Easing
during Balance-Sheet Recessions
Nabil El Maghrebi
Abstract
This study examines the prevailing conditions of low inflation and liquidity trap that characterize major advanced economies. Despite the strong commitment to unconventional monetary policies and provision of ample liquidity through zero-interest rate policies and quantitative easing, there is a clear failure by central bankers to achieve the two-percent inflation targets. This paper discusses the dynamics of inflation rates and real economic growth, and considers the theoretical arguments about the liquidity trap. It focuses on the expansionary monetary policies adopted by the Bank of Japan in its extensive attempts to shape inflation expectations, and address the long-term effects of the balance-sheet recessions. Thus, it can be argued that the focus on liquidity trap and monetary easing may be misplaced, as the central issue relates to debt accumulation, leveraging, moral hazards, misalignment of incentives, and misallocation of resources rather than the dynamics of the yield curve. It is perhaps the risk-sharing relations rather than risk-transfer relations based on interest rates, that is more conducive to financial stability and more efficient allocation of risk in the society.
1. Introduction
The prospects of low-inflation trap have increased despite the repeated efforts from central banks in Japan and many advanced countries to achieve inflation targets. Central banks around the world have the principal mandate of achieving price stability. The average euro inflation rate following the inception of the European Central Bank (ECB) has not exceeded the two-percent threshold. Price stability is a long-term objective, but the efforts to manage inflation expectations are often justified by strong concerns about the dangers of deflationary pressures, and very low inflation rates.
Conventional wisdom implies that expansionary monetary policies are conducive to higher inflation given the increase in the money supply. The fact that many advanced economies, and
in particular Japan, are still concerned with the prospects of deflation, and the persistence of low inflation expectations, indicates that monetary easing has only provided ample liquidity, but inflation remains elusive. Several rounds of quantitative and qualitative easing programs, in addition to the near-zero interest rate policies, seem to have failed to create an inflationary environment. There may be serious problems with the transmission channels of monetary policy, demand and supply of money, aggregate employment and fixed capital investment, and ultimately the behaviour of prices not only in the goods and services markets but in financial asset markets as well.
This paper examines the low-inflation trap conditions in light of the expansionary monetary policies pursued in the Japanese post-bubble stagnation and the aftermath of U.S. financial crisis. It considers also the impact of monetary policy on price fluctuations in financial markets. The focus is placed on the monetary policy measures undertaken by the Bank of Japan. The next section presents a brief analysis of the history of inflation and economic growth rates and future projections for advanced economies and developing economies. Section 3 discusses briefly some theoretical issues related to liquidity trap. Section 4 addresses the expansionary monetary policies based on zero-interest rates and quantitative easing programs. Section 5 concludes the paper.
2. Analysis of the relation between economic growth and inflation
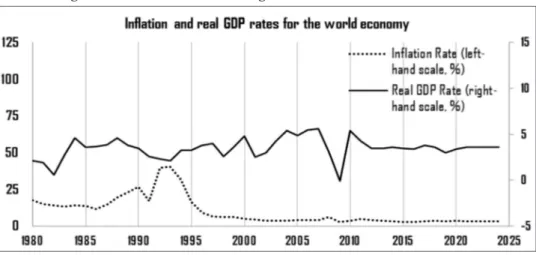
It is possible to understand the historical relation between inflation and growth rates with reference to Figures 1, 2 and 3, which report the time-series of inflation rates as well as real GDP growth rates for the world economy, major advanced economies, and emerging market and developing economies, respectively. The historical values are based on average consumer prices, with annual percentage changes over the period from 1980 and 2019. The estimates and projections by the International Monetary Fund (2019) for the subsequent five-year period from 2020 to 2024 are based on the statistical information set available until September 2019. It is clear from Figure 1 that, historically, the benchmark inflation rate for the world economy reached its highest levels around 40 percent in the early 1990s, but remained at single-digit levels afterward. The historical rate of economic growth remained positive over the whole period, and reached its peak ahead of the U.S. financial crisis before recovering to levels comparable to the pre-crisis rates of global growth rates in economic output.Figure 1- Inflation and economic growth rates for advanced economies
Source: Author’s chart based on IMF statistics 2019
It appears also that the relation between inflation and economic growth rates is similarly structured for emerging market and developing economies, as shown in Figure 2. These economies seem to follow similar patterns of simultaneously decreasing inflation and economic growth rates. There is however a tendency for extremely higher inflation rates over the decade running from 1989 to 1998, which seems to exert strong influence on the behaviour of inflation rates for the world economy. The real GDP rates of growth for emerging market and developing economies follow also similar patterns as the behaviour of growth rates for the world economy. It seems however that the rates of growth for the latter remain lower than for developing economies, which may be a natural result of lower growth rates for more advanced economies.
Figure 2- Inflation and economic growth rates for advanced economies
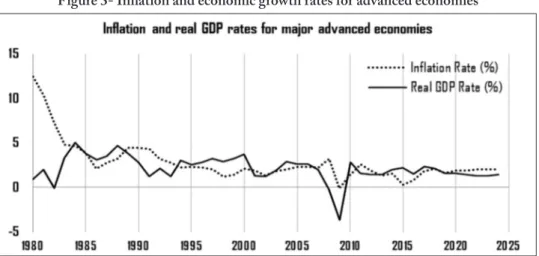
Judging from Figure 3, there is a more synchronous behaviour of inflation and growth rates for the G7 advanced economies. Indeed, with the exception of the early 1980s where a wider gap between higher inflation rates and lower growth rates can be observed, both rates seem to move in tandem. The U.S. financial crisis provides a clear demonstration of the strong tendency for both inflation and growth rates to fall simultaneously in association with expectations of lower consumption and lower investment.
Figure 3- Inflation and economic growth rates for advanced economies
Source: Author’s chart based on IMF statistics 2019
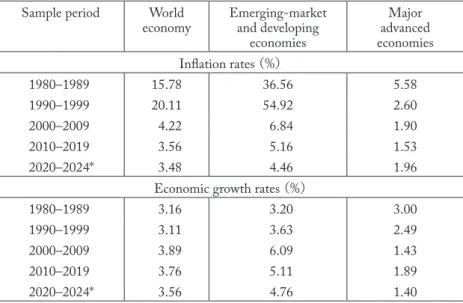
It is possible to understand the dynamics of inflation and growth rates using the average values during different subperiods from 1980 to 2019. It is clear from Table 1 that inflation rates were highest in the 1980s for the major advanced economies, but in the 1990s for the world economy and emerging market and developing economies. A monotonous decrease in average inflation rates is observed over the 2000s and 2010s for each of the analytical groups. The mean values for economic growth rates present a slightly different picture. Growth rates are, on average, highest in the 1980s for major advanced economies, but in the 1990s for the World economy as well as the emerging market and developing economies. Over the three decades from the 1980s to 2000s, there seems to be, indeed, a gradual deceleration in average economic growth for major advanced economies, which stands in sharp contrast with the gradual acceleration for world economies and emerging market and developing economies.
Table 1- Average annual inflation and economic growth rates
Sample period World
economy Emerging-market and developing economies Major advanced economies Inflation rates (%) 1980–1989 15.78 36.56 5.58 1990–1999 20.11 54.92 2.60 2000–2009 4.22 6.84 1.90 2010–2019 3.56 5.16 1.53 2020–2024* 3.48 4.46 1.96
Economic growth rates (%)
1980–1989 3.16 3.20 3.00 1990–1999 3.11 3.63 2.49 2000–2009 3.89 6.09 1.43 2010–2019 3.76 5.11 1.89 2020–2024* 3.56 4.76 1.40
Source: Author’s chart based on IMF statistics 2019
Note: * IMF projections for the period 2020–2024 are based on working hypotheses about real effective exchange rates, fiscal and monetary policies for selected economies, and average oil prices, inter alia.
It is important to note from the results reported in Table 1, that it is only after the 1990s that single-digit rates of economic growth are matched with single-digit rates of inflation for all groups. Sluggish economic growth is naturally accompanied with lower rates of inflation. It is clear that inflation rates for major advanced economies did not, on average, exceed the threshold of two percent, which represents the inflation target for many central banks. The projections of the International Monetary Fund (2019), which are also reported in the figures above, inflation rates are expected to increase and approach the two-percent threshold for major advanced economies for the period 2020–2024. In contrast, there are expectations for falling inflation for the alternative groups. The persistence in lower inflation for the world economy and developing economies is also associated with expectations of lower economic growth prospects. Indeed, economic growth is expected to remain sluggish, with the average economic rate hovering between 1.3 and 1.6 percent for advanced economies. There are, however, expectations of relatively higher growth rates of around 4.76 for developing economies, and 3.56 for the world economy.
It can be argued that global economic activity remains weak and the momentum is strong for economies to perform below expectations. With reference to the Bank for International Settlements (2019), weaker performance can be explained by political uncertainty, which continues to exert downward pressures on investment. Trade tensions and rising trade barriers remain a significant source of uncertainty. There are growing concerns about the high leverage
conditions in the Chinese financial system, and the over-reliance of emerging market economies on foreign-currency financing, with the stronger dollar adding further pressure as a result of the tightening or “normalisation” of the U.S. monetary policy.
It is noted also that prices have not increased to the extent of lifting inflation above target levels despite the higher levels of employment. Thus, further analysis of economic growth and inflation should take into consideration the nature of economic cycles. Indeed, the BIS (2019) argues that “Less appreciated is the fact that ever since inflation has been low and stable, starting some three decades ago, the nature of business fluctuations has changed. Until then, it was sharply rising inflation, and the subsequent monetary policy tightening, that ushered in downturns. Since then, financial expansions and contractions have played a more prominent role.” (BIS Annual
Economic Report 2019, p. x)
3. Theory of liquidity trap
Faced with sluggish demand, weaker economic growth, low inflation or deflationary pressures, the traditional response from central banks is to lower the short-term nominal interest rate. Expectations of lower nominal rates are conducive to expectations of lower real interest rates, which have the potential of providing stronger incentives for consumption and aggregate demand, and thereby increased real investment and output. This in turn, would increase the expectations of higher inflation. These policy measures may be effective when nominal interest rates can be reduced and transmission channels are effective. But when the level of nominal rates is close to zero, there is very little room for further reduction, and monetary easing under zero-interest rates can be conducive to increased money supply without achieving the inflation target. Thus, a liquidity trap can be understood in terms of expansionary monetary policies, which despite rising of money supply and liquidity levels remains associated with persistent deflationary or low-inflationary pressures. Expansionary monetary policy becomes impotent insofar that increased money supply and higher liquidity have no significant impact on the equilibrium price levels and inflation expectations.
The Keynesian economics describe a liquidity trap as a significant increase in liquidity preference from investors, which is due to uncertainty about the future direction of interest rates, and future yield on capital assets. The likelihood of liquidity traps is higher in the aftermath of asset bubbles, with investment rising during booms and falling during recessions. Indeed, Keynes (1936) notes that “[i]t is of the nature of organized investment markets, under the influence of purchasers largely ignorant of what they are buying and of speculators who are more concerned with forecasting the next shift of market sentiment than with a reasonable estimate of the future
yield of capital assets, that, when disillusion falls upon an over-optimistic and over-bought market, it should fall with sudden and catastrophic force.” (pp. 315–316). This argument reflects the crucial role played by market sentiment in the formation of asset bubble and their subsequent burst. Shifts in market sentiment can be explained by economic shocks and changes in investors’ perceptions affect, in turn, expectations about the future demand for money and future yield of capital goods.
Thus, the likelihood of liquidity trap is intrinsically related to the formation of asset bubbles and onset of crises. Further insights from The General Theory suggest that “the dismay and uncertainty as to the future which accompanies a collapse in the marginal efficiency of capital naturally precipitates a sharp increase in liquidity-preference –and hence a rise in the rate of interest. Thus the fact that a collapse in the marginal efficiency of capital tends to be associated with a rise in the rate of interest may seriously aggravate the decline in investment.” (Keynes, 1936, p. 316).
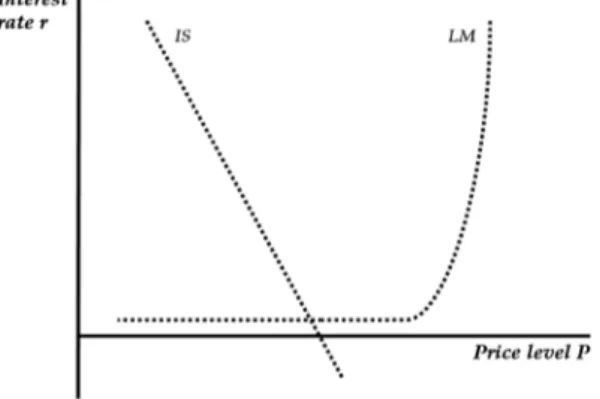
The classical discussion of the liquidity trap is typically made within the IS-LM analytical framework, which describes the equilibrium relation between output and interest rates. The downward-sloping investment-saving (IS) function indicates the tendency for lower interest rates to increase the demand for goods, whereas the upward-sloping liquidity-preference money supply (LM) function indicates the propensity for higher income to increase interest rates. Bearing in mind that the LM curve is responsive to monetary policies whereas the IS curve reflects the impact of fiscal policies, it is possible to consider the market conditions for goods and financial assets that are characteristic of a liquidity trap.1
Following Krugman (2000), it is clear from Figure 4 that the elasticity of the demand for money becomes infinite under zero or near-zero interest rates, as reflected by the flat segment of LM curve. The equilibrium conditions, where the IS line traverses the LM curve, imply that, independent of changes in money supply, monetary policy has no substantial effects on output and interest rates. The futility of monetary policy measures aimed at increasing the price level or inflation rate is precisely the result of the flatness of the LM curve at the region where it meets with the IS function. Thus, given the difficulties to lower interest rates below the zero threshold,
1 In their critique of the liquidity trap, Beranek and Timberlake (1987) argue that “Keynes provided three distinct statements of a trap: a “weak” version, a “strong” version, and an “extreme” case. The “weak” version argues that, while elasticity of liquidity preference becomes very high at low rates of interest, it does not become infinite. The “strong” version envisions a finite segment over which the liquidity preference function is perfectly elastic. Appearing in many textbooks is the “extreme” form, which defines a true trap in the sense that the rate of interest cannot be reduced further by appropriate increases in the stock of money. By way of contrast, the weak form does not lead to a true trap, while the strong version can lead to a condition which may be labelled a trap of sorts.” (p. 387).
conventional monetary easing and open-market operations may become ineffective as bonds no longer dominate cash, and the incentives for saving dominate investment.
Figure 4- Infinite elasticity of the demand of money under zero-interest rate policy
In contrast to the Keynesian IS-LM perspectives, Krugman (2000) proposes an alternative theoretical description of liquidity trap that relates the levels of current and future consumption to interest rates. Assuming that the representative individual is to maximize the utility function
U 1 ρ⁄ ∑ Dc P⁄P c⁄c 1 i 1 D⁄ P⁄ cP ⁄ c
, it is possible to express the level of interest rate i as a function of the future price relative to current price
U 1 ρ⁄ ∑ Dc P⁄P c⁄c 1 i 1 D⁄ P⁄ cP ⁄ c
, expected output relative to current output
U 1 ρ⁄ ∑ Dc P⁄P c⁄c 1 i 1 D⁄ P⁄ cP ⁄ c , based on the discount factor D and relative risk aversion ρ, as follows.
U 1 ρ⁄ ∑ Dc P⁄P c⁄c 1 i 1 D⁄ P⁄ cP ⁄ c
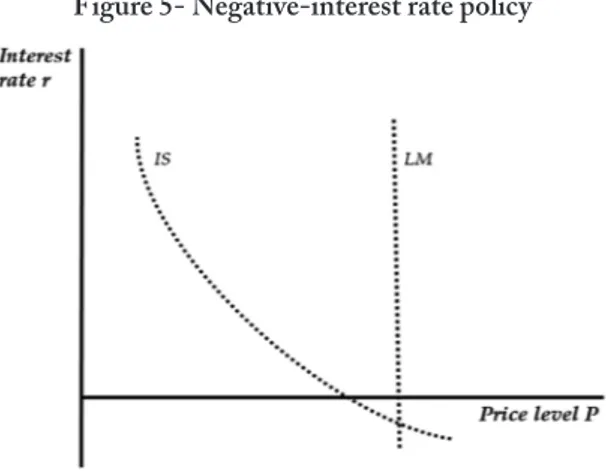
It is clear from the equation above that the nominal rate of interest i is a decreasing function of the price level P. Thus, given an increase in the nominal interest rate, price deflation is required to maintain the real rate of interest unchanged. The equilibrium interest rate is determined at the intersection of the IS curve with the LM curve, which satisfies the condition that Pc = M, where M denotes the money supply. It is also possible to consider the theoretical conditions that imply a negative rate of interest. As shown in Figure 5 following again Krugman (2000), the IS curve meets the LM line in the negative territory of nominal interest rates. An increase in money supply does not the power to shift the LM curve because, as stated above, bonds do not dominate cash, and money serves as a store of value.
Figure 5- Negative-interest rate policy
The monetarist perspective, advocated by Milton Friedman and Karl Schwatz, among others, argues that the existence of liquidity trap is conditional on the term structure of interest rates exhibiting zero or near-zero rates over the whole spectrum from short-term to long-term durations. Non-zero interest rates anywhere along the yield curve would preclude the formation of liquidity traps. The monetarist criticism of the Keynesian view is understandable given its strong advocacy for expansionary monetary policies during recessions. Similarly, the Austrian School of Economics contends that the analysis of the liquidity trap is founded on the wrong premise that the loan rate of interest represents the rate of interest, when the former is rather based on the natural rate of interest. The loan rate is an increasing function of the natural rate of interest, and the loan rate is not bound to rise if the natural rate of interest is not expected to increase. Thus with the aim of providing loans to businesses, central banks artificially lower interest rates by increasing the money supply during depressions. It is the credit expansion that distorts investment decisions by encouraging bad investment projects. It affects consumer preferences as well given the propensity of individuals to hoard money based on expectations of deflationary pressures. Rothbard (2001, [1963]) argues that the liquidity trap should not be explained by the flatness of the demand for money under certain interest levels, but by the rigidity of price levels. Thus, the solution does not lie in the conduct of expansionary monetary or fiscal policies but in the elimination of price rigidities and better functioning of market forces.
Rothbard (2001) presents a serious critique of the Keynesian approach to liquidity preference, stating that “[t]he use of mathematical functions, which are reversible at will, is appropriate in physics, where we do not know the causes of the observed movements. Since we do not know the causes, any mathematical law explaining or describing movements will be reversible, and, as far as we are concerned, any of the variables in the function is just as much “cause” as another.
In praxeology, the science of human action, however, we know the original cause—motivated action by individuals. This knowledge provides us with true axioms. From these axioms, true laws are deduced. They are deduced step by step in a logical, cause-and-effect relationship. Since first causes are known, their consequent effects are also known. Economics therefore traces unilinear cause-and-effect relations, not vague “mutually deter-mining” relations.” (pp. 785–786).
Krugman (2000) further argues that “[b]ecause the usual rules do not apply, conventional rules of thumb about policy become hard to justify. We usually imagine that policy is more or less based on conventional models—in particular, that normally policy will be based on the simple, rather dull models in the textbooks rather than exotic stories that might be true but probably aren’t. In the case of the liquidity trap, however, conventional textbook models imply unconventional policy conclusions—for inflation targeting is not an exotic idea but the natural implication of both IS-LM and modern intertemporal models applied to this unusual situation.” (p. 237).
In light of the above theoretical discussion about the liquidity preference and analytical modelling, there are major difficulties in formulating a coherent theory of liquidity trap. The trap itself is an overdue realization that the economy was permitted entry to but no exit from difficult monetary policies and market conditions. The reality remains that the phenomenon of liquidity trap is not new. But the clear inability of monetary policies in many advanced economies to reach inflation targets despite immense increases in money supply, inevitably draws attention to the limits of economic theory, and important questions about the essence of interest rates and the soundness and effectiveness of conventional monetary policies.
4. Balance-sheet recessions and expansionary monetary policies
It is important to understand the relation between the onset of financial crises, the ensuing economic recessions, and the accommodative monetary policies, which may be conducive in turn, to liquidity traps. In light of the formation of the Japanese and U.S. asset bubbles, it is clear that cutting interest rates and providing liquidity does not solve the underlying problems related to market efficiency and moral hazard. As noted by the Financial Crisis Inquiry Commission (2011), the so-called “Greenspan put” or “asymmetric policy—allowing unrestrained growth, then working hard to cushion the impact of a bust—raised the question of “moral hazard”: did the policy encourage investors and financial institutions to gamble because their upside was unlimited while the full power and influence of the Fed protected their downside (at least against catastrophic losses)? Greenspan himself warned about this in a speech, noting that higher asset prices were “in part the indirect result of investors accepting lower compensation for risk” and cautioning that “newly abundant liquidity can readily disappear.” ” (p. 61). Thus, the real problemis the creation of incentives and monetary environment for the accumulation of debt, and the failure to restrain the formation of asset bubbles. Given the widespread understanding that central banks cannot intentionally burst asset bubbles without inflicting damage to the economy, strong moral hazard is developed by providing investors with a put option against losses. The put option constitutes a protection against the risk of the bubble bursting, with guarantee from the central bank that capital markets would be allowed to function under all conditions.
Richard Koo (2014) argues that balance sheet recessions occur only when asset bubbles financed by debt finally burst. During such recessions, the focus of the private sector, whether firms or households, is on the repair of badly structured balance sheets. Given the formation of asset bubbles with the accumulation of debt and higher leverage, it is natural that acute problems of deleveraging ensue in the aftermath of the bubble burst. The deleveraging process can take place in terms of debt-equity swaps, debt forgiveness, or capital injections. Unlike the usually rapid process of debt accumulation, deleveraging is rather time-consuming. Thus, insofar that the issue of liquidity trap is concerned, the key question is whether households and companies concerned with long-protracted deleveraging efforts, are willing to increase borrowing and investment just because interest rates are falling.
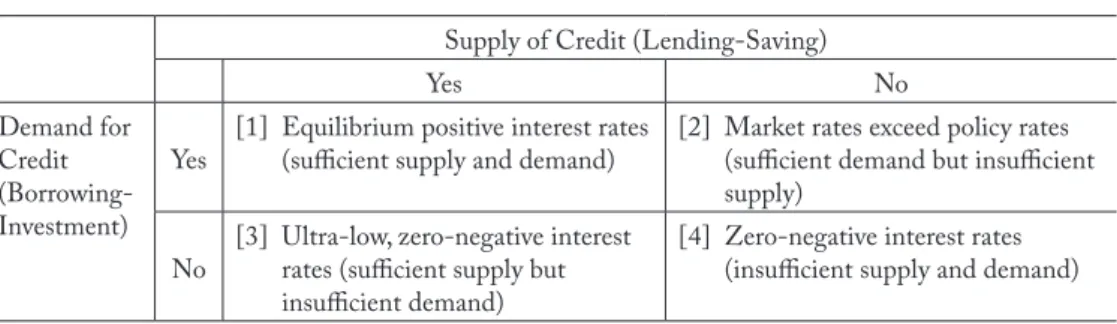
It seems that numerous efforts to stimulate the economy by providing liquidity and lowering interest rates to encourage real investment have been so far ineffective. With reference to Table 2, the equilibrium levels of interest rates are theoretically determined by the forces of supply and demand of credit. In the textbook explanations of cases [1] and [2], positive equilibrium rates are conditional on the presence of sufficient demand. Market rates may approach policy rates in the presence of sufficient supply (case [1]), and would exceed policy rates under insufficient supply (case [2]). Much of the theoretical analysis and empirical research in the academia and policy-making circles have centered so far on these particular textbook cases, perhaps because of the lack of experience with acute balance-sheet recessions, economic depressions, and liquidity traps. In the aftermath of the U.S. financial crisis, there is a recourse to unconventional monetary measures, including zero-interest rate policies as well as quantitative and qualitative easing programs.
Table 2- Balance-sheet recession and the determination of interest rates
Supply of Credit (Lending-Saving)
Yes No
Demand for Credit (Borrowing-Investment)
Yes [1] Equilibrium positive interest rates (sufficient supply and demand) [2] Market rates exceed policy rates (sufficient demand but insufficient supply)
No [3] Ultra-low, zero-negative interest rates (sufficient supply but insufficient demand)
[4] Zero-negative interest rates (insufficient supply and demand)
The ultra-low interest rates are theoretically the outcome of weak demand for credit, despite the provision of ample liquidity (case [3]). It can be argued that the accommodative monetary policies adopted by monetary policy-makers in the major advanced economies have prevented the more extreme scenario of not only insufficient demand but insufficient supply as well (case [4]). Thus, it appears that near-zero interest rates and negative bond yields may be inevitable under the particular conditions [3] and [4] of weak demand for credit. It is important to note that these conditions are consistent with a balance-sheet recession with the private sector, as noted above, is more concerned about the deleveraging process leading to weaker demand for credit, despite the expansionary monetary policies. Thus, balance-sheet recessions are conducive to liquidity traps, and further monetary easing in the presence of weak demand for credit may not be part of viable solutions.
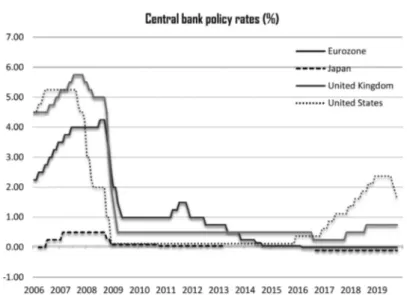
With reference to Figure 6, there is a clear convergence of policy rates in major advanced economies toward the zero-threshold in association with the U.S. financial crisis. Given its experience in the early 1990s with post-bubble recession, it is the Bank of Japan that pioneered the use of unconventional monetary policy to stimulate the economy. The European Central Bank, Federal Reserve Bank and Bank of England policymakers followed the concerted actions of adopting unprecedented monetary policies at the onset of the U.S. credit crisis, which culminated in policy rates dropping to near-zero levels. To better understand the dynamics of this competitive race to the bottom, it is important to note the earlier explicit commitment in April 1999 to the zero-interest rate policy. In an account of the unconventional policy measures adopted by the Bank of Japan to contain deflationary pressures, Ueda (2012) argues that the zero-interest rate policy and quantitative easing were aimed at managing expectations regarding future policy rates, purchase of assets in dysfunctional markets, portfolio rebalancing, and inflation of the balance sheets of central banks.
Figure 6- Monetary easing under near-zero interest rates
Source: Author’s chart based on BIS policy rate statistics
As noted by Shirai (2013), the commitment by the Bank of Japan, to zero-interest rate policy until deflationary concerns are dispelled, can be regarded as an open-ended forward guidance. The uncollateralized overnight call rate was however raised in August 2000 in the absence of clear evidence of inflationary pressures or expectations of higher inflation. The Bank of Japan reintroduced the zero-interest rate policy in March 2001 and made another commitment to pursue monetary easing until “the inflation rate becomes stably above zero.” In replacement of the call rate, a target for bank reserves held at the Bank of Japan, or current account balances held by financial institutions at the Bank, became the main instrument for money market operations. The quantitative easing policies introduced in March 2001 was aimed at providing further liquidity to the financial system.
A more comprehensive monetary easing introduced in October 2010 expands asset purchases to a wider range of securities including long-term Japanese government bonds. The renewed commitment to monetary easing was manifested by the official statement that quantitative easing would continue until the core CPI registers stable zero or an increase year on year. As noted by Shirai (2013), this is state-contingent forward guidance about the future course of monetary policy. This guidance was further explained in October 2003 with the clarification that monetary easing shall be pursued until the most recently published core CPI registers zero percent or above, and that it is not expected to fall below zero.
Further commitment was made by the Bank of Japan in October 2010 to implement comprehensive monetary easing policy through a second round of quantitative easing with
asset purchases extending to assets other than long-tern government bonds. Forward guidance indicates that monetary easing would be maintained until price stability is expected based on an “understanding” from the Bank’s monetary policy board about the core CPI ranging from zero to two percent, with one percent as the distributional central tendency. Further clarification was made in February 2012 about the board’s “understanding” in terms of one percent “goal”, which can be distinguished from inflation “target”, with the focus placed on inflation expectations rather than statistical outcome. Finally, it is noted that further guidance is provided with the inception of quantitative and qualitative easing with a negative interest rates in January 2016. The Bank of Japan applies a three-tier system of positive, zero and negative interest rates to the current accounts held by financial institutions at the Bank, which provides notice that further cuts in interest rate into negative territory may be implemented if judged necessary.
The objective of these unconventional and unprecedented measures is to achieve the price stability target of two percent. But, the inflation target seems to be increasingly elusive, and the liquidity trap increasingly perplexing. The Keynesian solution to liquidity traps includes fiscal stimulus to create new job opportunities and facilitate the formation of higher expectations about the marginal efficiency of capital. The role for central banks is to reduce the cost of capital, volatility of interest rates, and attitudes toward risk and uncertainty by risk-averse investors. But the reality is that perhaps the problem falls beyond the domain of central banks and the capacity of their inflated balance sheets to absorb the impact of balance-sheet recessions.
5. Conclusion
After few decades of low inflation, weak productivity, poor economic growth, and limited room for manoeuver, it seems that unconventional monetary policies are not sufficient to solve the prevailing economic problems. Despite the fact that forward guidance provides greater clarity about the future course of non-traditional monetary policies and exit strategies from quantitative easing, low inflation persists and inflation targets remain elusive. As a natural result of the unprecedented policy measures to provide liquidity to the financial system, central bankers continue to inflate their own balance sheets. Given the growing economic and geo-political uncertainties and the onset of the new coronavirus crisis, micro-prudential supervision at a time of increased private and public debt may not be sufficient to reduce systemic risk and ensure financial stability. Central banks are expected to play a pivotal role in resolving the dilemma associated with low economic growth, low inflation and weaker growth in real income. But, in the absence of a more accurate and precise definition of price stability, the mandate of central banks remains unclear. Jean-Claude Trichet (2019) argues that structural reforms are important and that in order
to reach the two-percent level, it is incumbent on government, organized labour and firms to elevate the growth rate of unit-labour costs to an appropriate level consistent with the inflation target. The same line of argument is advanced by other economists including Pereira da Silva and Mojon (2019), who contend that social partners and governments should consider a “consensus package” based on increasing nominal wages and pro-growth fiscal stimulus. These notable recommendations for consensus packages and rising labour costs are deemed to be the necessary conditions to escape from low-inflation traps.
Liquidity traps stem from the same sources including the accumulation of debt, increased leverage, moral hazards, misalignment of incentives, and the ensuing balance sheet recessions. In light of the failure to lift inflation rates above any reasonable threshold, it is perhaps crucial to realize that inflation, even on the longer run, is not, primarily or exclusively, determined by monetary policy. It is important to understand also that liquidity traps have exposed the limits of conventional and unconventional monetary policies based on the setting of positive or negative rates of interest independent form the rate of return on the real economy. Thus, the main challenges do not perhaps lie with inflation targeting, or the provision of liquidity independent of the rate of return in the real economy. The critical lessons should be drawn from the dynamics of the real economy, and from the fact that economic growth is function of demographic and social dynamics and technological advances. The lessons imply also a shift of foci away from nominal or real interest rates toward risk sharing, which can govern more efficiently the social and economic relations in a dynamic society and exchange economy, and provides the foundations for sustainable human and economic development.
References
Bank for International Settlements, 2019, “Annual Economic Report: Promoting global monetary and financial stability”, June 2019.
Beranek, William, and Richard H. Timberlake, 1987, “Liquidity Trap Theory: A Critique”, Southern
Economic Journal, vol. 54, No. 2, pp. 387–396.
Financial Crisis Inquiry Commission, 2011, “The financial crisis inquiry report: Final report of the National Commission on the causes of the financial and economic crisis in the Unites States,” U.S. Government Printing Office.
International Monetary Fund, 2019, “The World Economic Outlook”, October 2019.
Keynes, John Maynard, 1964, [1936], “The General Theory of Employment, Interest, and Money”, First Harvest/Harcourt, Inc. edition 1964.
Koo, Richard, 2014, “The Escape from Balance Sheet Recession and the QE Trap”, Singapore: John Wiley. Krugman, Paul, 2000, “Thinking about the liquidity trap,” Journal of the Japanese and International
Economies, vol. 14, no. 4, pp. 221–237.
wages and price stability”, Eighth High-level Policy Dialogue between the Eurosystem and Latin American Central Banks, Cartagena de Indias, Colombia, 28–29 November 2019.
Rothbard N. Murray, 2009, “Man, Economy, and State -A Treatise of Economic Principles with Power and Market Government and the Economy,” Ludwig von Mises Institute Scholar’s Edition, Alabama. Shirai, Sayuri, 2013, “Monetary Policy and Forward Guidance in Japan”, Speeches at the International
Monetary Fund, Washington, D.C., September 19, 2013, and at the Board of Governors of the Federal Reserve System, Washington, D.C., September 20, 2013.
Trichet, Jean-Claude, 2019, “The Mayekawa Lecture: The Euro Area Economic, Fiscal and Financial Governance: Difficulties and Successes in the Past–Present Challenges–Future Steps”, Monetary and
Economic Studies, vol. 37, November 2019, pp. 23–40.
Ueda, Kazuo, 2012, “Japan’s deflation and the Bank of Japan’s experience with non-traditional monetary policy”, Journal of Money, Credit and Banking, vol. 44, supplement 1, pp. 175–190.