Assessment of Sunitinib-Induced Toxicities and
Clinical Outcomes Based on Therapeutic Drug
Monitoring of Sunitinib for Patients With
Renal Cell Carcinoma.
著者
NODA Satoshi, Otsuji Takashi, Baba Masato,
Yoshida Tetsuy, KAGEYAMA Susumu, OKAMOTO
Keisei, OKADA Yusaku, KAWAUCHI Akihiro, Onishi
Hiroyuki, HIRA Daiki, MORITA Shin-ya, TERADA
Tomohiro
journal or
publication title
Clinical genitourinary cancer
volume
13
number
4
page range
350-358
year
2015-08
1
Assessment of Sunitinib-induced Toxicities and Clinical Outcomes Based on Therapeutic Drug Monitoring of Sunitinib for Patients with Renal Cell Carcinoma
Satoshi Nodaa, Takashi Otsujib, Masato Babac, Tetsuya Yoshidac, Susumu Kageyamac,
Keisei Okamotoc, Yusaku Okadac, Akihiro Kawauchic, Hiroyuki Onishid, Daiki Hiraa,
Shin-ya Moritaa, Tomohiro Teradaa
a
Department of Pharmacy, Shiga University of Medical Science Hospital, Seta
Tsukinowa-cho, Otsu City, Shiga 520-2192, Japan
b
Department of Pharmacy, Shiga Medical Center for Adults, 5-4-30 Moriyama,
Moriyama City, Shiga 524-8524, Japan
c
Department of Urology, Shiga University of Medical Science Hospital, Seta
Tsukinowa-cho, Otsu City, Shiga 520-2192, Japan
d
Department of Urology, Shiga Medical Center for Adults, 5-4-30 Moriyama, Moriyama
City, Shiga 524-8524, Japan
Correspondence: Tomohiro Terada Ph D.
Department of Pharmacy, Shiga University of Medical Science Hospital, Seta *Manuscript
2
Tsukinowa-cho, Otsu City, Shiga 520-2192, Japan
Tel.: +81 77 548 2680,
Fax: +81 77 548 2411,
E-mail: [email protected]
Abstract (249 words)
3
Conflict of interest
4
Abstract
The benefit of pharmacokinetic assessment of sunitinib remains unknown. We reported that patients with total sunitinib (sunitinib + its active metabolite SU12662) ≥100 ng/mL showed high incidence of Grade ≥3 toxicities and worsening clinical outcomes. Thus, pharmacokinetic assessment of sunitinib could be helpful for dose optimization.
Background
Sunitinib has been approved for the treatment of metastatic renal cell carcinoma (RCC).
Sunitinib pharmacokinetics shows a large inter-patient variability.
Patients and Methods
A retrospective, observational clinical study of 21 patients with RCC was performed.
Sunitinib was administered for 4 weeks of a 6-week cycle for the first cycle. We
evaluated the association of sunitinib-induced toxicities and clinical outcomes with the
trough total sunitinib concentration in a steady state during the first cycle.
Results
The median total sunitinib concentration was 91.8 ng/mL (range 49.8-205 ng/mL).
There was an association between total sunitinib concentration and the severity of
5
as compared with patients with <100 ng/mL (n=13), had a higher incidence of Grade ≥3
toxicities (75% vs. 23%). Patients with <100 ng/mL total sunitinib had significantly
longer time to treatment failure (TTF), progression-free survival time (PFS) than
patients with ≥100 ng/mL (median TTF 590 vs. 71 days, P=0.04; median PFS 748 vs.
238 days, P=0.02)
Conclusions
This study suggests that therapeutic drug monitoring of sunitinib could be useful for
avoiding severe toxicities. Dose reduction may be needed, especially when the total
sunitinib concentration is ≥100 ng/mL, to avoid unnecessary early discontinuation of
6
Key words: Sunitinib, Renal cell carcinoma, Pharmacokinetics, Therapeutic drug monitoring
7
Introduction
Sunitinib is an oral multikinase inhibitor that targets vascular endothelial growth factor
receptor, platelet-derived growth factor receptors, and stem cell factor receptor. It has
been approved for the treatment of advanced and/or metastatic renal cell carcinoma
(RCC) as the first-line treatment.1 Sunitinib frequently induces severe toxicities such as
thrombocytopenia, anorexia, fatigue, hand-foot syndrome (HFS), and bleeding event.1
In addition, sunitinib induces rare, but potentially life-threatening events such as
intestinal perforation, interstitial lung disease, and would healing complication.2-4
Because these toxicities are difficult to handle and anticipate, dose reduction or
discontinuation is generally carried out in daily clinical settings. As a consequence,
physicians must closely monitor all patients who have started sunitinib treatment.
Against this background, a predictive marker for preventing severe sunitinib-induced
toxicities is needed.
Therapeutic drug monitoring (TDM) has been widely used to improve efficacy and to
avoid adverse events for various drugs.5 At present, although many anticancer agents
show large interindividual variability for pharmacokinetics (PK), TDM has not been
routinely used in chemotherapy management. Recently, clinical studies have reported
8
response in chronic myeloid leukemia.6,7 Regarding toxicity, several studies have
demonstrated that the area under the curve (AUC) of erlotinib was associated with the
occurrence of skin toxicity.8,9 Implementation of TDM may contribute to optimal dose
adjustment for other oral molecular-targeted anticancer agents including sunitinib. In
fact, considerable interindividual differences in sunitinib PK have been observed.10 The
reason for severe toxicity in some patients may be the interindividual variation in serum
levels of sunitinib. However, a pharmacokinetic (PK) approach to evaluate the side
effects of sunitinib is lacking. Furthermore, information on the associations between
sunitinib PK and clinical outcomes and pharmacogenomic factors is insufficient.
Sunitinib is primarily metabolized by cytochrome P450 (CYP) 3A4 to the equally
active SU12662. SU12662 is further metabolized to inactive moieties by CYP3A4.11
Previous studies have reported that sunitinib is a substrate for ATP-binding cassette
transporters, ABCG212 and ABCB1,13 which affect the intestinal absorption and biliary
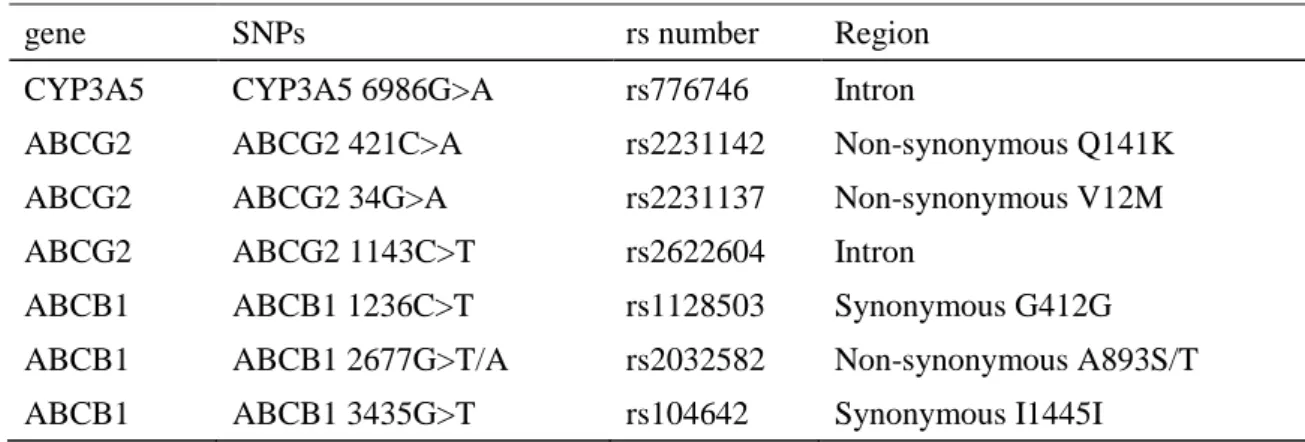
excretion of various drug substrates.14 In this study, we evaluated polymorphism in
CYP3A5 (6986G>A), ABCG2 (421C>A, 34G>A, 1143C>T), and ABCB1 (1236C>T,
2677G>T/A, 3435C>T) (Table 1). Regarding the ABCB1 variants, we assessed ABCB1
1236-2677-3435 TTT haplotype, which are associated with low expression.15
9
concentration with sunitinib-induced toxicity in patients with RCC. The secondary aim
was to estimate the association of sunitinib PK with clinical outcome and genetic
10
Patients and Methods
Patients
This was a two-institution study conducted at Shiga University of Medical Science
Hospital and Shiga Medical Center for Adults. Twenty-one Japanese RCC patients
treated with sunitinib were enrolled between September 2010 and March 2013.
Eligibility criteria included histological confirmation and Eastern Cooperative
Oncology Group (ECOG) performance status of 0, 1, or 2. This study was approved by
the relevant institutional review boards.
Treatment plan
Sunitinib was administered at a dose of 50 mg, 37.5 mg, or 25 mg daily based on the
treating physicians’ recommendation for 4 weeks of a 6-week cycle for the first cycle.
Subsequently, dose reduction or discontinuation was adjusted based on adverse events
or disease progression.
Assessment of safety and efficacy
All adverse events were graded according to the Common Toxicity Criteria for
11
were analyzed. We also examined major bleeding events, as previously defined.16 The
best tumor response was assessed using the Response Evaluation Criteria in Solid
Tumors (RECIST version 1.1).17 Time for assessment was dictated by the individual
institutional policies.
Assessment of serum level of sunitinib
After informed consent had been obtained from the patients, blood samples were
collected before administration at a steady state (days 10-28) after the initiation of
sunitinib treatment during the first cycle. We retrospectively evaluated the serum
concentrations of sunitinib and its major metabolite, SU12662, using stored blood
samples. Blood samples were drawn into a sterilized vacuum tube for separation just
before sunitinib administration. All samples were centrifuged at 1700 g and 4˚C for 10
minutes, and serum was separated and stored at -20˚C.
Sunitinib and SU12662 were measured by high-performance liquid chromatography,
as previously described.18 The observed intraday and interday assay imprecision and
inaccuracy were <10%. The lower limits of quantification of sunitinib and SU12662
12
Single-nucleotide polymorphisms (SNPs) related to the PK of sunitinib
Genomic DNA was extracted from the blood using DNA Extract All Reagents
(Applied Biosystems, Foster City, CA, USA). Subsequently, genotyping was performed
using TaqMan® SNP genotyping assay (Applied Biosystems) in a Step One Plus Real
time PCR system (Applied Biosystems). Amplification conditions were 95˚C for 20 s,
40 cycles of 95˚C for 3 s, and 60˚C for 20 s.
Statistical analysis
Descriptive data are expressed as means ± SD or median. Continuous variables were
compared using Mann-Whitney U-test. Categorical variable were compared by
Chi-square test or Fisher’s exact test. The correlation between serum concentration of
sunitinib and blood cell count was determined using Spearman’s test. The correlation
between the severity of non-hematological toxicities and total sunitinib concentration
was evaluated by the Jonckheere-Terpsta test. Time-to-event variables were estimated
using the Kaplan-Meier method and log rank test. Time to treatment failure (TTF) was
defined as the period from the first day of sunitinib treatment until cessation of sunitinib
treatment due to any cause. Progression-free survival (PFS) was defined from the date
13
survival (OS) was defined from the date of sunitinib initiation until the date of death.
Patients lost to follow-up were censored at the time of last contact. The cut-off date for
this analysis was March 31, 2014. Median follow-up was 482 days (range 48-1001).
Allele frequencies were tested for Hardy-Weinberg equilibrium using the Chi-square
test. Correlations between genotypes related to sunitinib PK and the dose-adjusted total
sunitinib concentration were evaluated by one-way analysis of variance and Tukey test.
All comparison tests were two-sided. A p-value <0.05 was considered to be statistically
14
Results
Patient characteristics
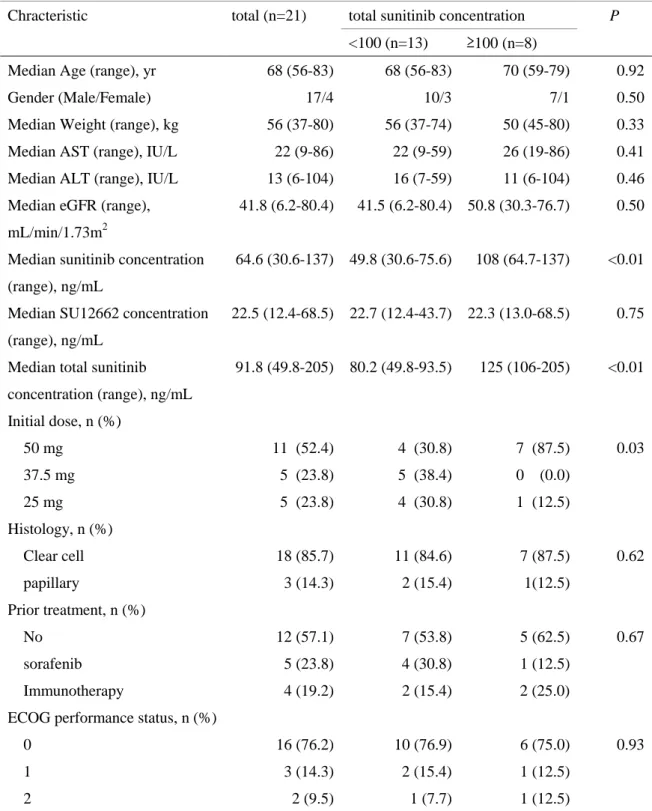
Twenty-one patients were treated with sunitinib. Baseline characteristics are shown in
Table 2. The median age was 68 years (range 56-83), and 18 patients (85.7%) had clear
cell histology. Patients were started on sunitinib at doses of 50 mg (n=11), 37.5 mg
(n=5), and 25 mg (n=5) daily. The median trough total sunitinib concentration was 91.8
ng/mL (range 49.8-205). To evaluate drug exposure and the safety/efficacy relationship,
we grouped the population into patients with “low” exposure and “high” exposure. In
this study, we used a total sunitinib concentration of 100 ng/mL as the cut-off value,
which was previously reported as being associated with most patients experiencing
dose-limiting toxicity.19 Toxicity and clinical outcome due to sunitinib were compared
between the two groups.
Association of toxicities with total sunitinib concentration
In the first cycle of sunitinib, a clear inverse correlation was found between the total
sunitinib concentration and the blood platelet count at nadir (r=-0.53, P=0.01), but not
hemoglobin level count (r=0.04, P=0.86) or leukocyte count (r=0.14, P=0.55) (Fig. 1).
15
toxicity of anorexia and fatigue (Fig. 2a, b). In addition, total sunitinib concentration
was not correlated with the severities of HFS and hypertension (Fig. 2c, d). The mean
total sunitinib concentration was greater in patients with bleeding events (n=10) than in
those without them (n=11) (116±43.4 vs. 77.2±22.2 ng/mL, respectively, P=0.13) (Fig.
2e).
Association of dose reduction or discontinuation of sunitinib with total sunitinib
concentration
In the low-exposure group (total sunitinib <100 ng/mL, n=13), three patients (23.1%)
experienced grade 3 thrombocytopenia during the first cycle. Dose reductions from 50
mg to 37.5 mg were performed in 2 patients, which resulted in attenuation of the
thrombocytopenia. In this group, the toxicities of sunitinib therapy were mild (grade ≤1
toxicities), except for the thrombocytopenia, and controllable. The final reasons for
sunitinib discontinuation were disease progression (n=5), interstitial lung disease (n=2),
grade 3 anorexia (n=2), and grade 3 pancreatitis (n=1).
In the high-exposure group (total sunitinib ≥100 ng/mL, n=8), six (75%) of the 8
patients experienced Grade ≥3 toxicities during the first cycle. Owing to its toxicities,
16
dose was reduced from 50 mg to 25 mg. In this group, three patients, who were
managed as outpatients, were hospitalized due to grade 3 anorexia (n=2) and intestinal
perforation (n=1). Additionally, one patient experienced protracted wound healing for
the first cycle. As a consequence, sunitinib was discontinued in 7 patients who
experienced grade 3 anorexia (n=3), grade 3 fatigue (n=3), and intestinal perforation
(n=1). The patient who experienced intestinal perforation was started on sunitinib at 50
mg daily for 4 weeks of a 6-week cycle. This patient needed a dose reduction to 37.5
mg after 1 cycle of sunitinib because of grade 3 thrombocytopenia. Six days after
discontinuation of the second cycle of sunitinib, he presented with abdominal pain and
muscle guarding. Computed tomography showed free air in the upper abdomen.
Emergency laparotomy revealed localized perforation of the sigmoid colon. Resection
of the sigmoid colon and colostomy were performed, and he recovered within 14 days.
As shown in Figure 3, serum total sunitinib concentration was 205 ng/mL on day 16 of
the first cycle. Serum total sunitinib concentrations of the second cycle ranged from 90
to 160 ng/mL.
Association of efficacy with total sunitinib concentration
17
points. Waterfall plot of the greatest percentage changes from baseline in the sum of the
longest diameters of target lesions according to a total sunitinib concentration of ≥100
ng/mL, or <100 mg/mL are displayed in Figure 4.
In the low-exposure group (total sunitinib <100 ng/mL, n=13), partial responses
determined by RECIST were achieved in 3 patients (23.1%). Stable disease was
observed in 8 patients (61.5%). In one patient, the efficacy could not be confirmed due
to transfer to another hospital. One patient was not assessable due to early unacceptable
toxicity before the first assessment.
In the high-exposure group (total sunitinib ≥100 ng/mL, n=8), the best response of
stable disease was observed in 7 patients (87.5%). One patient was not assessable due to
early unacceptable toxicity before the first assessment.
Association of TTF, PFS, and OS with total sunitinib concentration
The median TTF, PFS, and OS were 163 days (95% confidence interval [CI], 9.12-
317), 590 days (95% CI, 58.3-1122), and 939 days (95% CI, 585-1293), respectively.
Additionally, a sub-group analysis of TTF, PFS, and OS was performed using total
sunitinib concentration for the first cycle.
18
patients with ≥100 ng/mL (n=8) (median 590 vs. 71 days, P=0.04) (Fig. 5a). Patients
with <100 ng/mL total sunitinib had significantly longer PFS than patients with ≥100
ng/mL (median 748 vs. 238 days, P=0.02) (Fig. 5b). Patients with <100 ng/mL total
sunitinib showed only a tendency for significantly longer OS than patients with ≥100
ng/mL (median 939 vs. 570 days, P=0.07) (Fig. 5c).
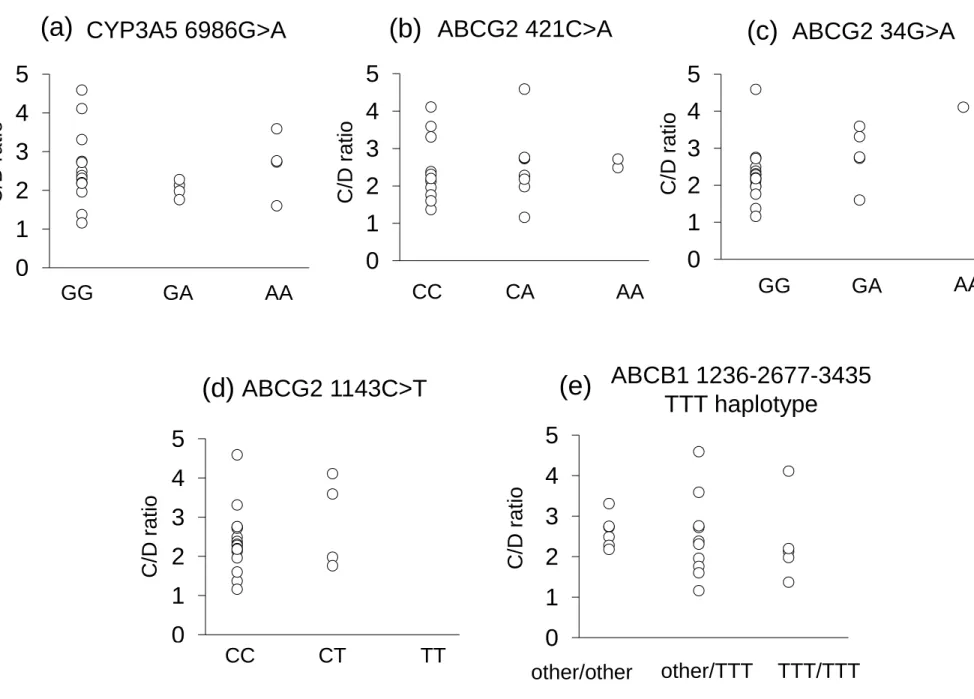
Association of total sunitinib concentration with SNPs related to the PK of sunitinib
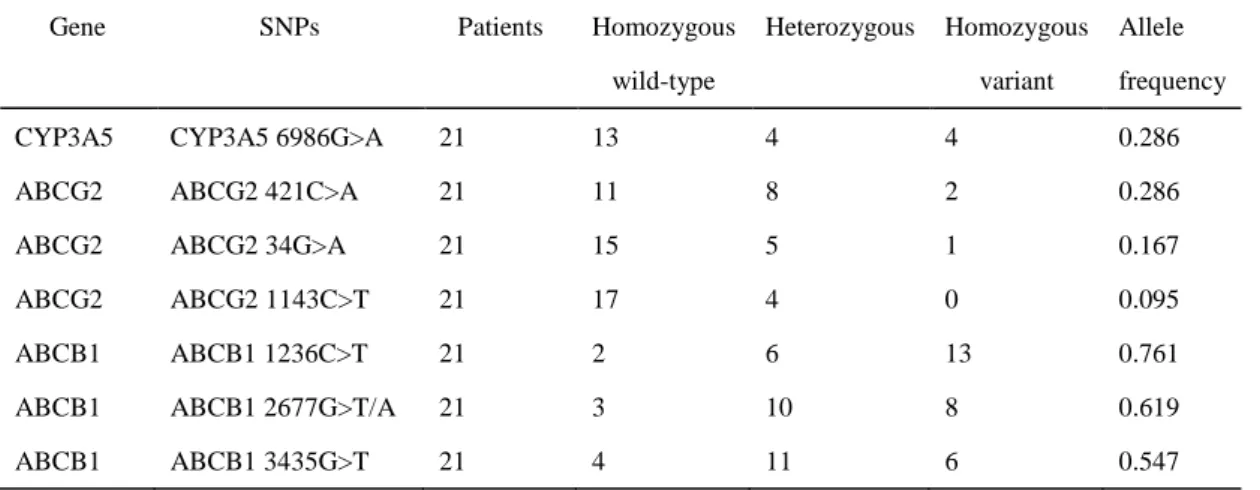
Pharmacogenomic data were available for 21 patients. The allele frequencies of
polymorphism in ABCG2, ABCB1, and CYP3A5 are shown in Table 3. These SNPs
were in Hardy-Weinberg equilibrium (P>0.05), except for the CYP3A5 (6986G>A).
However, the observed deviation was small with P=0.01 for CYP3A5 (6986G>A). As
shown in Fig. 6, no statistically significant associations between SNPs related to the PK
19
Discussion
Despite the excellent efficacy of sunitinib, its severe toxicity is becoming a central
issue in the treatment of RCC using it. Identifying a predictive marker of sunitinib
toxicity is important to improve sunitinib therapy management. A previous report
indicated that one RCC patient showed severe adverse events such as grade 3 hypertension, grade 3 facial acne, and grade 3 elevation of amylase, and had
maximum concentration and AUC of sunitinib that were 2.5-fold higher than those of
four other patients with similar clinical characteristics.12 High exposure to sunitinib may
be one of the reasons for the severe toxicities induced by it. In the present study, we
showed that some patients with ≥100 ng/mL total sunitinib concentration were
hospitalized due to its severe toxicities during outpatient therapy. Among them, one
patient had to stop sunitinib permanently after 2 cycles due to intestinal perforation. Of
interest is the fact that this patient had extremely high exposure to sunitinib (total trough
sunitinib for the first cycle: 205 ng/mL). To identify the cause of the high concentration
of sunitinib in this patient, we checked co-administered drugs. During the sunitinib
therapy, this patient had taken azelnidipine, a CYP 3A4 inhibitor, as previously
reported,20 in combination with it, which could have been related to the high
20
The development of TDM strategies should lead to the selection of an optimal regimen
and dose for each individual patient based on drug PK. However, the usefulness of
TDM of sunitinib is limited by the lack of established therapeutic ranges. A previous
meta-analysis of metastatic RCC studies indicated that increased serum AUC to
sunitinib and SU12662 is associated with improved treatment outcomes and some
adverse effects.21 Although severe toxicity of sunitinib is becoming a central issue in the
treatment of RCC using it, a threshold for the toxicity of sunitinib treatment has not
been defined. A recent study demonstrated that total trough sunitinib concentration were
highly correlated with its AUC0-24h.22 Therefore, we consider that total sunitinib trough
concentration is a valid PK parameter for its toxicity. In a phase І study, a case
presentation of three patients indicated that total sunitinib trough concentration ≥ 100
ng/mL may be associated with dose-limiting toxicity.19 In agreement with this study, we
showed that most of the patients with total trough sunitinib ≥ 100 ng/mL experienced
unacceptable toxicities. This could have led to early treatment discontinuation or
delayed administration, which resulted in suboptimal efficacy of sunitinib. In fact, in the
present study, the high-exposure group (≥100 ng/mL total sunitinib) showed a shorter
TTF and PFS. These observations suggest that ≥100 ng/mL total sunitinib trough
21
Preclinical studies have demonstrated that sunitinib is effective at total plasma
concentrations of 50-100 ng/ml.23 In a clinical trial, Faivre et al.19reported that the total
sunitinib concentration obtained with a dose of 50 mg daily ranged from 50 to 100
ng/ml. Uemura et al.24 also reported that sunitinib was effective at plasma
concentrations ≥50 ng/ml in patients with metastatic RCC. In the present study, 95.2%
of patients (20/21) exceeded 50 ng/mL total sunitinib, and these patients showed either a
partial response or stable disease as the best response. Additionally, considering
sunitinib toxicity, when targeting ≥100 ng/mL total sunitinib, it is difficult to maintain
sunitinib treatment for a long period of time. Therefore, the target range could be a total
sunitinib trough concentration of 50-100 ng/mL during sunitinib therapy.
In this study, total sunitinib concentration was significantly associated with TTP and
PFS. However, it was not significantly associated with OS. This discrepancy may partly
contribute to the availability of sequential administration of target therapy after the
discontinuation of sunitinib treatment. Guidelines recommend everolimus25 and
axitinib26 for patients with advanced RCC refractory to prior systemic therapy, including
sunitinib. In the present study, nine (42.9%) of 21 patients were subsequently treated
with target therapy, including everolimus (n=4) and axitinib (n=5), after sunitinib
22
beneficial for patients who discontinued sunitinib due to severe toxicity or progressive
disease.
To identify the cause of the large inter-patient variability in sunitinib exposure in this
study, we checked genetic polymorphism related to sunitinib PK. Previous preclinical
and clinical studies reported that functional loss of ABCG2 was associated with
increased sunitinib exposure.12,27,28 Another study reported that ABCG2 421C>A
polymorphism may be mostly associated with the risk of sunitinib-related toxicity in
mRCC patients.29 In disagreement with these studies, our data showed that
polymorphism related to PK of sunitinib, including ABCG2, was not related to total
sunitinib dose-adjusted concentration. A recent pharmacogenomic study on the PK of
sunitinib indicated that none of the SNPs in candidate genes for the PK of sunitinib
appeared to be significantly associated with the clearance of sunitinib and SU12662 in
114 RCC patients treated with sunitinib.30 Phenotypes of the PK of sunitinib are
multifactorial, and not only genetics but also drug-drug interactions, poor compliance,
and environment could have an impact on sunitinib PK. Therefore, we need to perform
23
Conclusions
The present study showed that several side effects of sunitinib were dose-dependent.
Discontinuation occurred significantly more frequently in patients with total sunitinib
trough concentration ≥100 ng/mL. Dose reduction may be needed, especially when the
steady-state total sunitinib concentration is above 100 ng/mL. These findings suggest
that therapeutic drug monitoring of sunitinib could be helpful for avoiding severe side
effects, resulting in prolonged TTF and PFS upon sunitinib therapy. However, these
results are debatable because the number of patients examined was very small and there
were several differences in their back ground. In order to confirm these findings, large
24
Clinical practice point
Sunitinib, an oral multitargeted tyrosine inhibitor, has shown single-agent activity in patients with metastatic RCC. Sunitinib pharmacokinetics shows a large
inter-patient variability. However, information on pharmacokinetic assessment of
sunitinib is limited.
In this retrospective, observational study, we explored pharmacokinetic relationship with safety or efficacy of sunitinib in 21 patients with RCC. We found that the
severity of thrombocytopenia, anorexia, and fatigue appeared to be dose-dependent.
Patients with ≥100 ng/mL total sunitinib (n=8), as compared with patients with
<100 ng/mL (n=13), had a higher incidence of Grade ≥3 toxicities (75% vs. 23%).
Furthermore, we indicated that patients with <100 ng/mL total sunitinib had
significantly longer TTF, PFS than patients with ≥100 ng/mL.
These findings suggested that TDM of sunitinib could be helpful for avoiding severe toxicities, resulting in prolonged TTF and PFS upon sunitinib therapy.
However, this was a retrospective analysis of a small number of patients consisted
of heterogeneous population. Therefore, these results need to be validated in a large
25
Acknowledgements
This work was supported in part by Grant-in-Aid for Scientific Research from the
26
References
1. Motzer RJ, Hutson TE, Tomczak P, et al. Sunitinib versus interferon alfa in
metastatic renal-cell carcinoma. N Engl J Med 2007; 356:115-24.
2. Flaig TW, Kim FJ, La Rosa FG, et al. Colonic pneumatosis and intestinal
perforations with sunitinib treatment for renal cell carcinoma. Invest New
Drugs 2009; 27:83-7.
3. Boyle HJ, Chatté G, Rivoire M, et al. Lung toxicity in a patient treated with
sunitinib. Eur Respir J 2012; 40:1300-3.
4. Feyerabend S, Schilling D, Wicke C, et al. Toxic dermatolysis, tissue necrosis
and impaired wound healing due to sunitinib treatment leading to forefoot
amputation. Urol Int 2009; 82:246-8.
5. de Jonge ME, Huitema AD, Schellens JH, et al. Individualised cancer
chemotherapy: strategies and performance of prospective studies on therapeutic
drug monitoring with dose adaptation: a review. Clin Pharmacokinet 2005;
44:147-73.
6. Picard S, Titier K, Etienne G, et al. Trough imatinib plasma levels are
associated with both cytogenetic and molecular responses to standard-dose
27
7. Guilhot F, Hughes TP, Cortes J, et al. Plasma exposure of imatinib and its
correlation with clinical response in the Tyrosine Kinase Inhibitor Optimization
and Selectivity Trial. Haematologica 2012; 97:731-8.
8. Lu JF, Eppler SM, Wolf J, et al. Clinical pharmacokinetics of erlotinib in
patients with solid tumors and exposure-safety relationship in patients with
non-small cell lung cancer. Clin Pharmacol Ther 2006; 80:136-45.
9. Hamada A, Sasaki J, Saeki S, et al. Association of ABCB1 polymorphisms with
erlotinib pharmacokinetics and toxicity in Japanese patients with
non-small-cell lung cancer. Pharmacogenomics 2012; 13:615-24.
10. Britten CD, Kabbinavar F, Hecht JR, et al. A phase I and pharmacokinetic
study of sunitinib administered daily for 2 weeks, followed by a 1-week off
period. Cancer Chemother Pharmacol 2008; 61:515-24.
11. Adams VR, Leggas M. Sunitinib malate for the treatment of metastatic renal
cell carcinoma and gastrointestinal stromal tumors. Clin Ther 2007;
29:1338-53.
12. Mizuno T, Terada T, Kamba T, et al. ABCG2 421C>A polymorphism and high
exposure of sunitinib in a patient with renal cell carcinoma. Ann Oncol 2010;
28
13. Hu S, Chen Z, Franke R, et al. Interaction of the multikinase inhibitors
sorafenib and sunitinib with solute carriers and ATP-binding cassette
transporters. Clin Cancer Res 2009; 15:6062-9.
14. Noguchi K, Katayama K, Mitsuhashi J, et al. Functions of the breast cancer
resistance protein (BCRP/ABCG2) in chemotherapy. Adv Drug Deliv Rev
2009; 61:26-33.
15. Kimchi-Sarfaty C, Oh JM, Kim IW, et al. A "silent" polymorphism in the
MDR1 gene changes substrate specificity. Science 2007; 315:525-8.
16. Je Y, Schutz FA, Choueiri TK. Risk of bleeding with vascular endothelial
growth factor receptor tyrosine-kinase inhibitors sunitinib and sorafenib: a
systematic review and meta-analysis of clinical trials. Lancet Oncol 2009;
10:967-74.
17. Eisenhauer EA, Therasse P, Bogaerts J, et al. New response evaluation criteria
in solid tumours: revised RECIST guideline (version 1.1). Eur J Cancer 2009;
45:228-47.
18. Noda S, Kageyama S, Tsuru T, et al. Pharmacokinetic/Pharmacodynamic
Analysis of a Hemodialyzed Patient Treated with 25 mg of Sunitinib. Case Rep
29
19. Faivre S, Delbaldo C, Vera K, et al. Safety, pharmacokinetic, and antitumor
activity of SU11248, a novel oral multitarget tyrosine kinase inhibitor, in
patients with cancer. J Clin Oncol 2006; 24:25-35.
20. Sugiyama Y, Mimura N, Kuwabara T, et al. Effect of benidipine on simvastatin
metabolism in human liver microsomes. Drug Metab Pharmacokinet 2007;
22:199-205.
21. Houk BE, Bello CL, Poland B, et al. Relationship between exposure to
sunitinib and efficacy and tolerability endpoints in patients with cancer: results
of a pharmacokinetic/pharmacodynamic meta-analysis. Cancer Chemother
Pharmacol 2010; 66:357-71.
22. de Wit D, Gelderblom H, Sparreboom A, et al. Midazolam as a phenotyping
probe to predict sunitinib exposure in patients with cancer. Cancer Chemother
Pharmacol 2014; 73:87-96.
23. Mendel DB, Laird AD, Xin X, et al. In vivo antitumor activity of SU11248, a
novel tyrosine kinase inhibitor targeting vascular endothelial growth factor and
platelet-derived growth factor receptors: determination of a
pharmacokinetic/pharmacodynamic relationship. Clin Cancer Res 2003;
30
24. Uemura H, Shinohara N, Yuasa T, et al. A phase II study of sunitinib in
Japanese patients with metastatic renal cell carcinoma: insights into the
treatment, efficacy and safety. Jpn J Clin Oncol 2010; 40:194-202.
25. Motzer RJ, Escudier B, Oudard S, et al. Phase 3 trial of everolimus for
metastatic renal cell carcinoma : final results and analysis of prognostic factors.
Cancer 2010; 116:4256-65.
26. Rini BI, Escudier B, Tomczak P, et al. Comparative effectiveness of axitinib
versus sorafenib in advanced renal cell carcinoma (AXIS): a randomised phase
3 trial. Lancet 2011; 378:1931-9.
27. Mizuno T, Fukudo M, Terada T, et al. Impact of Genetic Variation in Breast
Cancer Resistance Protein (BCRP/ABCG2) on Sunitinib Pharmacokinetics.
Drug Metab Pharmacokinet 2012; 27:631-9.
28. Mizuno T, Fukudo M, Fukuda T, et al. The Effect of ABCG2 Genotype on the
Population Pharmacokinetics of Sunitinib in Patients With Renal Cell
Carcinoma. Ther Drug Monit 2014; 36:310-6.
29. Kim HR, Park HS, Kwon WS, et al. Pharmacogenetic determinants associated
with sunitinib-induced toxicity and ethnic difference in Korean metastatic renal
31
30. Diekstra MH, Klümpen HJ, Lolkema MP, et al. Association Analysis of
Genetic Polymorphisms in Genes Related to Sunitinib Pharmacokinetics,
Specifically Clearance of Sunitinib and SU12662. Clin Pharmacol Ther 2014;
32
Legends for figures
Fig. 1 The relationship between total sunitinib concentration and hematological toxicity
For the first cycle of sunitinib treatment, platelet count (a), hemoglobin level (b), and
leukocyte count (c) at nadir were compared with trough total sunitinib (sunitinib +
SU12662) at a steady state in 21 patients with renal cell carcinoma (RCC). Each symbol
represents an individual patient.
Fig. 2 The relationship between total sunitinib concentration and non-hematological toxicity
For the first cycle of sunitinib treatment, anorexia (a), fatigue (b), hand-foot syndrome
(c), hypertension (d), and bleeding event (e) were compared with trough total sunitinib
at a steady state in 21 patients with RCC. All adverse events were graded using the
Common Toxicity Criteria for Adverse Effects v4.0. Each symbol represents an
individual patient.
33
exposure to sunitinib
Serum concentrations of total sunitinib during sunitinib therapy in a patient who
experienced intestinal perforation. Arrows indicate the occurrence of perforation of the
sigmoid colon. Gray area shows the therapeutic range of sunitinib (50-100 ng/ml)
(reference 23).
Fig. 4 Waterfall plot of the greatest percentage change from baseline in the sum of the longest diameters of target lesions
Open squares, patients with a total sunitinib concentration <100 ng/mL; closed squares,
patients with a total sunitinib concentration ≥100 ng/mL.
Fig. 5 Kaplan-Meier curve of time to treatment failure (TTF) (a), progression-free survival (PFS) (b), and overall survival (OS) (C) according to sunitinib exposure in patients with renal cell carcinoma
Solid lines, patients with a total sunitinib concentration <100 ng/mL; dotted lines,
patients with a total sunitinib concentration ≥100 ng/mL. Small closed diamond marks
34
Fig. 6 The relationship between total sunitinib concentration and SNPs related to the PK of sunitinib
We examined the effect of genetic polymorphism in CYP3A5 (a), ABCG2 (b-d), and
1
Table 1 Selected SNPs related to sunitinib PK
gene SNPs rs number Region CYP3A5 CYP3A5 6986G>A rs776746 Intron
ABCG2 ABCG2 421C>A rs2231142 Non-synonymous Q141K ABCG2 ABCG2 34G>A rs2231137 Non-synonymous V12M ABCG2 ABCG2 1143C>T rs2622604 Intron
ABCB1 ABCB1 1236C>T rs1128503 Synonymous G412G ABCB1 ABCB1 2677G>T/A rs2032582 Non-synonymous A893S/T ABCB1 ABCB1 3435G>T rs104642 Synonymous I1445I
Table
2
Table 2 Patient Characteristics
Chracteristic total (n=21) total sunitinib concentration P
<100 (n=13) ≥100 (n=8)
Median Age (range), yr 68 (56-83) 68 (56-83) 70 (59-79) 0.92
Gender (Male/Female) 17/4 10/3 7/1 0.50
Median Weight (range), kg 56 (37-80) 56 (37-74) 50 (45-80) 0.33 Median AST (range), IU/L 22 (9-86) 22 (9-59) 26 (19-86) 0.41 Median ALT (range), IU/L 13 (6-104) 16 (7-59) 11 (6-104) 0.46 Median eGFR (range),
mL/min/1.73m2
41.8 (6.2-80.4) 41.5 (6.2-80.4) 50.8 (30.3-76.7) 0.50
Median sunitinib concentration (range), ng/mL
64.6 (30.6-137) 49.8 (30.6-75.6) 108 (64.7-137) <0.01
Median SU12662 concentration (range), ng/mL
22.5 (12.4-68.5) 22.7 (12.4-43.7) 22.3 (13.0-68.5) 0.75
Median total sunitinib concentration (range), ng/mL 91.8 (49.8-205) 80.2 (49.8-93.5) 125 (106-205) <0.01 Initial dose, n (%) 50 mg 11 (52.4) 4 (30.8) 7 (87.5) 0.03 37.5 mg 5 (23.8) 5 (38.4) 0 (0.0) 25 mg 5 (23.8) 4 (30.8) 1 (12.5) Histology, n (%) Clear cell 18 (85.7) 11 (84.6) 7 (87.5) 0.62 papillary 3 (14.3) 2 (15.4) 1(12.5) Prior treatment, n (%) No 12 (57.1) 7 (53.8) 5 (62.5) 0.67 sorafenib 5 (23.8) 4 (30.8) 1 (12.5) Immunotherapy 4 (19.2) 2 (15.4) 2 (25.0)
ECOG performance status, n (%)
0 16 (76.2) 10 (76.9) 6 (75.0) 0.93
1 3 (14.3) 2 (15.4) 1 (12.5)
2 2 (9.5) 1 (7.7) 1 (12.5)
AST, aspartate aminotransferase; ALT, aranine aminotransferase; eGFR, estimated glomerular filtration rate; ECOG, Eastern Cooperative Oncology Group
3
Table 3 Polymorphism genotype and allele frequency
Gene SNPs Patients Homozygous wild-type
Heterozygous Homozygous variant
Allele frequency
CYP3A5 CYP3A5 6986G>A 21 13 4 4 0.286
ABCG2 ABCG2 421C>A 21 11 8 2 0.286
ABCG2 ABCG2 34G>A 21 15 5 1 0.167
ABCG2 ABCG2 1143C>T 21 17 4 0 0.095
ABCB1 ABCB1 1236C>T 21 2 6 13 0.761
ABCB1 ABCB1 2677G>T/A 21 3 10 8 0.619
P< 0.05
Fig.1
0 50 100 150 200 0 50 100 150 200 250Total sunitinib concentration (ng/mL)
P lat e let co u n t (× 10 3)/ μ L 0 5 10 15 20 25 0 50 100 150 200 250
Total sunitinib concentration (ng/mL)
Hem o g lob in lev e l ( g /dL ) 0 5 10 15 20 0 50 100 150 200 250
Total sunitinib concentration (ng/mL)
L e u ko cy te co u n t (× 10 3)/ μ L r=-0.53 r=0.04 P=0.86 r=0.14 P=0.55
(a)
(b)
(C)
FigureP< 0.05 P< 0.05
P= 0.13
Anorexia
Fatigue
Hand-foot syndrome
Bleeding event
Hypertension
Fig. 2
(a)
(b)
(c)
(e)
(d)
0 50 100 150 200 250 0.75 0 1.25 1.751 2.252/3 2.75 Grade T o ta l su n itinib (ng /mL ) 0 50 100 150 200 250 0.75 01.25 1.751 2.252/3 2.75 Grade T o ta l su n itinib (ng /mL ) 0 50 100 150 200 250 0.5 Without1 1.5 With2 2.5 T o ta l su n itinib (ng /mL ) 0 50 100 150 200 250 0.75 0 1.25 1.751 2.25 2/32.75 Grade T o ta l su n itinib (ng /mL ) 0 50 100 150 200 250 0.75 0 1.25 1.751 2.252/3 2.75 Grade P= 0.22 P= 0.86 T ot al sun iti nib (ng /mL )Sunitinib 50 mg
T
ot
al
s
unit
inib
c
onc
ent
rat
io
n
(
ng
/mL
)
(day)
0
50
100
150
200
250
0
20
40
60
80
Sunitinib 37.5 mg
perforation of the sigmoid colon
Patients with total sunitinib
≥100 ng/mL (n=7)
Patients with total sunitinib <100 ng/mL (n=11)
Fig. 4
-60%
-50%
-40%
-30%
-20%
-10%
0%
10%
20%
Bes
t
percen
tage
c
hange from
bas
el
ine
decrease
no change
increase
Day after initiation of sunitinib therapy (day)
Day after initiation of sunitinib therapy (day) Day after initiation of sunitinib therapy (day)