The Dinegentropy of Diagnostic and Detection Tests by
Nozer D. Singpurwalla
The City University of Hong Kong, Hong Kong February, 2018
1 Introduction.
Assessing the efficacy of diagnostic tests when their receiver operating char‐ acteristic curves cross has been an open problem for quite some time. In this note, we outline a proposed solution to this problem based on an information theoretic measure which I. J. Good has labeled dinegentropy. We illustrate the effectiveness of this measure, empirically, via an example. The detailed development of our arguments which lead to the proposed measure have been delegated to a more comprehensive document.
2 Preliminaries
Diagnostic testing plays a key role in medicine, threat detection, supervised classification, signal processing, the verification and validation of test ban treaties, alerts for tornadoes, tsunamis and earthquakes and the evaluation zero‐net investment Strategies in finance. However, diagnostic tests are not perfect; they are prone to misdiagnosis and the generation of false alarms.
Assume a disease (or threat) we are interested in diagnosing (or detecting).
The disease spawns a single measurement variable Z, that is compared to a thresholdT. An individual is classified D‐ for diseased‐ ifZ>T; otherwise the individual is classified N ‐ for normal. The classification is done by a
diagnostician (who is a decision maker), say
\mathscr{D}.Were T be set to say t, then the sensitivity of the test, denoted
S_{e}(t)
isthe probability of correctly classifying a diseased individual. Similarly, the probability of correctly classifying a normal individual is denoted by
S_{p}(t)
, the specificity of the test. Ideally, one wants bothS_{e}(t)
andS_{p}(t)
to be close to one, but for this to happen, the distribution of Z for D and N should have little or no overlap. Otherwise an increase inS_{e}(t)
will cause a decrease inS_{p}(t)
and vice‐versa. The parametersS_{e}(t)
andS_{p}(t)
are therefore adversarial.3
The Receiver Operating Characteristic Curve.
The adversarial character of sensitivity and specificity is encapsulated via
the receiver operating characteristic curve (ROC) which is a plot of (1
-S_{p}(t))
versusS_{e}(t)
. The ROC is monotonically increasing, continuous, and differentiable everywhere. It is concave in(1-S_{p}(t))
, if for all z,F_{0}(z)
\geqF_{1}(z)
; it will have a convex segment wheneverF_{1}(z)
>F_{0}(z)
. Here,F_{0}(F_{1})
are the distributions of Z under
N(D)
. When F_{0} and F_{1} are specified, then two tests, each having their own classification thresholds can be compared to assess as to which of the two superior. An omnibus way to do so is via the area under the ROC, abbreviated AUC. The AUC is a satisfactory metric of comparison when the ROC’s of the two tests do not cross. This will happen when F_{0} and F_{1} do not cross.Note that the AUC\in
(0,1)
, with 1 corresponding to a test providing aperfect diagnosis, and an AUC=.5 being given by a test whose diagnosis is random; i.e. diagnosis by the flip of a coin. All ROC’s below the diagonal line correspond to tests that are worse than a random test.
also reflected by what we introduce here as the Gini Coefficient, G_{F_{0},F_{1}}, not to be confused with the Gini Index of economic inequality. Specifically,
G_{F_{0},F_{1}} =2(AUC)-1
.
(3.1)
G_{F_{0},F_{1}} =1, when the diagnostic is perfect; it is 0 when the test is random.When the ROC’s of two tests cross, alternatives to the AUC have been proposed. These are ad hoc, and their credibility remains to be assessed. In what follows we offer an approach to comparing two diagnostic tests over a range of applications, when their ROC’s cross. Our approach is based on information theoretic considerations and is therefore grounded in this theory. The efficacy of our approach is illustrated by an example.
4
The Dinegentropy of an ROC Curve.
We propose the Jeffreys‐Good distance or per Good (1987), the dinegen‐
tropy of an ROC as an omnibus measure for comparing two ROC curves, irrespective of their crossing properties. We motivate a use of this measure by considering the Kullback‐Leibler distance between a reflected ROC curve, viewed as a distribution function, and the diagonal ROC curve as a reference distribution function, and then reversing the roles of these distributions to obtain a complementary Kullback‐Leibler distance. The dinegentropy is the sum of the above two distance. This process leads to the following theorem;the detailed proof is in Singpurwalla (2018).
Theorem:
The dinegentropy of an ROC curve with
f_{0}(f_{1})
as the probability densities ofF_{0}(F_{1})
is:5
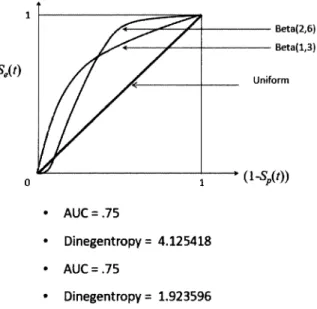
Demonstration of Efficacy.
The figure below demonstrates the efficacy of the dinegentropy measure for distinguishing between two diagnostic tests whose ROC’s cross but which have the same value of the AUC. The
S_{e}(t)
’s of the two tests are based on the distribution functions of beta‐distributed random variables with parameters 2 and 6, and 1 and 3, respectively. These distribution functions cross, but their resulting AUC’s are the same, namely, .75. By contrast their dinegentropies differ, namely, 4.125 for the former, and 1.923 for the latter.It has been argued in the reference mentioned above, that the diagnostic test with the larger dinegentropy is the better test.
6 References.
[1] GOOD I. J. (1989). “The Contributions of Jeffreys to Bayesian Statistics” Bayesian Analysisi in Econometrics and Statistics: Essays in Honor of Harold Jeffreys, ed. by A. Zellner. Kreiger Publishing. pp 21‐34.
[2] SINGPURWALLA, N. D. (2018). “The Stochastics of Diagnostic and Threat Detection
Tests” Under Review.
7
Acknowledgements.
Supported in part by the U.S. National Science Foundation Grant DMS‐09‐15156 and The City University of Hong Kong Project Numbers 9380068 and 9042083,
City University of Hong Kong, Hong Kong. nsingpur@cityu.edu.hk
\mathrm{a}\{2,6\} \mathrm{a}\{\mathrm{L}3\} S_{e}(t) AUC =.75 Dinegentropy=4.125418 AUC =.75 Dinegentropy= 1.923596