Spectral Analysis of Aftershocks of the 1978
Miyagiken-oki Earthquake
著者
Takemura Masayuki, Masuda Tetsu, Goto
Kazuhiko, Ito Akihiko, Hamaguchi Hiroyuki
雑誌名
Science reports of the Tohoku University. Ser.
5, Geophysics
巻
26
号
3-4
ページ
101-110
発行年
1980-03
URL
http://hdl.handle.net/10097/44771
Sci. Rep. TOhoku Univ., Ser. 5, Geophysics, Vol. 26, Nos. 3-4, pp. 101-110, 1980.
Spectral
Analysis of Aftershocks of the 1978
Miyagiken—oki Earthquake
MASAYUKI TAKEMURA, TETSU MASUDA, KAZUHIKO GOTO,
and HIROYUKI HAMAGUCHI
Geophysical Institute, Faculty of Science, TOhoku University, Sendai 980, Japan
A KIHIKO ITO
Abstract: The aftershock region of the Miyagiken-oki earthquake on June 12, 1978 (M =7 .4) is separated into eastern and western parts by a seismic gap along 142°E and at 33km in depth. The focal depths of aftershocks in the eastern region are shallower than those in the western region.
Analog records of P waves for 110 aftershocks (.11/-1.8,-,3.6), which were observed at Saikawa (SAK) in Miyagi prefecture, are filtrated by the use of six band-pass filters with center frequencies from 1 to 32 Hz. Source spectra of the aftershocks are calculated from the amplitudes of these filtrated records which are corrected by the factors of inelastic attenuation and geometrical spreading. The corner frequencies of most spectra lie between 4 and 16 Hz and decrease with increasing spectral amplitude
at 4 Hz, which corresponds to seismic moment. The spectral amplitude at 4 Hz for the aftershocks in the western region is on the average 2.4 times larger than that in the eastern region for a fixed corner frequency. This implies that the average stress drop of aftershocks in the western region is larger than that in the eastern region.
I. Introduction
It has frequently been reported that the mechanism of earthquake occurrence depends strongly on regional characteristics such as geological structure and/or stress distribution in a source region, and that the source spectrum of an earthquake shows the variation closely related to the location of hypocenter. For example, Tsujiura (1969) and Wyss and Brune (1971) reported some cases where high frequency components of source spectrum increase with increasing depth of hypocenters. The variation in the source spectrum has sometimes been interpreted in terms of the change in stress drop. Aoki (1976) and Masuda (1978) demonstrated the increase of stress drop with depth for shallow microearthquakes occurring in Taoku district (northeastern part of Honshu), Japan.
A big earthquake named Miyagiken-oki earthquake (M=7.4) occurred off the northeastern Pacific coast of Japan on June 12, 1978. The result of Observation Center for Earthquake Prediction, TOhoku University (1978) clearly indicated that all the aftershocks have taken place at the upper boundary of subducting Pacific plate in this district. Another interesting feature reported by the Center (1978), as well as by the relocation work by Hamaguchi et al. (1979), is that a seismic gap along 142°E separates the aftershock region into eastern and western parts. The main purpose of this study is to examine whether or not is there any difference between source specrta of aftershocks in the two parts, and to get the information on difference in stress conditions in the two regions.
102 MASAYUKI TAKEMURA ET AL.
2. Data and method of analysis
Many of aftershocks of the Miyagiken-oki earthquake were observed by the network stations of TOhoku University together with several temporary stations , locations of stations being shown in Fig. 1. The data for the present study are based on the seismograms of vertical component recorded by an electromagnetic seismometer with natural frequency of 1 Hz at one of the temporary stations; Saikawa (SAK) at 37. 813°N, 140.841°E. Detailed descriptions about observational system at SAK are given in the paper by Hamaguchi et al. (1979).
The hypocenters of aftershocks are relocated by Hamaguchi et al. (1979) using P and S times at all stations. The horizontal and vertical distributions of hypocenters during the period from June 13 to June 30 are represented in Figs . 2 (a) and (b), respec-tively. These figures indicate that the aftershocks are concentrated in a .region between
Fig. 13TE 140 142 • Makukawa • Yamizo K N K Sai kawa 42°N I I
1 Location of stations. Crosses indicate network station of TOhoku University. Stations except Yamizo represented by solid circles are temporary stations. Yamizo is a permanent station of Utsunomiya University. A cross off KNK station indicates the location of epicenter of the 1978 Miyagiken-oki earthquake.
(a) Fig. 2 (a) (b) (b) 60 km JUNE 30
Location of epicenters of aftershocks from June 13 to June 30. Location of hypocenters projected on a vertical E-W cross section.
AFTERSHOCKS OF THE MIYAGIKEN-OKI EARTHQUAKE 103
141.5°E and 143.0°E, 38.0°N and 38.7°N, and that most aftershocks are located on a plane dipping towards west. As stated before, there is a seismic gap along 142°E, corresponding depth being 33 kin, and the aftershock region can be divided into two parts. The eastern or shallower part will be tentatively referred to as A and the western or deeper part as B in the following discussion.
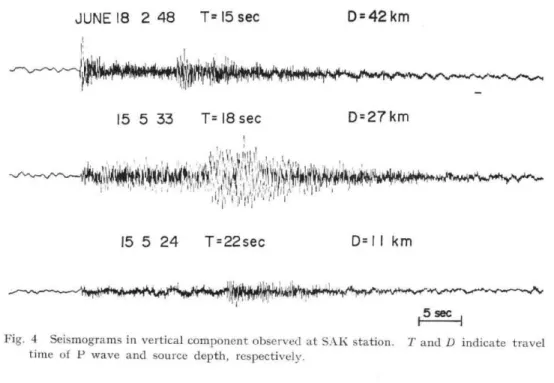
The spectral analysis is made for 110 seismograms of the aftershocks in the regions A and B. The magnitudes of these events range from 1.8 to 3.6. The so-called analog method (Tsujiura, 1966 and 1967) is adopted using six band-pass filters of which frequency characteristics are illustrated in Fig. 3. Center frequencies of the filters are 1, 2, 4, 8, 16, and 32 Hz and attenuation slope is 24 dBioct. Some examples of original seismograms and their filtrated records are given in Figs. 4 and 5, respectively.
According to Aki and Chouet (1975), the maximum amplitude A of a wavelet is approximately expressed by the product of amplitude spectral density F and twice the band width Af,
F = Al2Af (1)
Thus, defining the band width so as to be the frequency range between two —3 dB points in amplitude response of each filter, the amplitude spectrum of P waves can be estimated from the filtrated record by using equation (1).
For the comparison of source spectra, the above estimated spectral amplitude must be corrected by the factors of inelastic attenuation, geometrical spreading and radiation pattern. In this study the correction of geometrical spreading is made under the assumption of point source in homogeneous infinite space and the coefficient of radiation pattern is assumed to be 1.0 for every event. These assumptions are considered to be permissible from the following approach. Fig. 6 shows the relation between the spectral amplitude at 4Hz of each aftershock and its magnitude determined by Observation
la -13 ..-. 0 -10 :.= a Et co = -20 = 0. E < -30 1 Frequency
Fig. 3 Frequency characteristics of band pass
I0 100Hz
104 MASAYUKI TAKEMURA ET AL. JUNE 18 2 48 T= 15 sec D=42 km i ! 15 5 33 T= 18 sec Dr, 27km
ill,11111,111
11
1111 11 ‘\ii*okii01
,1401/011
,)4,111,,
11,1 15 5 24 T=22 sec D= I I km Fig. , ,5 sec4 Seismograms in vertical component observed at SAK station . time of P wave and source depth, respectively .
T and D indicate travel
rfti-JUNE 5 5 24
T•22sec l• h0•11km
TITI4 •111
j - 7 Hz
Iiittilfk qr.
11
JUNE
15
5 33 T.1132
11111^11, idili11114 [LI JUNE 15 5 33 T=113 sec = ~~_ ~ ~`-~~.
__~1-111--FN.: I I km
1-7-1-
5sec'T[
ENJ--
fttE
II H-11111'1ti;[-Iii7
7 Ff 1"Fr 1-I 11- -11+ ;LH ITT TI1 iT 1 1 1•1 LI 4 {LIL 1-ljii1'f'T' FLTZ
.
11.1011.41Tff
:Tr If H F 1_1 -h LF-.1^^ I. I 111ti
f41- IH 1-1-1 1-I-4-AL'iI I I ; 111 - itt[1177 -FH 7 1=1 1 f !-I• Fr I f !! D. 27kal.!rrk.
!fl t'fil
pr
1, - 1- 17 f_TI717-71177-TT'ri
rr177IIH 1 [fi -111 •i• ^ -T1] 117 -11M1 j±1 -14111,5 :444-144441;1 Tt V,141114 .1-1-1+MUFP 111-1-1 F Z-L I tF 14 ]
7
fL *440 11-H ITR7
JUNE 18 2 48 T.15 sec -• • 0.42kmIi
1 ! t ^1^-1 T f I I '.1-tx T 1: L I f. LEI f. :r1[r
i
_I Ill 1. 14 TT Yfi 4 k I rr f hTil-
,1, 1 i fl 4041HI
1 H-'I -4AFTERSHOCKS OF THE MIYAGIKEN-OKI EARTHQUAKE 105
Center for Earthquake Prediction, TOlioku University, based on the F-P time, i.e., the total duration of earthquake motion. All the spectral amplitudes at 4Hz are equalized to a hypocentral distance of 100 km and are corrected by the attenuation factor which will be estimated in the next section. The solid and open circles in the figure indicate the aftershocks in the regions A and B, respectively. The logarithmic spectral am-plitude at 4Hz with the corrections described above is in proportion to the magnitude of aftershocks in both regions and the difference between the relations in regions A and B is negligible.
3. Attenuation factor
Some typical examples of displacement spectra for P waves observed at SAK station are given in Fig. 7. This figure shows that the corner frequencies for most of events are between 4 and 16 Hz and that they have a tendency of decrease with increasing amplitude at 4 Hz which corresponds to the seismic moment of the earthquake. The ratio of spectral amplitudes at 16 and 32 Hz is seen in Fig. 8, which indicates no systematic change in the ratio against the amplitude at 4Hz. This implies that the
Qr I 2 Fig. 3.5 3.0 2.5 2.0 • • • • CD • o• • ••s) • o • • • • Ole 0 • • 0 0 • • 0•1011C•••100 • 000 o• Go CD • 4ID aris • CD GO OS • 0 CD 0000 0 COCD •0. I • O • • 10-8 10-7 10-6 ci•sec Spectral Amplitude (4 Hz) 6 Relation between magnitude obtained from F-P time and spectral amplitude at 4Hz. The magni-tudes are ,determined by Observation Center for Earthquake Prediction, TOhoku University. The spectral amplitudes are corrected with O =1000 and equalized to a hypocentral distance of 100 km. Solid and open circles indicate the values of the events in the regions A and B, respectively.
Zi ev to E 0 E I- ,.. 4-• U 0 0. Cl, al .0 •M .4- =a E ..1 Fig. I0 Frequency 7 Some examples spectra of aftershocks SAK station. Hz of P wave observed at
106 MASAYUKI TAKEMURA ET AL. 102 2 .-. CV PI 0 ...., W 0 z _-.. cr )I0 -0 = ..- 0. E a lo° •• • •• ••• a • • • •• • •• • W1111.• • •••• •• • • a • • • • • ••,,• S.•• • IC/ Spectral 10-7 Amplitude 10-6 cm•sec (4Hz) P10 's. go 41; 8 7. c ir 6 Fig 15 20 Travel Time
Fig. 8 Relation between
32Hz) and amplitude
the spectral ratio (16 Hz/ (4Hz).
Sec
9 Relation between the spec-tral ratio (16Hz/32Hz) and travel time. The ratios are averaged for a interval of 1 sec in P wave travel time. Solid curve indicates the best fit curve calculated by the least squares method.
U a) (I)
E
0 E = i—t
a) 0. (0 CD ZS = 4^ ...^ ca. E ct 10Frequency
Hz E z i-t w 0. U) il) 1, = :1- < b 1.80±025 30 W-b FrequencyFig. 10 Some examples All the spectra are 1000 and equalized distance of 100 km.
of source spectra. corrected with Q= to a hypocentral
Fig. 11 Schematic source spectra considered from the observed data. The decay rate in spectral amplitude beyond corner fre-quency is proportional to w--1.s°2s and corner of each spectrum lies on a slope of w-a. The scale of vertical and hor-izontal axes is logarithmic.
AFTERSHOCKS OF THE MIYAGIKEN-OKI EARTHQUAKE 107
slope of decay of spectrum in the frequency range higher than 16 Hz is independent of the size of earthquakes or the value of corner frequency. Then the attenuation factor may be obtained from the ratio of observed spectral amplitudes at 16 and 32 Hz, say R(T), according to the relation,
R(T) Rs. exp (161177Q) , (2) where Rs is the ratio of source spectrum at 16 and 32 Hz, T is travel time and Q is quality factor for P wave. The values of R(T) are averaged for an interval of 1 sec in travel time and represented in Fig. 9 versus T. The best fit curve by means of least squares method gives the values of Q and Rs of 1000±200 and 3.5±0.6 respectively.
Source spectra obtained from the observed spectra in Fig. 7 by the use of the above estimated quality factor are seen in Fig. 10. All the spectra are equalized to a hypocentral distance of 100 km. The simple model for source spectrum may be considered from them to be such that (1) the spectral amplitude at 4Hz or less is flat corresponding to the seismic moment, (2) the corner frequency increases with dcreasing seismic moment, (3) the decay rate in spectral amplitude beyond corner frequency is constant and (4) the slope of the decay in spectral amplitude beyond corner frequency has the same value irrespective of size of earthquake. This model is schematically illustrated in Fig. 11. The slope of decay beyond corner frequency is evaluated to be proportional to w-48±0.25 from the observed ratio of Rs and the rate of change in the amplitude at 4 Hz which corresponds to seismic moment, with respect to the corner frequency is assumed to be proportional to w-3•° based on the obtained source spectra.
4. Comparison of source spectra for aftershocks in the regions A and B The relation between spectral amplitudes at 4 and 16 Hz is examined to investigate the difference in source spectra in the regions A and B. The amplitudes at 16 Hz for the aftershocks in each region are represented against those at 4 Hz in Fig. 12, where the amplitudes are corrected with Q=1000 and normalized to those at 100 km in distance. The upper and lower figures correspond to the regions A and B, respectively.
From our model described in the previous section, the relation between amplitudes at 4 and 16 Hz is expected as follows: For small earthquakes whose corner frequency is above 16Hz, the amplitude at 4Hz is equal to that at 16Hz and the relation should follow the straight line represented by ab in Fig. 12. For large earthquakes whose corner frequency is lower than 4Hz, on the other hand, the ratio of amplitudes at 4 and 16Hz should be kept constant irrespective of earthquake size. Then the relation should be expressed by the line cd. For intermediate earthquakes of which the corner frequency lies between 4 and 16 Hz, the relation is expected to be shown by the line bc in Fig. 12. Therefore, the points of b and c indicate the amplitudes for the earthquakes with the corner frequencies of 16 and 4 Hz respectively. This situation is well represented by the actual data shown in Fig. 12.
However, there is a difference between Fig. 12(A) (upper figure) and Fig. 12(B) (lower figure), which correspond to the aftershocks in the regions A and B respectively. The lines bc in Figs. 12(A) and 12(B) represent the results of best fit estimate by
108 IVIASAYUKI TAKEMURA ET AL. Fig. '--10• N W a) -o -.2I0 75. E 10 -5 U .
a10
cm•secA .( h =
0- 33 km) e•:61
.4• ^ • • •'• et I •
Fe •
B.( h=33-60km)
•
• • • • • -1-- •,.011 —•• •Ol'ir4o•,
b
•••.-0--
•
•s•!•-•
••
4/--••
• • $3 • • • ,d
d
cm•sec 10-8 10-7 10-6 10-5 Spectral Amplitude (4Hz)12 Relation between spectral amplitudes at 16 and 4 Hz. All the amplitudes are cor-rected with Q= 1000 and equalized to a hypocentral distance of 100 km. h indicates the range of focal depth of aftershocks in the regions A and B. The solid and dotted lines with a, b, c and d are explained in the text. The upper and lower figures are called (A) and (B), respectively.
means of least squares method, the gradient of the lines being fixed according to our model. Dotted lines show the error range determined by the standard deviation around the lines bc. It is found that the best fit lines in Figs. 12(A) and 12(B) differ from each other. Actually the abscissa, which is the amplitude at 4Hz, of the points of b and c for the aftershocks in the region A (Fig. 12(A) ) is calculated to be 1.38x 10⁻⁸cm•sec and 8.81 x 10 -7 cm•sec respectively, on the other hand, the abscissa for events in the region B (Fig. 12(B) ) are estimated to be 3.25 X 10⁻⁸ cm•sec and 2.08 X 10⁻⁶ cm•sec. This difference implies that the amplitude at 4Hz, which correspond to seismic moment, of aftershocks in the region B is 2.4 times larger on the average than that in the region A for a fixed corner frequency. In other words, the average stress drop of aftershocks in the region B is larger than that in the region A.
AFTERSHOCKS OF THE MIYAGIKEN-OKI EARTHQUAKE 109
5. Summary and discussion
The aftershock area of Miyagiken-oki earthquake on June 12, 1978 can be divided into two regions A and B by a seismic gap along 142°E. The focal depths of after-shocks in the region A, eastern part, are shallower than those in the region B. The spectral analysis of aftershocks in each region reveals that the spectral amplitude at 4Hz, which corresponds to seismic moment, of the events in the region B is 2.4 times larger on the average than that in the region A for a fixed corner frequency. This implies that the average stress drop of aftershocks in the region B is larger than that of events in the region A.
Hamaguchi et al. (1979) shows in the statistical study on number of aftershocks during June that the b-value is smaller for aftershocks in the region B than that in the region A. According to the results of the laboratory experiments of rocks (Scholz, 1968), the b-value decreases with increasing stress level for microfracture in uniaxial com-pression. If this is applied to the aftershock occurrence in the present case, our result implies that the region B is in the state of higher stress than the region A.
Masuda (1978) stated that the stress drop of microearthquake in TOhoku region increases with its focal depth. The above conclusion in our study is compatible with his results, taking the distribution of focal depth of aftershocks in the regions A and B into consideration. Another possible interpretation is that the difference in stress drop of aftershocks is due to the difference in locations of aftershock regions A and B. The problem which of the interpretations is valid is open to further study.
Acknowledgements: We express our thanks to Prof. Z. Suzuki for his critical reading of the manuscript and many suggestions. We also thank Prof. A. Takagi and all the members of Observation Center for Earthquake Prediction, TOhoku University for their providing us with the helpful advices on data processing. This work was supported by the Grant-in-Aid for Scientific Research Project (No. 302041) as part of "the investigation of disasters caused by the 1978 Miyagiken-oki Earthquake".
References
Aki, K. and B. Chouet, 1975: Origin of coda waves: source, attenuation, and scattering effects, J. Geophys. Res., 80, 3322-3342.
Aoki, K., 1976: On the characteristics of earthquakes in Thhoku district (in Japanese) , Master thesis, TOhoku Univ., 1976.
Hamaguchi, H., T. Masuda, T. Takemura, K. Goto, A Ito, Z. Suzuki, M. Mishina and M. Suzuki, 1979: The 1978 Miyagiken-oki earthquake and its aftershock sequence (in
nese), Investigation of Disasters Caused by the 1978 Miyagiken-oki Earthquake, 35-48. Masuda, T., 1978: Vertical distribution of stress drops of microearthquakes (in Japanese),
Abstract given at the meeting of Seismological Society of Japan held in spring, 88. Observation Center for Earthquake Prediction, TOhoku University, 1978: Spatial distribution
of aftershocks of Miyagiken-oki earthquake on June 12, 1978 (in Japanese), Abstract
given at the meeting of Seismological Society of Japan held in autumn, 35.
Scholz, C., 1968: The frequency-magnitude relation of rnicrofracturing in rock and its relation to earthquakes, Bull. Seism. Soc. Am., 58, 399-416.
110 MASAYUKI TAKEMURA ET -.AL.
Tsujiura, M., 1966: Frequency analysis of seismic waves (1), Bull. Earthq. Res. Inst., 44, 873-891. Tsujiura, M., 1967: Frequency analysis of seismic waves (2), Bull. Earthq. Res. Inst., 45, 995.
Tsujiura, M., 1969: Regional variation of P wave spectrum (1), Bull. Earthq. Res. Inst., 47, 613-633.
Wyss, M., and J. Brune, 1971: Regional variation of source properties in Southern California estimated from the ratio of short-to long-period amplitudes, Bull. Seism. Soc. Am.,
61, 1153-1168.