Extended Abstract
Getting More from XPS Imaging:
Multivariate Analysis for Spectromicroscopy
A. J. Roberts,a,* S. C. Pagea and K. Takahashib1 Kratos Analytical Ltd, Wharfside, Trafford Wharf Road, Manchester, M17 1G. UK 2 Kratos Analytical Ltd, Japan Branch, c/o Shimadzu Corporation,
380-1 Horiyamashita, Hadano, Kanagawa 259-1304, Japan
*adam.roberts@kratos.co.uk
(Received: May 29, 2007; Accepted: June 27, 2007)
The spherical mirror analyser (SMA) for fast parallel XPS imaging of surfaces has been available on a commercially available photoelectron spectrometer for ten years. During this time numerous examples of both elemental and chemical state images have been published and x-ray photoelectron imaging has be-come a routine technique for the determination of lateral distribution of elements and chemical species at the surface. Here we review the properties of the SMA including spatial and energy resolution and provide examples of the capabilities of such an imaging analyser. In the last three years the combination of the SMA with a two-dimensional, pulse counting electron detector has again increased the level of information available for surface characterisation. The delay-line detector (DLD) represents the next generation of photoelectron detection for XPS imaging and has allowed the realisation of quantitative surface chemical state microscopy by x-ray photoelectron spectroscopy. To generate such information requires the acquisi-tion of multi-spectral datasets comprising a series of images incremented in energy so that each pixel con-tains photoelectron intensity as a function of energy. The datasets generated by this method contain >65,500 spectra and are therefore ideally suited to multivariate analysis to analyse the information content of the dataset and as a tool for noise reduction in individual images or spectra.
1. Overview
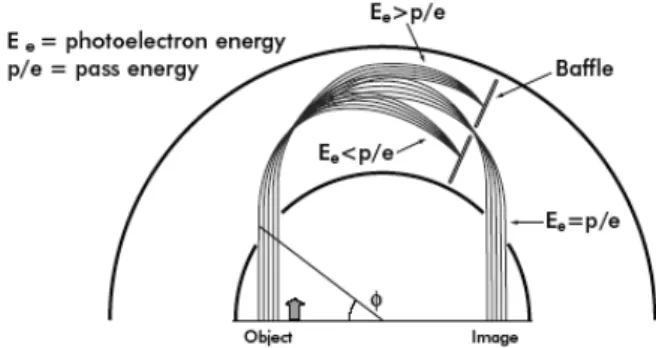
A fundamental requirement of an imaging analyser is the ability to transmit spatially distributed photoelectrons from the input lens system with minimum distortion whilst maintaining high spatial and energy resolution over a large field of view. The spherical mirror analyser (SMA), first introduced by Sar-El [1], achieves this per-formance. Figure 1 shows electron trajectories through the SMA of a parallel beam of electrons with energy E0 ±
4%. The point at which the energy dispersion is at a maximum is coincident with a second minimum in the spatial distribution of the electrons. By inserting a baffle into the SMA at this position, electrons with energy equal to that of the pass energy area transmitted, whilst those with energy greater or lower than the pass energy are not transmitted. Crucially this has no effect on the spatial resolution of the image formed at the exit plane of the analyser.
The SMA has been successfully incorporated into commercially available x-ray photoelectron spectrome-ters, as described by Page [2], where the outer hemi-sphere of the classical hemispherical sector analyser (HSA) acts as the inner hemisphere of the SMA. In imaging mode the electrons pass through the HSA to into the SMA before returning to the image plane of the HSA. A 2-dimensional detector positioned at the image pla-ne of the analyser will detect epla-nergy and spatially
solved photoelectrons. The delay-line detector (DLD) is a genuine electron pulse counting detector which is used to acquire x-y coordinates for each electron event. In-tegration of the signal over several seconds allows the generation of a truly quantitative elemental or chemical state image of the surface over a 256�256 pixel array. In the highest magnification mode the spatial resolution at the surface is <3 �m.
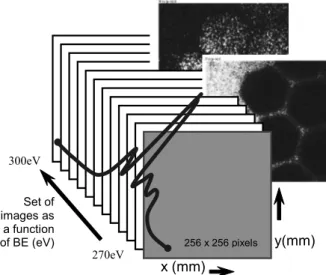
It has been established that a modern imaging XPS in-strument is capable of acquiring data that is both spa-tially and energetically resolved. Typically XPS images are acquired at a single energy, corresponding to a core level transition and corrected by subtracting a back-ground image from a lower binding energy. In many cases this approach is sufficient to characterise the dis-tribution of elements at the surface however the energy chosen for the photoemission peak may not be represen-tative of the surface chemistry across the entire field of view. Furthermore the choice of a single energy may not be capable of resolving overlapping peaks due to small chemical shifts and can not be quantified as accurately as is the case for spectroscopic analysis. These limitations may be avoided by acquiring a set of images incremented in energy resulting in a three-dimensional dataset con-taining a spectrum at each pixel of the image, shown schematically in Figure 2. By generating such data ac-cepted spectroscopic data processing techniques may be applied including genuine background subtraction and curve fitting routines for each spectrum.
A typical multi-spectral imaging experiment over a core level transition takes in the order of 75 minutes of data acquisition (30 eV energy range, 0.2 eV steps, 30
sec per image). Whilst this seems like a relatively long acquisition time for the entire experiment, on a spectrum-at-pixel basis the acquisition time for the stated example is only 68 msec. Such short acquisition times lead to very poor signal to noise ratios for a spectrum from a single pixel. However, as previously stated the large datasets generated by the experiment are suitable for multivariate analysis which can be used to gain significant improve-ment in signal to noise.
2. Principle Component Analysis
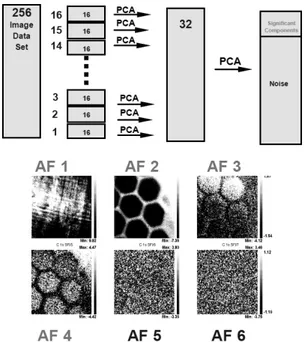
Principle component analysis (PCA) assumes that any dataset can be described by a linear combination of one or more pure components. As described in the paper by Walton [3] multiplying the data matrix by its transpose, a covariance matrix is formed which can then be decom-posed into an orthogonal dataset, using singular value decomposition (SVD) sort. From this the maximum variation in the data is partitioned into abstract compo-nents with the largest eigenvalues. The abstract factors without any obvious features can be attributed to noise. If the original dataset is reconstructed from only those abstract factors containing significant information, the result is a new dataset where the influence of the noise is reduced in magnitude. One limitation of the PCA ap-proach to noise reduction is the significant computation time required although substantial decreases can be achieved by operating on a subset of each images at a time. In the example shown in Figure 3 the dataset of 256 images is processed in groups of 16 images such that the SVD is applied to adjacent images and then stepped through the dataset instead of being applied to the entire dataset at once. The result is to move the vector contain-ing the most information to the top of the dataset.
Repeating this for a number of different components in the dataset thus moving the most significant vectors to the top of the dataset and since the number of compo-nents in XPS are significantly fewer that the number of vectors this results in a significant saving in computa-tional time. A PCA is then applied to the sorted vectors only. This approach has been termed SVD sort/reduced PCA and is discussed more rigorously by Fairley [4].
Set of images as a function of BE (eV) x (mm) y(mm) 256 256 i l 256 x 256 pixels
Fig. 2. Schematic diagram of spectra from images dataset. 300eV
3. Results and Discussion
The application of surface characterization by x-ray spectromicroscopy has resulted in a growing number of recent publications. In work by Smith and Briggs [5] the corrosion of a Ge surface forming the final layer of a multi-layer infra red optical filter is presented with the spectromicroscopy further extended to present oxide thickness images of the surface within the sampling depth of XPS. Corrosion of the surface layer was in-duced by cycling the sample between 5 and 35 C in a high humidity environment until visible discolouration was observed. XPS data were acquired from a Kratos AXIS Ultra DLD using monochromatic Al K� radiation. Images were acquired from a 400�400 �m2 area with
256�256 pixels with the SMA set at 40 eV pass energy. A survey spectrum from the corroded area showed the expected core levels and Auger series for Ge together with O 1s and small peaks from C 1s and Si 2s/2p re-sulting from hydrocarbon and silicone contamination. From this spectrum both oxide and elemental compo-nents were apparent in the Ge 3d peak but only a single (oxide) component in the Ge 2p doublet. Multi-spectral images were acquired from the O 1s region (516–550 eV) and the Ge 3d / O 2s region (20–40 eV) at 0.2eV steps with each image acquired for 60s and 300s respec-tively.
Figure 4 shows images taken from specific energy channels across the spectrum. These images are equiva-lent to images that would be acquired in a conventional
imaging experiment. For this type experiment a back-ground image would normally be subtracted from each single energy image to enhance image contrast at the expense of total intensity. Furthermore this type of back-ground removal is highly simplistic.
After acquiring the multi-spectral images CasaXPS [4] processing software was used to perform an SVD sort/reduced PCA with the data being reconstructed from the first two components of the O 1s dataset and the first three components of the Ge 3d/O 2s dataset. Spectra were constructed from a group of pixels which allowed subtraction of a genuine Shirley background followed by fitting of components to the Ge 3d envelope for the oxide and element. A further peak was fitted to the low inten-sity O 2s feature. Small variations in peak position were allowed to compensate for any lateral differential charg-ing. Computation times for SVD sort/reduced PCA fol-lowed by background subtraction and fitting of compo-nents typically take 6-10 minutes. The O 1s region the area under the envelope was simply integrated as this reduces the computation time.
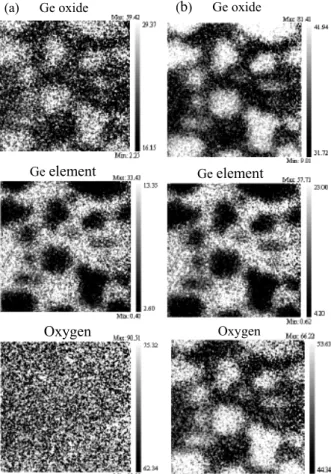
The quantified images shown in Figure 5 can be con-trasted directly with those shown in Figure 4. It can be seen that there is significant enhancement of image qual-ity through the combination of noise reduction, removal of x-ray / detector inhomo- geneities and the application of proper background removal. It is interesting that the chemical states of Ge are identified while the O 2s image correlates with the Ge oxide. Since the increase in oxide film thickness attenuates the signal from the underlying Ge these images indicate that islands of Ge oxide are formed at the surface which are thicker than the original passive oxidation layer. The lack of contrast in the O 1s image indicates that the variation in film thickness is not sensed by the O 1s photoelectrons which could be
ex-Fig. 3. SVD sort /reduced PCA processing of image dataset.
Fig. 4. Ge 3d/O 2s spectrum and representative images from the multi-spectral image dataset.
plained by a combination of lower sampling depth and the high atomic fraction of O in the oxide layer.
The processing employed also improves the S/N of spectra from individual pixels to such an extent that spectra may be meaningfully compared. The oxide thickness d may be calculated from
�
1 exp 0�
ln
cos R R
L
d� � �
where L is essentially the same attenuation length for Ge 3d electrons from the oxide and underlying metal, taken as 2.36 nm, � is the emission angle from the normal (0 for the spectrometer used), Rexp is the measured Ge 3d
intensity ratio I(Ge oxide)/I(Ge) from the sample and R0
is the same ratio for signals from infinite solids with flat surfaces measured under identical conditions. Using the equation above the data from the Ge 3d oxide/element images (Figure 5) was used to generate a thickness map, shown in Figure 6(a). Interestingly the line scan across the islands shown in Figure 6(b) can be used to deter-mine the thickness and edge profiles of the oxide islands. A measured edge (20–80% signal rise) of ~ 20 �m
sug-gests that the islands do not have abrupt edges.
By using the thickness map it is possible to sum spec-tra from all the pixels over a chosen range of oxide thicknesses. This is shown in Figure 7 where the previ-ous bicolour scale is divided into two regions roughly corresponding to the oxide islands and the areas between them. The spectra generated by summing all the grouped pixels are also shown in Figure 7. It should be noted that these spectra are generated from raw data and have not undergone the smoothing process. In this case the SVD sort/reduced PCA have simply been used as a tool to partition the data in the image.
4. Conclusions
The SMA allows high energy and spatial resolution images to be acquired very rapidly. With the use of a pulse counting delay-line detector genuine quantitative images are acquired to characterise surface distribution of elemental or chemical state species. Acquiring a set of images incremented in energy over photoemission peaks a large 3-dimensional dataset can be generated easily. The use of multivariate statistical analysis to extract the information content of the multi-spectral dataset and as a
Fig. 5. Ge oxide, Ge element and O images using (a) the Ge 3d and O 1s peaks (b) Ge 3d and O 2s peaks. Scale bars are in units of relative atomic %.
Fig. 6. (a) oxide thickness map after image smoothing. Line indicates position of linescan (b) thickness profile for linescan shown in (a).
Fig. 7. False grey scale image of oxide thickness and raw spectra summed from the thick (light) and thin (dark) oxide regions.
(a) Ge oxide (b) Ge oxide
Geelement Geelement
Oxygen Oxygen
tool for noise reduction in images or spectra has been demonstrated.
5. Acknowledgements
The Ge corrosion example presented here is by kind permission of E. Smith, University of Nottingham. The application and development of SVD sort / PCA analysis for spectromicroscopy has been lead by Drs J. Walton and N. Fairley. Their help in data processing using CasaXPS is acknowledged.
6. References
[1] H. Z. Sar-El, Nucl. Instrum. Method 42, 71 (1966). [2] S. C. Page, Charged Particle Energy Analysers
Euro-pean Patent No. EP 0 458 498 (1991).
[3] J. Walton, N. Fairley, J. Electron Spec and Rel. Phenomena 148, 29 (2005).
[4] N. Fairley, http://www.casaxps.com.
[5] E. F.Smith, D. Briggs, and N. Fairley, Surf. Interface Anal. 38, 69 (2005).
Discussion between Referees and Authors Referee 1: Dr. S. Fukushima (NIMS, Japan)
The referee judges that this manuscript is worth to publish as an advanced technology report about the two-dimensional XPS measurement. And, there are comment and question from the referee about the content as fol-lows:
[Referee1-1]
On the each data as the examples, it is desirable that there is a description of substantial measuring time and data processing time taken from beginning of treatment until displayed data is output.
[Author]
An indication of acquisition and processing times has been added to the text of the article for each of the two examples.
[Referee1-2]
The quantity of the noise should influence the result by the PCA process. Especially, if S/N of the measure-ment data are so low, it can be anticipated that the differ-ence in eigenvalue of the abstract solution and eigenval-ue of the noise component be not clearly obtained. In
addition, in above case, it can also be pointed out that the original analysis information was included in not only the main components but also the components with small eigenvalue.
[Author]
The decomposition of the data set into abstract eigen-vectors is dependent on the quantity of noise in the data, which is why it is important to acquire the image set with appropriate time to obtain an acceptable signal to noise for the entire set of images. Further, the number of im-ages used in the analysis is important since the procedure for evaluating the appropriate number of eigenvectors is essentially performed using a convergence test, that is, the analysis is repeated progressively including eigen-vectors whilst the behaviour of the results is monitored as a function of the number of eigenvectors. The proce-dure is only appropriate for image data sets for which the number of images is large compared to the number of eigenvectors containing significant structure. It is typical that only the first 2 or 3 eigenvectors are used to recon-struct the data where the number of images is typically 150-200 so that this criteria is easily satisfied.
[Referee1-3]
How the accuracy of the PCA analysis result for S/N of the measurement data evaluated?
[Author]
No one or pair of statistics can adequately guide a so-lution of the PCA procedure just as a good chi-sq is no measure of a good peak-fit for curve fitting to spectral data. Although a single statistic or equivalent of a chi-squared measure might be desirable for the PCA analysis described in the text attention is drawn to the variation of uncertainties associated with peak fitting parameters, which demonstrate the poor nature and significance to the solution of a single statistic such as the chi-squared for the case of peak modelling. The same considerations apply to the PCA procedure. The test is that the results are self-consistent, namely, spectra summed from the raw pixels are typical of the spectra generated by the PCA. [Referee1-4]
How the optimum conditions were decided at the ex-ample cases?
[Author]
has been documented by Walton and Fairley (SIA 38(8) 1230-1235). In brief they conclude that based on changes in the photoelectron peak position and FWHM across the field of view, quantification and chemical state determi-nation applied to spectrum image data sets is recom-mended at 80 eV and 40 eV pass energy respectively. There are no definitive statistics for determining the number of eigenvectors used to reconstruct the image set, therefore the technique requires a careful scientific ap-proach to its application. As a tool for investigating spa-tially resolved chemical information, it is very powerful but should be viewed as a perspective rather than defini-tive.
[Referee1-5]
And, how is the linearity (quantitatively) of the result by this method in general?
[Author]
The quantifcation of results generated from the multi-variate analysis of multispectral image experiments is in very good agreement with results acquired using con-ventional selected area spectroscopy. Results for the two methods of quantification have been shown to be in agreement within the accuracy expected by XPS.