Characterization, Comparison and
Application of Two Types of Atmospheric
Pressure Cold Argon Plasma Jets
Xiaomeng Fei
A THESIS SUBMITTED FOR THE DEGREE OF
DOCTOR OF ENGINEERING
DEPARTMENT OF PRODUCTION SCIENCE AND
TECHNOLOGY,
GRADUATE SCHOOL OF ENGINEERING
GUNMA UNIVERSITY
CONTENTS
CHAPTER 1 GENERAL INTRODUCTION ... 1
1 Plasma classification... 1
1.1 Thermal equilibrium plasma and non-thermal equilibrium plasma ... 1
1.2 Atmospheric pressure non-thermal equilibrium plasma ... 2
2 Dielectric barrier discharges (DBDs) ... 2
2.1 Filamentary mode barrier discharges ... 3
2.2 Diffuse (glow) mode barrier discharges ... 4
3 Electrical and optical characterizations of atmospheric pressure cold plasmas ... 6
3.1 Electrical characterization of atmospheric pressure cold plasma ... 6
3.2 Optical characterization of atmospheric pressure cold plasma (OES) ... 8
4 Atmospheric pressure cold plasma jets and the applications ... 9
4.1 Glow to arc transition ... 9
4.2 RF discharges ... 11
4.3 Ejection mechanism of plasma jet ... 12
4.4 Applications of atmospheric pressure cold plasma jet ... 15
5 Objectives of this study ... 17
References ... 18
CHAPTER 2 ELECTRICAL AND OPTICAL CHARACTERIZATION OF RF CAPACITIVE ATMOSPHERIC PRESSURE COLD ARGON PLASMA JET ... 31
1 Introduction ... 31
2 Experimental setup and methods ... 31
2.1 Plasma device ... 31
2.2 Electrical measurement ... 32
2.3 Optical emission spectroscopy (OES) ... 32
3 Results and discussion ... 33
3.1 Electrical characterization of APC Ar plasma jet ... 33
3.1.1 Current and voltage (I – V) characteristics ... 33
3.1.2 Effect of Ar flow rate on electrical properties ... 33
3.1.3 Effect of torch diameter on electrical properties ... 34
3.1.4 Effect of additive gas (N2 or O2) on electrical properties ... 34
3.2 Optical characterization of APC Ar plasma jet ... 35
3.2.1 Typical optical emission spectrum ... 35
3.2.2 Effect of Ar flow rate on OES ... 37
3.2.3 Effect of torch diameter on OES ... 38
3.2.4 Effect of additive gas (N2 or O2) on OES ... 39
4 Conclusions ... 40
References ... 42
CHAPTER 3 ELECTRICAL AND OPTICAL CHARACTERIZATION OF SURFACE DISCHARGE NON-EQUILIBRIUM ATMOSPHERIC PRESSURE ARGON PLASMA JET ... 57
2 Experimental setup and methods ... 58
2.1 Plasma device ... 58
2.2 Electrical measurement ... 59
2.3 Optical emission spectroscopy (OES) ... 59
3 Results and discussion ... 59
3.1 Electrical characterization of CAPPLAT Ar plasma jet ... 59
3.1.1 Current and voltage (I – V) characteristics ... 59
3.1.2 Effect of Ar flow rate on electrical properties ... 61
3.1.3 Effect of dielectric thickness on electrical properties ... 62
3.1.4 Effect of torch diameter on electrical properties ... 62
3.1.5 Effect of additive gas (N2 or O2) on electrical properties ... 63
3.1.6 Effect of connection mode on electrical properties ... 64
3.2 Optical characterization of CAPPLAT Ar plasma jet ... 65
3.2.1 Typical optical emission spectrum ... 65
3.2.2 Effect of Ar flow rate on OES ... 67
3.2.3 Effect of dielectric thickness on OES ... 68
3.2.4 Effect of torch diameter on OES ... 68
3.2.5 Effect of additive gas (N2 or O2) on OES ... 68
3.2.6 Effect of connection mode on OES ... 71
4 Conclusions ... 71
References ... 74
CHAPTER 4 COMPARISON AND APPLICATION OF TWO TYPES OF ATMOSPHERIC PRESSURE COLD ARGON PLASMA JETS ... 100
1 Introduction ... 100
2 Experimental set up and methods ... 101
2.1 Plasma devices ... 101
2.2 Preparation of HDPE samples and conditions for plasma surface treatment ... 101
2.3 Electrical measurement ... 103
2.4 Measurement of optical emission spectra ... 103
2.5 Measurement of contact angle of water ... 103
2.6 Measurement of XPS ... 104
3 Results and discussion ... 104
3.1 Comparison of physical properties of APC and CAPPLAT plasma jets ... 104
3.1.1 Jet length ... 104
3.1.2 Jet temperature ... 105
3.1.3 Effect of additive gas (N2 or O2) on electrical properties ... 105
3.2 Comparison of chemical characteristics of APC and CAPPLAT plasma jets ... 107
3.2.1 Plasma chemical reactions in two Ar plasma jets ... 107
3.2.2 Effect of additive gas (N2 or O2) on plasma chemical reactions ... 109
3.3 Application of APC and CAPPLAT Ar plasma jets ... 110
3.3.1 HDPE surface treatment by two Ar plasma jets ... 110
3.3.2 Effect of additive gas (N2 or O2) on HDPE surface treatment ... 112
References ... 119
CHAPTER 5 SUMMARY ... 133
LIST OF PUBLICATIONS ... 137
Chapter 1 General Introduction
1 Plasma classification
1.1 Thermal equilibrium plasma and non-thermal equilibrium plasma
Plasma is a more or less ionized gas. It is considered the fourth state of matter beside solid, liquid and gas. In fact, most of the observable matter (more than 99%) in the universe is in the plasma state. From a macroscopic point of view, plasma is electrically neutral. However, plasma is electrically conductive and a lot of free charge carriers are contained in it [1].
Depending on the amounts of energy transferred to the plasma, the plasma properties change in terms of electron density and electron temperature. These two parameters distinguish plasmas into different categories (see Fig. 1-1) [2]. Generally, plasmas are divided into two categories: thermal equilibrium plasma (thermal plasma) and non-thermal equilibrium plasma (cold plasma). In thermal plasma, transitions and chemical reactions are controlled by collisions and not by radiative processes. Moreover, collision phenomena are micro-reversible in thermal plasma, suggesting that each kind of collision is balanced by its inverse (excitation/de-excitation; ionization/recombination; kinetic balance) [3]. Therefore, in thermal plasma the electron temperature is equal to the gas temperature (depending on the temperature of heavy particles).
Non-thermal equilibrium plasma (cold plasma) can be described by two temperatures: electron
temperature (Te) and heavy particle temperature (Th). Because of the huge mass difference between
electrons and heavy particles, the plasma temperature (or gas temperature) is determined by Th. On
the other hand, the electron-induced de-excitation rate of the atom is generally lower than the corresponding electron-induced excitation rate because of a significant radiative de-excitation rate. Therefore, the density distribution of excited atoms in cold plasma is possible to depart from
Boltzmann distribution, suggesting that the gas temperature is much lower than the electron temperature [4-7].
1.2 Atmospheric pressure non-thermal equilibrium plasma
Fig. 1-2 shows effect of gas pressure on electron temperature (Te) and gas temperature (Tg) [2].
It can clearly see that at a lower pressure (10-4 ~ 10-2 kPa) gas temperature is much lower than
electron temperature. The heavy particles are excited or ionized through inelastic collisions with electrons. These inelastic collisions do not raise the temperature of heavy particles. However, collisions in the plasma intensify when the gas pressure becomes higher. They lead to both plasma chemistry (by inelastic collisions) and heavy particles heating (by elastic collisions). Then, the
difference between Te and Tg decreases; plasma state is close to the thermal equilibrium state. How
to prevent heavy particles from being heated is crucial to generate non-thermal equilibrium plasma at atmospheric pressure. It was found that the density of the feeding power affects the plasma state (thermal equilibrium or not) at a large extent. Namely, a high power density lead to atmospheric pressure thermal equilibrium plasma (e.g. arc plasma); a low density of feeding power or a pulsed power supply lead to atmospheric pressure non-thermal equilibrium plasma.
2 Dielectric barrier discharges (DBDs)
Dielectric barrier discharges have been known for more than one century. First experimental investigation was reported by Siemens in 1857 [8]. They concentrated on the generation of ozone by using DBDs. Nowadays, DBDs are widely used to generate atmospheric pressure non-equilibrium plasmas in a controllable way.
Generally, planar and cylindrical electrode arrangements are used in DBDs. (see Fig.1-3) [9]. No matter what kind of electrode arrangement is employed, the presence of one or more dielectric
layers between the metallic electrodes across the discharge gap is essential for the discharge. First, the dielectric is able to limit the discharge current and can avoid occurrence of the arcing transition. Second, the dielectric distributes microdischarges (streamers) randomly on the electrode surface since the formation of microdischarges is due to the electron accumulation on the dielectric layer. Typical materials for dielectric barriers are glass, quartz and ceramics. Plastic foils, teflon plates, silicone tube and other insulating materials can be used as well [9].
2.1 Filamentary mode barrier discharges
DBDs have been studied by many researchers [10-17]. There are two different modes of DBDs (filamentary mode and diffuse mode). DBD is generally operated in the filamentary mode. If the local electric field strength in the gas spacing gap reaches the ignition level, the breakdown occurs at many points followed by the development of filaments, named microdischarges. A large number of
microdischarges were observed in most gases when the pressure is in the order of 105 Pa. The
development of microdischarges can be sub-divided into three steps [9, 18]:
(1) The pre-breakdown phase. A negative space charge of electrons (or negative ions due to attachment) is accumulated in front of the anode (according to the polarity of the half cycle of applied voltage). The pre-breakdown phase lasts for at least 0.5 ms. Then, a high local electric field strength is formed in front of the anode. If it reaches a certain critical level, the breakdown starts from the anode surface.
(2) The propagation phase. This phase is controlled by an ionization wave (i.e. a wave of high local electric field strength) in the direction to the cathode. Pairs of ions and electrons are produced on the way of the ionization wave. This phase typically takes 1 ~ 2 ns.
surface compensating the external electric field. Both the emission radiation and current pulses of the microdischarges decay in this phase.
The microdischarges are of nanosecond duration. They are uniformly distributed over the dielectric surface. In the next half cycle of the applied voltage, the formation of microdischarges renews inversely. The dielectric barrier limits the amount of the transferred charge and the energy deposited in a single microdischarge channel. Therefore, non-thermal equilibrium plasma is able to be generated at atmospheric pressure by DBD. Figure 1-4 shows the effect of the time constants on the relevant processes in the filamentary DBDs [9]. It can see that the development of microdischarge channels, which is characterized by the production of energetic electrons, takes place in the range of ns. However, the phase of plasma chemical reactions by atoms, radicals, excited species and short wave radiation typically starts within the minisecond scale. The production of active species is controlled by the properties of the microdischarges, namely by the reduced local electric field strength and electron density. The properties of the microdischarges in filamentary DBDs do not depend on the external driving circuit (e.g. the frequency, feeding voltage and waveform) over a wide range of operation conditions. They are mainly controlled by the feeding gas composition.
2.2 Diffuse (glow) mode barrier discharges
Under certain operating conditions, a diffuse (glow) mode of DBD can be obtained. In 1976, Donohoe investigated a uniform glow discharge with pulsed excitation in helium/ethylene mixtures [19]. In 1987, Okazaki and coworkers operated barrier glow discharges at 50 Hz sinusoidal feeding voltage, using an electrode configuration of two metal foils covered with a special metal mesh and ceramic dielectrics in helium, nitrogen and air etc. with and without certain organic additives [20-22].
They proposed the term “APGD” (atmospheric pressure glow discharge) for the first time. In 1992, Massines and co-workers investigated barrier glow discharges in helium and nitrogen in detail [23-25]. The generation of stable diffuse DBD at atmospheric pressure requires special operation conditions, which mainly depend on the properties of feeding gas. Comparing to the conditions of the filamentary mode DBD, effective pre-ionization, Penning ionization via metastables, and primary ionization in the low electric field are very important for the generation of diffuse mode DBD [9]. Additionally, the diffuse mode DBD is sensitive to impurities, admixtures, metastables and residual ions. The densities of residual species from the previous half period that can initiate the diffuse discharge in the next half cycle are dependent on the repetition frequency. Therefore, the feeding voltage frequency plays an important role in the transition to the diffuse mode. Some dielectric materials can trap considerable amounts of charges uniformly on the surface. When the electric field changes its polarity, the charge carriers are expelled from the surface and initiate a diffuse discharge [26]. The required operation conditions have been obtained in helium, neon and pure nitrogen gas.
Many efforts have been implemented to understand the formation mechanism of the diffuse DBD. So far, considerable progress was made to better understand the formation of diffuse DBD. The basic mechanisms of diffuse DBD are strongly affected by the properties of the feeding gas. This can be illustrated by the comparison of the DBD in helium and nitrogen. The dominant ionization and excitation mechanisms for both gases are quite different. In helium plasma, effective ionization and excitation processes occur in the electric field of the cathode region through direct
collisions of atoms with energetic electrons or through three body processes, generating He+ and
important, too [28]. On the contrary, in nitrogen plasma ions and electrons are probably generated through another mechanism. Kinetic models of diffuse DBD in the nitrogen plasma come to the conclusion that Penning ionization through two body collisions of metastable nitrogen molecules
producing N4+ ions and electrons are very important [29]. On the other hand, recent simulations
showed that surface electrons should also be considered in the current balance for efficient primary ionization processes at low electric field strength, these surface electrons are expelled and initiate a diffuse discharge when the electric field changes its polarity [30]. Nitrogen metastable molecules as
well as N2 (C3∏u) molecules are effectively generated by electron collisions. In the mixtures of
nitrogen and oxygen, the nitrogen metastable molecules are quenched considerably by molecular oxygen, which results in a significant decreased in the densities of nitrogen metastables. Therefore, in nitrogen gas with an addition of trace of oxygen gas, the direct ionization of nitrogen molecules (E ≈ 18.7 eV) in the ground state by energetic electrons is dominant [31]. This process requires electrons with energy at least of 18.7 eV (i.e. much higher local field strength is needed). Therefore, when most of nitrogen metastables are quenched, there is no other way for the discharge
development. It well explains that diffuse mode transits to filamentary mode when trace of O2 gas is
added into the nitrogen plasma [31].
3 Electrical and optical characterizations of atmospheric pressure cold
plasmas
3.1 Electrical characterization of atmospheric pressure cold plasma
As discussed above, dielectric barrier discharges (DBDs) are widely used to produce non-equilibrium plasmas at atmospheric pressure. In order to understand the nature of DBDs, the important discharge parameters (such as discharge voltage, discharge current, transferred charge,
dissipated electric power etc.) must be characterized. Generally, the impedance of the entire load and not just of the discharge was measured electrically. To characterize the overall discharge behavior, an equivalent electric circuit can be used. An example of such a circuit is shown in Fig. 1-5 [9]. In
this case, one side dielectric barrier discharge is employed. As long as the gap voltage (Ug) is smaller
than the ignition voltage (breakdown voltage), there is no discharge and the plasma device acts as a
series combination of two capacitances: the gap capacitance (Cg) and the capacitance (Cd)
representing the dielectric. Then the total capacitance C is given by the expression:
( )
1
1
d g g g d g g d rC C
C
C
C =
=
=
C +C
+C C
+ d
ε
g
(1-1)Typically g ≈ d, the term Cg / Cd = d / (εrg) ≈ Ud / Ug «1 (Ud represents the voltage across
dielectric barrier). Therefore, the total capacitance (C) mainly depends on the capacitance of the gas
gap (Cg). The gap voltage (Ug) is close to the feeding voltage. If Ug reaches the ignition voltage,
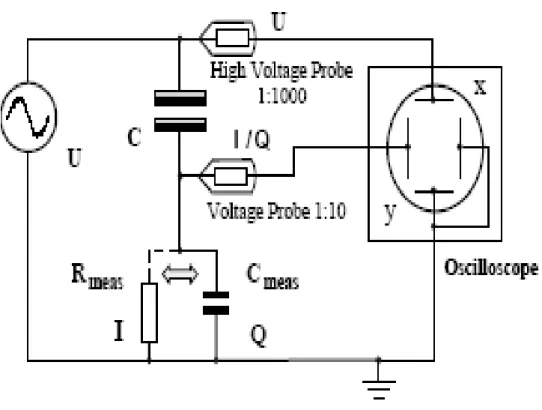
microdischarges are initiated. Within every half cycle, the discharge voltage remains approximately constant, although the current flow through discharge gap is maintained by a large number of microdischarges. Figure 1-6 shows a general setup for electrical measurement of DBD [9]. Capacitance C represents the DBD fed by an applied voltage. The current pulse shape and the
charge-voltage characteristic can be recorded alternatively using either a resistance Rmeas (Rmeas ≈ 50
Ω) or a capacitance Cmeas (Cmeas ≈ 10 nF) by using an oscilloscope. The applied high voltage is
measured by a high-voltage probe. Using this measurement set up, the important electric operation parameters of DBDs, such as discharge voltage and discharge current can be measured. The
discharge voltage (UD) can be calculated by the following expression [9]. It is close to the measured
mea
1
1
D g dU
U
C C
=
+
(1-2)The dissipated electric energy consumed per voltage cycle (Eel) can be measured by the Lissajous
figure (see Fig.1-7) [9, 32].
min max min
1
( )
( )
4
(
)
1
el meas meas d g dE
U t dQ C
U t dU
C
U
U
U
C C
=
=
−
+
=
∫
∫
(1-3)Obviously, the dissipated electric energy consumed per voltage cycle (Eel) is equal to the area of
Q-U diagram shown in Fig. 1-7. Then, the dissipated electric power (consumed electric energy) can be estimated by the following expression:
1
P
E
elfE
elT
=
=
(1-4)The number of microdischarge series per half cycle (NT/2) can be derived under the assumption
that all series transfer an identical charge ΔQ by the following expression.
(
)
2 m ax m in2
T dC
N
U
U
Q
≈
−
Δ
(1-5)Assuming that all microdischarges of one series (causing one single current pulse) have nearly identical properties, then ΔQ ≈ nq, where n is the number of microdischarges in a series and q is the charge transferred by one single microdischarge. The quantity of charge transfer is mainly determined by the categories of dielectric and the width of gap spacing [9].
3.2 Optical characterization of atmospheric pressure cold plasma (OES)
As we discussed above, heavy particles (gas molecules) are excited and ionized through the collisions with energetic electrons. However, the electron-induced de-excitation rate of the excited molecules, atoms or ions is generally lower than the corresponding electron-induced excitation rate in the non-equilibrium plasma. Therefore, the active species (excited molecules, atoms, and ions) in
plasma emits light through a significant radiative de-excitation. Optical emission spectroscopy (OES) is well known as a non-invasive and non-disturbing technique for plasma diagnostics [33-37]. In the OES measurement, light emitted from active species in the plasma is collected through a spectrometer. Using OES, active species in the plasma can be identified. We can explore the mechanism of plasma chemical reactions by monitoring the emission intensities of active species. Assuming that the plasma is local thermodynamic equilibrium, the gas temperature is equal to the rotational temperature of a certain active species. Therefore, OES can also be used to evaluate the gas temperature from the optical emission spectral profile shape of a certain molecular active species
(e.g. N2 or NO) [38-39]. Generally, a special OES simulation program is used to analyze the
radiating species and thermodynamic characteristics of the plasma. Using this professional software, rotational and vibrational temperatures of excited molecules are obtained from the emission spectra by matching the experimental results with the simulation results. Recently, several research groups [40–43] focused on spatially and temporally resolved spectroscopic measurements. The measurement of temporally and spatially resolved spectra is the basis for the derivation of the electric field strength distribution. Nowadays, this technique is becoming the most promising tools for better understanding of physical and chemical processes in plasma.
4 Atmospheric pressure cold plasma jets and the applications
4.1 Glow to arc transition
Currently, a variety of atmospheric pressure cold plasma jets have been developed such as atmospheric pressure plasma jet (APPJ), cold plasma torch, one atmosphere uniform glow discharge plasma and micro-plasma etc. [44-49]. However, we have to confront some problems during the development of atmospheric pressure cold plasma jet. As we discussed above, atmospheric pressure
non-thermal equilibrium plasma only can be generated by either a low density of feeding power or a pulsed power supply. Therefore, if we simply increase the gas pressure in a low pressure glow discharge, the glow discharge will transit to arcing since atmospheric pressure glow discharges face a variety of instabilities [45, 46]. In order to understand the reason for this transition, we have to retrospect some important properties of glow discharge. At a given pressure, the current density and the discharge voltage in a normal glow discharge are constant. The total discharge current increases with the increasing coverage of the electrode. When the electrode is fully covered with the glow, a further increase in the current will cause an increase in the current density, which followed by an increase in the discharge voltage. The discharge with such characteristics is called an abnormal glow discharge. Hence, the minimum current density to sustain a glow discharge is the current density of a normal glow discharge [50]. For a given total current, the current density of the normal glow discharge is proportional with the square of the gas pressure. For example, an increase in the gas pressure from 1 Pa to atmospheric pressure would increase the normal current density by a factor of
1010. In case of steel electrodes, the normal current density would grow up to almost 100 A/cm2 in
argon discharge [45]. These numbers give us an impression of the power density dissipated in the sheath of a normal glow discharge at atmospheric pressure, especially for argon atmospheric pressure cold plasma jet. Thus, we have to restrict the total current below this critical value, which avoids the glow-to-arc transition. Therefore, generally atmospheric pressure glow discharges only can be sustained with a small discharge scope, which is not efficient for the material processing. In order to develop atmospheric pressure cold plasma with wider discharge area, some measures must be taken, such as the forced cooling of electrodes, using helium as working gas since its normal current density is much lower than other gases [50]. Furthermore, we can restrict the discharge time
to a value below the time constant for glow-to-arc transition. This can be achieved by using a pulsed discharge or dielectric barrier discharge. Additionally, using high gas velocities is effective to reduce the residence time of the working gas in the discharge region [50].
4.2 RF discharges
Generally, uniform atmospheric pressure plasma jets can be generated by dielectric barrier discharges (DBDs) or RF discharges. We have discussed the DBDs above in details. In DBDs, dielectric materials are used to cover one or both electrodes; high voltage in the frequency range of several kHz is employed to ignite the discharge. Charge accumulation on the dielectric layer, which covers the electrodes, causes a drop of the voltage across the plasma. Therefore, DBDs are self-pulsed discharges that can restrict the discharge current and avoid arcing [50]. Radio frequency (RF) discharges have also been used to generate atmospheric pressure cold plasma jet with devices that are similar to DBDs or with devices where the electrodes are bare metal [51-53]. With bare metal electrodes, glow-to-arc transition occurs easily; therefore, the electrodes have to be cooled and the gas flow rate has to be adjusted to a certain level to minimize the risk of glow-to-arc transition. RF driven plasma devices require impedance matching between the power source and the plasma to optimize the dissipated power in the plasma and minimize the reflected power. Many studies were performed on the focus of the RF discharges [54-75]. It was found that two kinds of RF discharge modes were observed in atmospheric pressure cold plasma jets, the α-mode and the γ-mode [62]. In the α-mode, the discharge is sustained by the bulk ionization. The electrons oscillate with the drifting amplitude and are trapped in the bulk plasma region [50]. Then, the α-sheath forms since the electrodes serve as a tank for electrons. For helium atmospheric pressure plasma, the thickness of the α-sheath is in the order of 0.25 mm [50]. In the γ-mode, the discharge is sustained by secondary
electron emission from the electrode surface. The sheath thickness in the γ-mode is at least one order of magnitude smaller than that of the α-mode. Figure 1-8 shows the comparison of emission intensity profiles between electrodes for the α-mode and the γ-mode RF discharge in helium gas [50].
According to Raizer [77], when the product of gas spacing and gas pressure exceeds a critical value, the α-mode discharge becomes unstable and the α-mode discharge transits into the γ-mode or a coexisting α and γ mode discharge. Depending on the plasma device and the operating conditions, an upper discharge current or discharge power limit exists for the α-mode discharge, where the breakdown of the α-sheath occurs. The decrease in sheath thickness is followed by a decrease in the discharge voltage. When the voltage needed to sustain the γ-mode discharge is much lower than the voltage needed to sustain the α-mode discharge, only a pure γ-mode will be observed [51, 54, 63, 74]. However, when the γ-mode discharge voltage is comparable to the α-mode discharge voltage, then a coexisting α-mode and γ-mode discharge will be observed [51, 54].
4.3 Ejection mechanism of plasma jet
By DBDs or RF discharges, the issue of glow-to-arc transition has been overcome; and a variety of plasma devices have been developed to generate non-equilibrium plasma jets at atmospheric pressure. However, until now there have not been many studies to investigate the physical processes, which can explain the ejecting behavior of plasma jet. Intuitively, the jet is blown out the plasma device by flowing gas at flow rate of several liters per minute [49]. Generally, the jet is initiated and maintained in an atmospheric pressure environment. In most cases, the environment is the surrounding atmosphere. Theoretically, we should understand how the jet is ejected and maintained in the atmosphere where the electric field is very weak or even non-existent.
It was found that the traveling velocity of plasma jet is several orders of magnitude faster than the gas flow velocity [78]. Therefore, photo-induced ionization should be considered in the formation of plasma jet. Lu and Laroussi [78] proposed a photo-ionization-based model to explain how the jet is formed by their plasma device (a device driven by nanosecond pulsed high voltage). This model maybe is applicable to other plasma jets. In their model, they assumed that at a given instant time the
cathode-directed streamer head is a sphere with radius r0 and n+ space charge. As the streamer head
moves forward, it leaves behind a quasi-neutral ionized channel with a very low conductivity [49]. The head is not connected to the anode and only the streamer head is measurably luminous. This assumption is consistent with their experimental investigation [78]. Assume that a single
photoelectron is created at a suitable distance r1 from the center of the sphere because of photon
emission from the streamer. With the influence of the electric field formed by the space charge, the electron is accelerated towards the sphere and an avalanche is initiated. In moving toward the sphere,
from r1 up to a certain point r2, the electron forms an avalanche multiplication (n) and diffusion
radius (r0). The multiplication n and radius r0 are expressed as follows [49]:
1 2
exp
dr
r rn
=
∫
α
, (1-6) 1 2 01
2
6
r d rD
r
dr
v
⎛
⎞
= ⎜
⎟
⎝
∫
⎠
, (1-7)where α is Townsend’s first ionization coefficient, D is the diffusion coefficient, and vd is the
electron drift velocity. If the multiplication up to the sphere is sufficient, the electrons neutralize the
angle. The absorption coefficients and ionizing efficiency should also be considered. Since the
complete data on these quantities is not available, r1 is taken as the distance at which the ionization
and attachment rates are equal, where the reduced electric field is 30 V /cm-1.mmHg-1 (in air) [79].
According to Dawson and Winn [79], the following three requirements must be fulfilled for the streamer propagation under low or zero electric field. (1) The number of new positive ions created
by the avalanche must be equal to the number of ions in the original sphere (n+); (2) The diffusion
radius of the avalanche head must be smaller than r0; (3) the avalanche must reach the required
amplification before the two charge regions begin to overlap, (i.e., 2r0 ≤ r2). Next, r2 and r0 are
calculated as follows. First, a value of n+ is given. Second, the electric field as a function of r from
simple electrostatics is calculated from the following expression [49]:
2 0
Q
E =
4
πε
r
(1-8)As described above, the distance r1 is determined as the distance at which the reduced electric
field strength is equal to 30 V /cm-1.mmHg-1. r
2 is then calculated from Equation (1-6) when n is
equal to n+. The Townsend’s first ionization coefficient α is calculated from the following expression
[49, 80]:
1
15 exp( 365
p
p E
)
cmα
=
⋅
−
− (1-9)where p is the gas pressure and air is assumed to be the ambient gas. Finally, r0 is calculated by
using Equation (1-7) above, where D and vd are determined from the following expressions,
respectively [49, 80]: 5 2 1
2 10
[
]
D
cm s
p torr
−×
=
⋅
(1-10) 6 2 1 10.86 10
[
]
d
p torr
cm
V
s
v
×
− −=
⋅
⋅
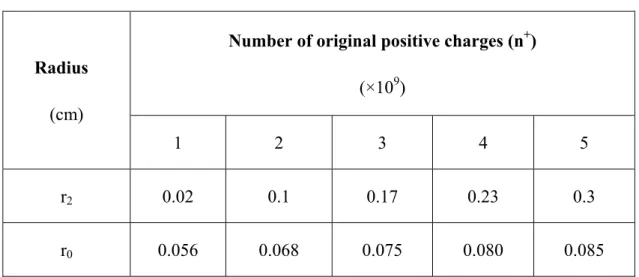
(1-11)Table 1-1 shows the calculated r2 and r0 from different charge numbers (n+) [78]. In these
calculations, the values of D and vd were determined for the case of helium plasma. According to the
model described above, only when 2r0 is smaller than r2 the streamer self-propagation can occur.
From Tab. 1-1, it can be seen that when n+ is less than 2 × 10⁹, 2r0 is larger than r2; suggesting that
the streamer head can’t self propagate under low or zero external electric field in this case. However,
when n+ is larger than 3 × 10⁹, 2r
0 is smaller than r2; indicating that the streamer head can
self-propagate. This is well in agreement with the experimental observations [78]. Using this model, it can explain why the traveling velocity of plasma jet is several orders of magnitude faster than the gas flow velocity. Therefore, the jet can travel up to several centimeters without the presence of an external electric field [49].
4.4 Applications of atmospheric pressure cold plasma jet
As pointed out in a previous section, non-thermal equilibrium plasmas are capable of producing charged particles, neutral metastable species, radicals and (V)UV radiation, which can be used for a variety of applications. Recently, there has been increased attention in using atmospheric pressure cold plasmas for material processing, since these plasmas do not require expensive vacuum systems. In particular, non-thermal atmospheric pressure plasma jets are playing an increasingly important role in various plasma processing applications [49]. This is because the plasma jet is not spatially bound or confined by electrodes. This capability is very desirable in many applications such as the treatment for complex shaped samples. On the other hand, comparing to other atmospheric pressure cold plasmas, APPJ (atmospheric pressure plasma jet) units are rather small, they are mobile and very easy to handle. Laroussi gave an overview of plasma sterilization by APGDs (atmospheric pressure glow discharges) [81]. It has been proven that APGDs can be effectively used to inactivate
bacteria. In respect to the sterilization by APGDs, the APPJ has a similar effect to other atmospheric pressure non-equilibrium plasmas. Therefore, disinfection and sterilization of medical instruments and implants are also possible. Using APPJ to treat the wounds and skin was reported by [82]. The inactivation of the biofilm-forming bacteria also opens an area of food treatment by APPJ. On the other hand, the APPJ can be used to enhance the hydrophilicity of polymer surface. APPJ can also be used for the cleaning of metal surface by using oxygen highly diluted in helium or argon gas [49]. The oxygen active species are capable to remove many organic materials on the metal surface with the release of water and carbon dioxide. Additionally, APPJ etching is widely used. It was reported that both Kapton and polyimide have been successfully etched by APPJ [83, 84]. The etching of
oxides and metals has been demonstrated as well [85, 86, 87]. Carbon tetrafluoride (CF4) as a
reactive gas was added to helium or argon gas in the case of APPJ etching. APPJs were also used for PECVD (plasma-enhanced chemical vapor deposition). Moravej and Hicks made an excellent review about PECVD using APPJ [88]. It was reported that glass-like thin functional films have been successfully deposited by APPJ with oxygen highly diluted in helium or argon gas. The silicon containing precursor was diluted in main gas (He or Ar) and admixed downstream of the APPJ system. A large number of silicon containing precursors, such as tetraethoxysilane (TEOS), hexamethyldisilizane (HMDSN), hexamethyldisiloxane (HMDSO), tetramethyldisiloxane (TMDSO) and tetramethylcycotetrasiloxane (TMCTS) have been investigated [89-91]. Effects of precursors and reactive gas on the deposition rate and the properties of the deposited films were also widely
studied [92]. Furthermore, the deposition of silicon nitride (Si3N4) was reported as well [93]. In this
case, nitrogen gas as a reactive gas was highly diluted in helium, and SiH4 was also added into the
agents has also been proven [94, 95]. In most cases, the exhaust gas from APPJ system is harmless and can exhaust to the atmosphere without further processing. As an environmental friendly technology, it is expected that APPJ will be more widely used in the future.
5 Objectives of this study
As mentioned above, atmospheric pressure cold plasma jets can be generated by DBDs or RF discharges. So far, though a variety of atmospheric pressure cold plasma jets have been developed, the discharge mechanisms are not clearly understood yet. On the other hand, in order to decrease the cost of plasma processing, argon gas is highly desirable to replace helium gas as the working gas since argon gas is much less expensive. A capacitive coupled RF plasma device was developed by Cresur Corporation of Japan. This plasma device has been commercialized under the name of “APC”. Using APC, a cold Ar plasma jet is able to be generated at atmospheric pressure. On the other hand, we have successfully developed a plasma device that is able to generate a non-equilibrium atmospheric pressure Ar plasma jet of low temperature (22 to 35°C) using surface discharge fed by a high-voltage pulsed power source. This device has been commercialized under the name of “CAPPLAT” by Cresur Corporation of Japan. Though a variety of applications are being implemented, the electrical and the optical properties of these two atmospheric pressure cold Ar plasma jets had never been studied systematically. Therefore, to realize a wider applied field, it is highly desirable to get better understanding for the electrical and the optical properties of these two atmospheric pressure cold Ar plasma jets.
In chapter 2, the electrical and optical characterizations of APC Ar plasma jet are performed. Based on the electrical characterization, the discharge behavior of APC Ar plasma jet is verified and discussed. Active species in APC Ar plasma jet are also identified by using optical emission
spectroscopy (OES). According to the OES, the mechanism of chemical reactions in APC Ar plasma
jet is proposed. In particular, effects of an additive gas (N2 or O2) on the electrical and optical
properties of APC Ar plasma jet are investigated in detail.
In chapter 3, the electrical and optical characteristics of CAPPLAT Ar plasma jet are investigated. The aim is to characterize the discharge behavior and to explore the discharge mechanism of this Ar plasma jet by using a high-voltage probe and a current monitor. On the other hand, the active species in this Ar plasma jet are identified by using optical emission spectroscopy (OES). According to the OES, the mechanism of plasma chemical reactions in CAPPLAT Ar plasma
jet is proposed. In particular, effects of an additive gas (N2 or O2) on the electrical and optical
properties of CAPPLAT Ar plasma jet are investigated in detail.
In chapter 4, the physical and chemical properties (such as jet length, jet temperature, discharge behavior and the mechanism of plasma chemical reactions) of CAPPLAT Ar plasma jet and APC Ar
plasma jet are compared. In particular, effects of an additive gas (N2 or O2) on the physical and
chemical properties of these two Ar plasma jets are compared and discussed in detail. To demonstrate an application of these two Ar plasma jets, high-density polyethylene (HDPE) surface is
treated using the two Ar plasma jets, respectively. In particular, effects of an additive gas (N2 or O2)
on HDPE surface treatment are investigated and compared in detail. According to the experimental results, a probable process of HDPE surface treatment by the two Ar plasma jets is proposed.
References
[1]C. Tendero, C. Tixier, P. Tristant, Spectrochimica Acta Part B, 2006, 61, 2.
[2] M. I. Boulos, P. Fauchais, E. Pfender, Thermal Plasmas: Fundamental and Applications. Volume I, Plenum Press, New York, ISBN: 0-306-44607-3, 1994, 452.
[3] M. Moisan, M. D. Calzada, A. Gamero, A. Sola, J. Appl. Phys. 1996, 80, 46.
[4] R. H. Huddlestone, S. L. Leonard, Plasma Diagnostic Techniques, Academic Press, New York, 1965.
[5] H. R. Griem, Plasma Spectroscopy, McGraw-Hill, New York, 1964.
[6] W. Lochte-Holtgreven, Plasma Diagnostics, North-Holland, Amsterdam, 1968. [7] M. Mitchner, C. H. Kruger, Partially Ionized Gases, Wiley, New York, 1973. [8] U. Kogelschatz, Plasma Chem. Plasma Process. 2003, 23, 1.
[9] H-E. Wagner, R. Brandenburg, K. V. Kozlov, A. Sonnenfeld, P. Michel, J. F. Behnke, Vacuum 2003, 71, 417.
[10] B. Eliasson, U. Kogelschatz. IEEE Trans. Plasma Sci. 1991, 19, 309. [11] V. I. Gibalov, G. J. Pietsch. J. Phys. D: Appl. Phys. 2000, 33, 2618. [12] G. J. Pietsch, Contrib. Plasma Phys. 2001, 41, 620.
[13] B. Eliasson, M. Hirth, U. Kogelschatz, J. Phys. D: Appl. Phys. 1987, 20, 1421. [14] D. Braun, U. Kuchler, G. J. Pietsch, J. Phys. D: Appl. Phys. 1991, 24, 564. [15] D. Braun, V. Gibalov, G. Pietsch, Plasma Sources Sci. Technol. 1992, 1, 166.
[16] V. I. Gibalov, V. G. Samoilovich, Y. V. Filippov, Russ. J. Phys. Chem. 1981, 55, 471. [17] K. Yoshida, H. Tagashira. Memoirs Kitami Inst. Technol. 1986, 18, 11.
[18] K. V. Kozlov, H-E. Wagner, R. Brandenburg, P. Michel, J. Phys. D: Appl. Phys. 2001, 34, 3164.
[19] K. G. Donohoe, PhD thesis, California Institute of Technology, Pasadena, CA, 1976.
[20] S. Kanazawa, M. Kogoma, T. Moriwaki, S. Okazaki, International Symposium on Plasma Chemistry, Tokyo (Japan), 1987, 1844.
[21] S. Kanazawa, M. Kogoma, T. Moriwaki, S. Okazaki, J. Phys. D: Appl. Phys. 1988, 21, 838. [22] S. Okazaki, M. Kogoma, M. Uehara, Y. Kimura, J. Phys. D: Appl. Phys. 1993, 26, 889. [23] F. Massines, C. Mayoux, R. Messaoudi, A. Rabehi, P. Segur. International Conference on Gas Discharges and Their Applications, Swansea (UK), 1992, 730.
[24] F. Massines, A. Rabehi, P. Decomps, R. B. Gadri, P. Segur, C. Mayoux, J. Appl. Phys. 1998, 83, 2950.
[25] N. Gherardi, G. Gouda, A. Ricard, F. Massines, Plasma Sources Sci. Technol. 2000, 9, 340. [26] J. Tepper, M. Lindmayer, J. Salge, Proceedings of the Sixth International Symposium on High Pressure Low Temperature Plasma Chemistry, HAKONE VI, Cork (Ireland), 1998, 123.
[27] A. Ricard, P. Decomps, F. Massines. Surf. Coatings 1999, 112, 1.
[28] Y. B. Golubovski, A. Maiorov, J. Behnke, J. F. Behnke, Proceedings of the Eighth International Symposium on High Pressure, Low Temperature Plasma Chemistry, HAKONE VIII, Puhajarve (Estonia), 2002, 48.
[29] P. Segur, F. Massines, Proceedings of the International Conference on Gas Discharges and Their Applications, Glasgow (UK), 2000, 15.
[30] Y. B. Golubovskii, V. A. Maiorov, J. Behnke, J. F. Behnke, J. Phys. D: Appl. Phys. 2002, 35, 751.
[31] H-E. Wagner, R. Brandenburg, P. Michel, F. Massines, K. V. Kozlov, Proceedings of the seventh International Symposium on High Pressure Low Temperature Plasma Chemistry, HAKONE VII, Greifswald (Germany), 2000, 93.
[32] U. Kogelschatz, Process Technologies for Water Treatment, New York: Plenum press, 1988, 87.
[33] A. Ricard, T. Czerwiec, Thin Solid Films 1999, 341, 1. [34] A. Fateev, F. Leipold, Plasma Process. Polym. 2005, 2, 193.
[35] A. Simon, S. D. Anghel, Nucl. Instr. Methods in Phys. Res. B 2009, 267, 438. [36] J. R. Roberts, J. Res. Natl. Inst. Stand. Technol. 1995, 100, 353.
[37] P. Jamroz, W. Zyrnicki, Vacuum 2010, 84, 940.
[38] J. K. Rhee, D. B. Kim, Thin Solid Films 2007, 515, 4909.
[39] Y. Kubota, R. Ichiki, T. Hara, J. Plasma Fusion Res. Series 2009, 8, 740.
[40] C. Hudon, R. Bartnikas, M. R. Wertheimer, IEEE Trans. Electr. Insul. 1993, 28, 1.
[41] R. Brandenburg, K.V. Kozlov, N. Gherardi, P. Michel, C. Khampan, H-E. Wagner, F. Massines, Proceedings of the Eighth International Symposium on High Pressure, Low Temperature Plasma Chemistry, HAKONE VIII, Puhajarve (Estonia), 2002, 28.
[42] D. Trunec, R. Brandenburg, P. Michel, D. Pasedag, H-E. Wagner, Z. Navratil, Proceedings of the International Symposium on High Pressure, Low Temperature Plasma Chemistry, HAKONE VIII, Puhajarve (Estonia), 2002, 63.
[43] V. Poenariu, M. R. Wertheimer, R. Bartnikas, Plasma Process. Polym. 2006, 3, 17.
[44] J. R. Roth, ‘‘Industrial Plasma Engineering: Applications to Non-thermal Plasma Processing’’, Vol. 2, IOP Publishing, Bristol 2001.
[45] Y. P. Raizer, ‘‘Gas Discharge Physics’’, Springer, Heidelberg 1991. [46] E. E. Kunhardt, IEEE Trans. Plasma Sci. 2000, 28, 189.
[47] A. Schutze, J. Y. Jeong, S. E. Babayan, J. Park, G. S. Selwyn, R. F. Hicks, IEEE Trans. Plasma Sci. 1998, 26, 1685.
[49] M. Laroussi, T. Akan, Plasma Process. Polym. 2007, 4, 777. [50] J. Laimer, H. Stǒri Plasma Process. Polym. 2007, 4, 266. [51] J. Laimer, H. Stǒri Plasma Process. Polym. 2006, 3, 573. [52] J. J. Shi, M. G. Kong, IEEE. Trans. Plasma Sci. 2005, 33, 624.
[53] J. Park, I. Henins, H. W. Herrmann, G. S. Selwyn, J. Appl. Phys. 2001, 89, 20. [54] J. Laimer, S. Haslinger, W. Meissl, J. Hell, H. Stori, Vacuum 2005, 79, 209. [55 J. J. Shi, M. G. Kong, Phys. Rev. Lett. 2006, 96, 105009.
[56] S. Wang, V. Schultz von der Gathen, H. F. Dobele, Appl. Phys. Lett. 2003, 83, 3272. [57] G. S. Selwyn, H. W. Herrmann, J. Park, I. Henins, Contrib. Plasma Phys. 2001, 6, 610.
[58] J. Park, I. Henins, H. W. Herrmann, G. S. Selwyn, J. Y. Jeong, R. F. Hicks, D. Shim, C. S. Chang, Appl. Phys. Lett. 2000, 76, 288.
[59] J. Park, I. Henins, H. W. Herrmann, G. S. Selwyn, J. Appl. Phys. 2001, 89, 15.
[60] M. Moravej, X. Yang, G. R. Nowling, J. P. Chang, R. F. Hicks, J. Appl. Phys. 2004, 96, 7011. [61] X. Yang, M. Moravej, G. R. Nowling, J. P. Chang, R. F. Hicks, IEEE Trans. Plasma Sci. 2005, 33, 294.
[62] J. J. Shi, X. T. Deng, R. Hall, J. D. Punnett, M. G. Kong, J. Appl. Phys. 2003, 94, 6303.
[63] X. Yang, M. Moravej, G. R. Nowling, S. E. Babayan, J. Panelon, J. P. Chang, R. F. Hicks, Plasma Sources Sci. Technol. 2005, 14, 314.
[64] X. Yang, M. Moravej, S. E. Babayan, G. R. Nowling, R. F. Hicks, Plasma Sources Sci. Technol. 2005, 14, 412.
[65] S. E. Babayan, G. Ding, G. R. Nowling, X. Yang, R. F. Hicks, Plasma Chem. Plasma Process. 2002, 22, 255.
[66] M. Moravej, X. Yang, M. Barankin, J. Penelon, S. E. Babayan, R. F. Hicks, Plasma Sources Sci. Technol. 2006, 15, 204.
[67] K. Niemi, V. Schulz von der Gathen, H. F. Dobele, Plasma Sources Sci. Technol 2005, 14, 375. [68] J. Park, I. Henins, H. W. Herrmann, G. S. Selwyn, Phys. Plasmas 2000, 7, 3141.
[69] X. Yuan, L. L. Raja, Appl. Phys. Lett. 2002, 81, 814. [70] X. Yuan, L. L. Raja, IEEE Trans. Plasma Sci. 2003, 31, 495. [71] J. J. Shi, M. G. Kong, IEEE Trans. Plasma Sci. 2005, 33, 278. [72] J. J. Shi, M. G. Kong, Appl. Phys. Lett. 2005, 87, 201501.
[73] J. Y. Jeong, J. Park, I. Henins, S. E. Babayan, V. J. Tu, G. S. Selwyn, G. Ding, R. F. Hicks, J. Phys. Chem. A 2000, 104, 8027.
[74] S. Y. Moon, R. K. Rhee, D. B. Kim, W. Choe, Phys. Plasmas 2006, 13, 033502. [75] T. Kimura, T. Hanai, Jpn. J. Appl. Phys. 2006, 45, 4219.
[76] W-C. Zhu, B-R. Wang, Z-X. Yao, Y-K. Pu, J. Phys. D: Appl. Phys. 2005, 38, 1396.
[77] Y. P. Raizer, M. N. Shneider, N. A. Yatsenko, ‘‘Radio-Frequency Capacitive discharge’’, CRC, Boca Raton 1995.
[78] X. Lu, M. Laroussi, J. Appl. Phys. 2006, 100, 063302.
[79] G. A. Dawson,W. P. Winn, Zeitschrift fur Physik 1965, 183, 159. [80] R. P. Yuri, ‘‘Gas Discharge Physics’’, Springer, New York 1991. [81] M. Laroussi, Plasma Process. Polym. 2005, 2, 391.
[82] M. Vleugels, G. Shama, X. T. Deng, E. Greenacre, T. Brocklehurst, M. G. Kong, IEEE Trans Plasma Sci. 2005, 33, 824.
Technol. 1998, 7, 282.
[84] J. Y. Jeong, S. E. Babayan, A. Schu¨tze, V. J. Tu, J. Park, I. Henins, G. S. Selwyn, R. F. Hicks, J. Vacuum. Sci. Technol A 1999, 17, 2581.
[85] V. J. Tu, J. Y. Jeong, A. Schutze, S. E. Babayan, G. Ding, G. S. Selwyn, R. F. Hicks, J. Vacuum Sci. Technol. A 2000, 18, 2799.
[86] X. Yang, M. Moravej, S. E. Babayan, G. R. Nowling, H. R. Hicks, J. Nucl. Mater. 2004, 324, 134.
[87] Y. Kim, J. Park, L. A. Rosocha, H. L. Teslow, Appl. Phys. Lett. 2005, 87, 011502. [88] M. Moravej, R. F. Hicks, Chem. Vap. Depos. 2005, 11, 469.
[89] S. E. Babayan, J. Y. Jeong, V. J. Tu, J. Park, G. S. Selwyn, R. F. Hicks, Plasma Sources Sci. Technol. 1998, 7, 286.
[90] G. R. Nowling, M. Yajima, S. E. Babayan, M. Moravej, X. Yang, W. Hoffman, R. F. Hicks, Plasma Sources Sci. Technol. 2005, 14, 477.
[91] S. E. Babayan, J. Y. Jeong, A. Schu¨tze, V. J. Tu, M. Moravej, G. S. Selwyn, R. F. Hicks, Plasma Sources Sci. Technol. 2001, 10, 573.
[92] M. Moravej, S. E. Babayan, G. R. Nowling, X. Yang, R. F. Hicks, Plasma Sources Sci. Technol. 2004, 13, 8.
[93] G. R. Nowling, S. E. Babayan, V. Jankovic, R. F. Hicks, Plasma Sources Sci. Technol. 2002, 11, 97.
[94] H. W. Herrmann, I. Henins, J. Park, G. S. Selwyn, Phys. Plasmas 1999, 6, 2284.
[95] H. W. Herrmann, G. S. Selwyn, I. Henins, J. Park, M. Jeffery, J. M. Williams, IEEE Trans. Plasma Sci. 2002, 30, 1460.
Fig. 1-1 Schematic of plasma classification (electron temperature versus electron density). Taken from reference [2].
Fig. 1-2 Dependence of electron temperature and gas temperature on gas pressure in a mercury arc plasma. Taken from reference [2].
Fig. 1-3 Typical electrode arrangements of dielectric barrier discharges. Taken from reference [9].
Fig. 1-5 Equivalent circuit used for DBD. Taken from reference [9].
Fig. 1-6 Experimental setup for discharge voltage, discharge current and charge transfer measurements alternatively. Using Rmeas for current measurement (broken line); using Cmeas for
Fig. 1-7 Idealized Q-U diagram (Lissajous figure) for measurement of dissipated electric energy per voltage cycle. Taken from reference [9].
(a)
(b) Fig. 1-8 Emission intensity profiles between electrodes in RF helium discharge with a gap spacing of 2 mm. (a): α-mode discharge; (b): γ-mode discharge. Taken from reference [50].
Tab. 1-1 Calculated radius (r0 and r2) for different original space charge numbers. Taken from
reference [49].
Radius
(cm)
Number of original positive charges (n
+)
(×10
9)
1 2 3 4 5
r
20.02
0.1
0.17
0.23
0.3
Chapter 2 Electrical and Optical Characterization of RF Capacitive
Atmospheric Pressure Cold Argon Plasma Jet
1 Introduction
Recently, several novel atmospheric pressure plasma sources have been developed. These sources show a promising potential to replace low pressure plasma devices for some existing applications and to create new applications. These sources include the atmospheric pressure plasma jet, the cold plasma torch and the one atmosphere uniform glow discharge plasma. All these plasma sources produce discharges with a low gas temperature [1-10].
In this study, electrical properties of a RF capacitive cold Ar plasma jet were characterized using a high-voltage probe and a current probe. According to the waveforms of discharge voltage and RF current, the discharge behavior was confirmed. Further, optical emission spectrometry (OES) was employed to identify the active species in this Ar plasma jet. Based on the electrical and optical characterization, the reaction mechanism of active species in this RF capacitive Ar plasma jet was
proposed. In particular, the effects such as additive gas (N2 or O2), torch diameter, and feeding gas
flow rate on the electrical and optical properties of this Ar plasma jet were investigated in detail.
2 Experimental setup and methods
2.1 Plasma device
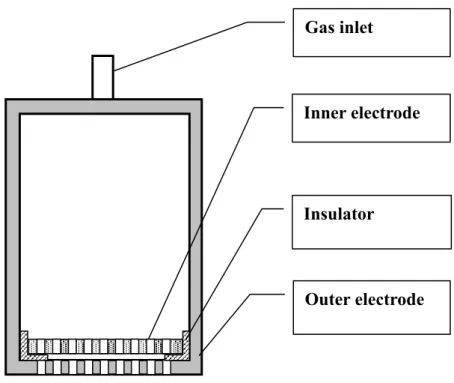
The RF capacitive plasma device used in the experiments is called APC plasma developed by Cresur Corporation of Japan. The inner diameter of the plasma torch is 25 mm. Two parallel perforated Al electrodes are consisted in the plasma torch. The diameter of the perforated holes is 1.3 mm; the distance between the holes is 3.2 mm. Ceramics is used as an insulator between the two electrodes. The gap spacing between the two electrodes is 1.5 mm. The inner electrode is connected
to the original RF power source with a frequency of 27.12 MHz through an impedance matching box, and the outer electrode is grounded. The schematic of the plasma torch is shown in Fig. 2-1. In the discharge experiment, Ar gas was working gas at flow rates of 5~20 SLPM (standard liter per
minute), RF powers were maintained at 25~100 W without reflection, N2 or O2 as an additive gas
was added into the Ar plasma jet at flow rates of 0~30 SMLPM (standard miniliter per minute), respectively. All flow rates were controlled by a mass flow controller.
2.2 Electrical measurement
The voltage applied to the discharge was measured using a 10:1 voltage probe (Tektronix P6139 10X Passive Probe 063-0870-05); the RF current was monitored using a wide band current monitor (PearsonTM current monitor) manufactured by Pearson Electronics Inc., Palo Alto, California, U.S.A. Further, a Tektronix TDS3012C digital phosphor oscilloscope was employed to obtain the voltage and current waveforms.
2.3 Optical emission spectroscopy (OES)
The optical emission spectrum of the plasma jet was collected perpendicular to the jet using an Ocean Optics USB4000 spectrometer (spectral range of 350–950 nm) with a resolution of 0.2 nm full width at half-maximum (FWHM); this was achieved using a personal computer equipped with relevant software (SpectraSuite) for both driving and acquisition. Prior to the OES measurement, the USB4000 spectrometer was calibrated using a standard halogen light source. Therefore, absolute irradiance of the active species in the plasma was obtained. During the measurement of the optical emission spectra, the exposure time was 100 ms. Emission intensities of the active species were collected at an axial position of the plasma jet (5 mm from the end of the torch), through an optical fiber with a diameter of 100 µm. The experimental setup for OES and electrical measurement is
shown in Fig. 2-2.
3 Results and discussion
3.1 Electrical characterization of APC Ar plasma jet
3.1.1 Current and voltage (I – V) characteristics
Figure 2-3 shows the current-voltage (I – V) curve for the pure Ar discharge with different input RF powers. It can be seen that at a lower input RF power (below 40 W), the discharge voltage increased with the increase in the RF current, indicating that the discharge is an abnormal glow discharge [11]. At a medium input RF power (40 W ~ 60 W), the discharge voltage increased slightly while the RF current increased remarkably, indicating the discharge became a normal glow discharge. At a higher input RF power (60 W ~ 105 W), the discharge became an abnormal glow discharge again. This abnormal glow operating regime has been observed in other studies of the atmospheric pressure plasma [12-18]. This abnormal glow is an α-mode discharge. We have explained the properties of the α-mode discharge in chapter 1.
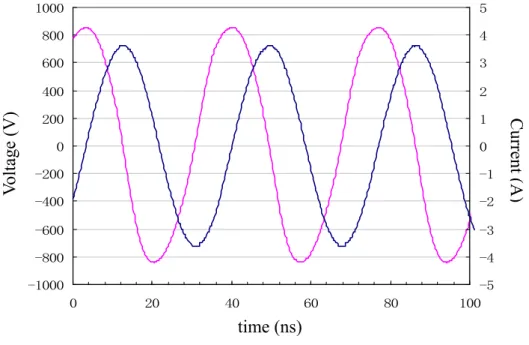
Figure 2-4 shows waveforms of the discharge voltage (red line) and the RF current (blue line) in a pure Ar discharge. Both the voltage and the current waveforms are smooth and nearly sinusoidal, indicating a mostly linear response of the discharge. Additionally, the capacitive essence of the discharge is clearly shown as the current waveform leads the voltage waveform by about 85°,
indicating the capacitive essence of the α-mode discharge [19].
3.1.2 Effect of Ar flow rate on electrical properties
Figure 2-5 shows waveforms of the discharge voltage (red line) and the RF current (blue line) in a pure Ar discharge at Ar flow rate of 5 SLPM. Compared with the waveforms of the discharge voltage and the RF current shown in Fig. 2-5 above, both the discharge voltage and the current
scarcely changed, suggesting that APC Ar plasma jet is a stable α-mode discharge when the Ar flow rate is in the experimental range of 5 SLPM to 20 SLPM.
3.1.3 Effect of torch diameter on electrical properties
Figure 2-6 shows waveforms of the discharge voltage (red line) and the RF current (blue line) in a pure Ar discharge with the torch diameter of 10 mm and RF power of 100 W. Compared with the waveforms of the discharge voltage and the RF current shown in Fig. 2-4 above, the discharge voltage increased and the RF current decreased slightly. However, considering the difference in the discharge areas of the two APC plasma torches, the current density increased with the decrease in the torch diameter, which leads to a stronger electric field.
3.1.4 Effect of additive gas (N2 or O2) on electrical properties
Effect of additive gas (N2 or O2) on electrical properties of APC Ar plasma jet was investigated.
It was found that the waveforms of the discharge voltage and the RF current scarcely changed with the addition of additive gas. However, the values of discharge voltage and the current changed with
the addition of additive gas. Figure 2-7 shows the Effects of additive gas (N2 or O2) on the discharge
voltage and the RF current of APC Ar plasma jet. It can be seen that the discharge voltage decreased and the current increased with the increasing concentration of the additive gas. The similar phenomena were observed in the He discharge by J. Park et al [20]. However, so far, there is no clear understanding for this phenomenon. We conceive that the ionization of additive gas molecules through collisions with energetic electrons results to the increase in the RF current, which will decrease the impedance of the plasma. Therefore, the discharge is able to be sustained at a lower discharge voltage. On the other hand, the RF impedance matching was disturbed with the addition of the additive gas, which could also lead to the change in the discharge voltage and the RF current.
We monitored the plasma temperature by using a thermocouple set at the exit of the plasma jet. Changes in plasma temperature with the addition of additive gas are shown in Fig. 2-8. It can be
seen that the temperature increased with the increasing concentration of added N2 or O2 gas. As
discussed above, the RF impedance matching was disturbed with the addition of the additive gas, which causes the change in the dissipated RF power in the plasma. Mean power density dissipated in the discharge can be calculated from the following formula [21]:
P = [I
mrs× V
mrs× cos(θ
v- θ
i)] / A,
where Imrs and Vmrs are the values of mean root square of the discharge current and the discharge
voltage, respectively; θv and θi mean the phase angles of the discharge voltage and the discharge
current, respectively; A represents the discharge area.
In the experiments, we noted that the phase angle between the current and the voltage decreased
slightly with the increasing concentration of additive gas (N2 or O2). From the formula above, we
can see that the decrease in the phase angle between the current and the voltage will lead to an increase in the mean power density. Therefore, we assume that the increase in the mean power density leads to the increase in the plasma temperature. In the future, we intend to calculate the mean power density dissipated in APC plasma jet quantitatively, using the equivalent circuit model reported by H. Stori, et al. [11, 12, 22].
3.2 Optical characterization of APC Ar plasma jet
3.2.1 Typical optical emission spectrum
A typical optical emission spectrum (OES) of APC Ar plasma jet in the wavelength range of 350–950 nm is shown in Fig. 2-9. It can be seen that the peaks belonging to the excited Ar atoms (4p-4s transitions) are predominant in APC Ar plasma jet (in the wavelength range of 690–950 nm)
[23, 24]. Surprisingly, peaks at 357 and 380 nm belonging to the N2 second positive system (N2
(C3∏u — B3∏g)) were also observed. However, peaks belonging to the N2 first negative system
((N2+ (B2Σ+u — X2Σ+g)) were not detected. Additionally, an O atom peak was detected at 777 nm [25,
26]. Both nitrogen and oxygen active species were detected in the pure Ar discharge because the
impurities (N2 and O2 molecules) from the Ar gas or from the atmosphere are excited and dissociated.
Emission intensities and assignments of all active species (in the wavelength range of 350–950 nm) detected in the APC Ar plasma jet are summarized in Table 2-1.
As is well known, in Ar discharge, numerous Ar metastable atoms are generated through collisions with energetic electrons. And then, the Ar metastables are excited to a higher excitation level through the successive collisions with energetic electrons. The excited Ar atoms emit light when they return to the lower excitation level. This process can be expressed by the following reactions:
e* + Ar0 → Arm + e (2-1)
e* + Arm → Ar* (4p) + e (2-2)
Ar* (4p) → Ar* (4s) + hν (2-3) These reactions can be used to explain the emission lines of excited Ar atoms. On the other hand, it was previously reported that Ar metastables hold roughly 11.5 eV of energy, which is close to the
excitation energy of N2 second positive system (N2 (C3∏u — B3∏g)) (E ≈ 11.1 eV) [23, 24].
Therefore, a resonant reaction easily occurs between the Ar metastables and ground-state molecular
N2.
Arm + N
2 (X1Σ+g) → Ar0 + N2 (C3∏u) (2-4)
N2 (C3∏u) → N2 (B3∏g) + hν (2-5)
These reactions help explain why the emissions corresponding to the N2 second positive system
(N2 (C3∏u — B3∏g)) were observed.
Additionally, it was reported that the most probable channel for the formation of O atoms was
through collisions between the oxygen molecular ions (O2+) and electrons [27]. Oxygen molecular
ions (O2+) are generated mainly through the Penning ionization of O2 molecules. Apparently, Ar
metastables have insufficient energy for the generation of O2 molecular ions (O2+) (E ≈ 18.2 eV)
through the Penning ionization [23]. However, in the Ar discharge, the excited O atoms at 777 nm can probably be generated through the following channels [23, 28-30]:
Ar* + O2 (X3Σ-g) → O (1D) + O (3P) + Ar0 (2-6)
e* + O2 (X3Σ-g) → e + [O (1D) or O (1S)] + O (3P) (2-7)
e* + O2 (X3Σ-g) → 2e + O2+ (b4Σ-g) (2-8)
e* + O2+ (b4Σ-g) → 2O (3P) (2-9)
As we discussed above, it can be seen that reaction (2-8) and reaction (2-9) are the main channel for the formation of O atoms in APC Ar plasma jet. These reactions may explain the detection of excited O atoms at 777 nm in APC Ar plasma jet.
3.2.2 Effect of Ar flow rate on OES
Effect of Ar flow rate on emission intensities of active species in APC Ar plasma jet is shown in Fig. 2-10. It can be seen that the emission intensities of excited Ar and O atoms increased
significantly with the increase in the Ar flow rate. However, the emission intensity of N2 (C3∏u —
B3∏
g) decreased with the increase in the Ar flow rate. It was reported that the transport of active
of active species at distant positions from the nozzle since the active species in plasma jet decay quickly in the atmosphere [31]. Therefore, a higher Ar flow rate leads to a faster velocity of the Ar stream, which is very helpful for the transport of the active species. Consequently, more active species reached to a certain position from the exit (a distance of 5 mm in the experiment) at a higher Ar flow rate. This is why the emission intensities of excited Ar and O atoms increased significantly
with the increase in the Ar flow rate. However, the observed N2 (C3∏u — B3∏g), generated through
reaction (2-4), mainly comes from the afterglow zone. It is because N2 (C3∏u) in the discharge
region will transform to N2+ (B2Σ+u) quickly through the successive collisions with energetic
electrons. And then N2+ (B2Σ+u) will be trapped in the discharge region by a very fast polarity change
(details about this will be discussed in section 3. 2. 4). Therefore, though a higher Ar flow rate is
helpful for the transport of Ar metastables, the entry of N2 (from the atmosphere) into the Ar stream
becomes difficult with the increase in the Ar flow rate. It will restrict the rate of reaction (2-4). This
may be helpful to explain why the emission intensities of N2 (C3∏u — B3∏g) decreased with the
increase in the Ar flow rate.
3.2.3 Effect of torch diameter on OES
Effect of torch diameter on optical emission spectrum of APC Ar plasma jet is shown in Fig. 2-11. It can be seen that the plasma radiation increased with the decrease in the torch diameter. We have discussed the effect of torch diameter on electrical properties of APC Ar plasma jet in section 3.1.3. It was found that for a constant input RF power, the current density increased with the decrease in the torch diameter. Therefore, the electric field strength is stronger in case of the 10-mm-diameter plasma torch, which leads to a higher electron density. From the reactions above, it can see that the increased electron density will lead to an increase in the plasma radiation. On the
other hand, as we discussed above, the velocity of the Ar stream increased with the decrease in torch diameter, which is helpful for the transport of active species and will lead to an increase in the emission intensities of active species.
3.2.4 Effect of additive gas (N2 or O2) on OES
Changes in emission intensities of active species in APC Ar plasma jet with different flow rates
of additive gas (N2 or O2) are shown in Fig. 2-12. From Fig. 2-12 (a), it can be clearly seen that the
emission intensities of excited Ar and O atoms decreased with the increasing concentration of added
N2 gas. The quenching effect of the added N2 gas causes the decrease in the emission intensities of
excited Ar and O atoms. On the other hand, the emission intensities of N2 (C3∏u — B3∏g) increased
only slightly with the addition of N2 gas. From Fig. 2-12 (b), similar to the N2 addition, it can be
clearly seen that the emission intensities of excited Ar atoms and N2 (C3∏u — B3∏g) decreased with
the increasing concentration of added O2 gas. The quenching effect of added O2 gas causes the
decrease in the emission intensities of excited Ar atoms and N2 (C3∏u — B3∏g). Additionally, the
emission intensity of O atoms increased significantly with the addition of O2 gas. A maximum
emission intensity of O atoms was observed at the added O2 flow rate of 15 smlpm. More than 15
smlpm of O2 addition causes the decrease in the emission intensity of O atoms because of the
quenching effect.
Comparison of emission intensities of active species before and after the addition of N2 or O2 is
shown in Fig. 2-13. It can be seen that the emission intensities of N2 (C3∏u — B3∏g) increased only
slightly with the addition of N2 gas. Additionally, with the N2 gas addition, the total emission
intensity decreased more remarkably than with the same amount of O2 gas addition. However, it was
other hand, as we discussed in the above section of 3.1.4, the RF current increased with the addition
of N2 gas, suggesting the occurrence of collision ionization of the added N2 gas. Therefore, we
assume that new ionic species (such as N2+ (B2Σ+u)) are formed. In the Ar discharge, the nitrogen
molecular ions (N2+ (B2Σ+u)) can probably be generated through the following channels [24, 32].
e* + N2 (X1Σ+g) → N2+ (B2Σ+u) + 2e (2-10)
e* + N2 (C3∏u) → N2+ (B2Σ+u) + 2e (2-11)
Ar+ + N2 (X1Σ+g) → Ar0 + N2+ (X2Σ+g) (2-12)
N2+ (X2Σ+g) + e* → N2+ (B2Σ+u) + e (2-13)
Considering the reaction constant rates of the above reactions and the concentrations of active
species, reaction (2-11) is the main reaction for the generation of N2+ (B2Σ+u) in Ar discharge.
However, we never detected the emission from N2+ (B2Σ+u — X2Σ+g) in the afterglow zone of the
plasma jet since the ions are trapped in the electric field (discharge region) by a very fast polarity change (at a frequency of 54.24 MHz). As we well known, the ionization extent in the He plasma is quite high because the He metastables hold a very high energy (E ≈ 19.8 eV), which is almost capable to ionize any gas molecules through the Penning ionization. We have attempted the He discharge with APC plasma torch. Nearly no plasma jet was observed because ionic species are trapped in the discharge region. This result is well in agreement with our assumption.
4 Conclusions
In this study, in order to get better understanding for the RF capacitive atmospheric pressure cold Ar plasma jet, electrical and optical characterizations of APC Ar plasma jet were performed by using electrical diagnostics and OES technique. Electrical characterizations showed that the discharge of APC Ar plasma jet is an abnormal glow discharge at a lower input RF power (below 40 W); then the

![Fig. 1-3 Typical electrode arrangements of dielectric barrier discharges. Taken from reference [9]](https://thumb-ap.123doks.com/thumbv2/123deta/6223852.1090801/30.892.167.746.130.544/typical-electrode-arrangements-dielectric-barrier-discharges-taken-reference.webp)