DEVELOPMENT OF A FRAMEWORK FOR
QUANTITATIVE ASSESSMENT OF ENVIRONMENTAL
CHANGES ON STREAMFLOW AND SEDIMENT FLOW
(河川流量及び土砂流出に関する環境変化の定量的評価手法の開発)
山梨大学大学院
医学工学総合教育部
博士課程学位論文
2013 年 9 月
WANG JIE
DEVELOPMENT OF A FRAMEWORK FOR
QUANTITATIVE ASSESSMENT OF ENVIRONMENTAL
CHANGES ON STREAMFLOW AND SEDIMENT FLOW
(河川流量及び土砂流出に関する環境変化の定量的評価手法の開発)
September 2013
JIE WANG
Development of a Framework for Quantitative Assessment of
Environmental Changes on Streamflow and Sediment flow
河川流量及び土砂流出に関する環境変化の定量的評価手法の
開発
A dissertation submitted in partial fulfillment of the requirements for the degree of Doctor of Philosophy in Engineering
Global Center of Excellence (GCOE)
Special Doctoral Course on Integrated River Basin Management Interdisciplinary Graduate School of Medicine and Engineering
University Of Yamanashi
September 2013
i
ABSTRACT
Our rapidly changing world is always changing hydrology and environment. Studies on ecohydrological processes in a changing environment have been the focus of hydrological science in the 21st century. Among all environmental changes, land use/cover change and climate change are two most important factors influencing hydrological conditions of catchments along with geology and topography. Climate change impact on streamflow and sediment yield has already been accepted. With the increase of population and rapid economic and social development, human activities have been seriously accelerating the speed of land use/cover changes, which accelerated climate change effects. Elucidating the impacts of land use/cover change at different scales on hydrological process, surface energy balance and surface roughness are not straightforward but rather complex to warrant any generalizations. Quantitative assessment of land use/cover and climate changes on streamflow and sediment load of past and future is a complex and difficult task that requires many aspects to be considered, including environmental, socioeconomic and institutional issues.
The main objective of this thesis is to develop a framework for quantitative assessment of environmental changes on streamflow and sediment flow. The developed framework was demonstrated and discussed in four subsequent sections, where Da River Basin was selected as a case study:
1. Developing new sediment rating curve considering temporal vegetation cover changes
A sediment rating curve can describe the average relation between discharge and suspended sediment concentration for a certain location. However, the sediment load of a river is likely to be undersimulated from water discharge using least squares regression of log-transformed variables and the sediment rating curve doesn‘t consider changes of vegetation cover monthly or yearly. The Normalized Difference Vegetation Index (NDVI) can well be used to analyze the status of the vegetation coverage well. Thus long time monthly NDVI data was used to detect vegetation change in the past 19 years in this study. And monthly suspended sediment concentration and discharge from 1988 to 2006 in Laichau station were used to develop and interpret one new sediment rating curve. Compared with the common sediment rating curve, the new curve can simulate and predict the suspended sediment concentration much better in the Da river basin. In addition, we also applied new sediment rating in another two basins and got promising results. The new curve can describe the relationship among sediment yield, streamflow and vegetation cover, which can be the basis for soil conservation and sustainable ecosystem management.
ii
2. Developing model simulation method to quantitatively separate impacts on
streamflow and sediment flow from climate change and human activities
It is critical to quantify the contribution of climate change and human activities on the change of historical streamflow and sediment flow, which can provide a scientific basis for future land conservation and river ecological conservation. In this part, Pettitt mutation method was employed to detect trends and changes in annual streamflow and 1993 was recognized as the mutation year for streamflow. SWAT model simulation method was then applied to separate different effects from climate change and human activities. Based on new sediment rating curve, one well fitted curve between sediment and runoff was introduced to simulate the suspend sediment. Results showed that effects of human activities on streamflow accounted for more than 50% of total streamflow changes both in the Laichau and Tabu catchments, which indicated that human activities are the main factor to affect the changes of streamflow and sediment flow into the Hoa Binh reservoir.
3. Coupling new sediment rating curve and ecological model to evaluate human-induced land cover change effect on sediment flow
Sediment load can provide very important perspective on erosion of river basin. The changes of human-induced vegetation cover, such as deforestation or afforestation, affect sediment yield process of a catchment. In this last part, we have already known that human activities are main factors to affect sediment yield. However, we do not know whether land cover change or vegetation cover change is the main human activities or not. On purpose of this, a new sediment rating curve considering vegetation cover was developed to evaluate the impact of vegetation cover changes on sediment yield in Da River Basin. The Normalized Difference Vegetation Index (NDVI) and leaf area index (LAI) were used to analyze the status of the vegetation cover well. Thus long time series NDVI from satellite was applied to represent vegetation cover in the past years. Potential LAI from ecosystem model (Biome-BGC) was used to explain the vegetation cover without human activities. Observed streamflow and simulated streamflow from SWAT model were used to stand for the streamflow with and without human activities effects. Finally, standardized NDVI and LAI, observed streamflow and simulated streamflow were inputted into the new sediment rating curve to evaluate human-induced vegetation cover change effect on sediment load. Results showed effect of human-induced vegetation cover increased 13.7% of total sediment load in the Laichau station in the period of 1994 to 2004 and human-induced vegetation cover change was the main human activities to increase sediment yield. One new method to quantify of human-induced vegetation cover change impact on sediment load was presented, which may provide guidance for future similar studies. In addition, evaluation of human-induced vegetation cover effect on sediment load is critically important in directing efforts in managing land use, in improving agricultural practices, and in protecting soil erosion in the Da River.
4. Analyzing the impact on streamflow and sediment flow under different future climatic change scenarios and potential future land cover change scenarios
iii
We have already evaluated that climate change and land cover change changed the historical streamflow and sediment yield, and land cover change is the main factor. But future streamflow and sediment yield changes under different future climatic change scenarios and potential future land cover change scenarios still have not been evaluated For this purpose, future scenario of land cover change is developed based on historical land cover changes and land change model (LCM). At the same time, climate change scenarios are built based on downscaling outputs of GCMs from the IPCC Fourth Assessment Report. In addition, future leaf area index (LAI) is simulated by ecological model (Biome-BGC model) based on future land cover scenario. Then future scenarios of land cover change, climate change and LAI are used to drive hydrological model and new sediment rating curve. Results showed that the annual streamflow would increase by 17.5% in Tabu catchment and 19% in Laichau catchment and the annual sediment load would increase significantly by 33% in Laichau catchment under combined impacts of future climate and land cover change. The results of this research provide information that decision-makers need in order to promote water resources planning efforts. Besides that, this study also makes contribute to the basic framework for assessing climate change impacts on streamflow and sediment yield that can be applied in the other basins around the world.
In this thesis, a comprehensive framework was developed for quantitative assessment of environmental changes on both historical and future streamflow and sediment flow, which was successfully applied in Da River Basin. In addition, this study is expected to provide information that decision-makers need for appropriate utilization of water resources, flood control, soil conservation and ecological protection. Besides that, this framework will also provide guidance for other potential applications for the other basins around the world.
Key words: climate change, land cover change, hydrological model, streamflow, sediment yield, impacts separation, future prediction
iv
ACKNOWLEDGEMENT
Looking back on the fantastic journey of past three years, I found I could not gone so far without continuous help and strong support from many people. It is a great pleasure for me to thank for their scientific guidance, encouragement and patience.
First of all, I would like to express my topmost thankful to my supervisor, Associate Professor Hiroshi Ishidaira. His guidance, support, and inspiration from the very beginning to the concluding stage of this dissertation enable me to develop an understanding of the research topic. During my Ph.D. studies, his intelligent, optimistic and diligent research attitude deeply influenced me. He is more than an academic supervisor for me, but also a life mentor. Especially, I learned from him how to accomplishment the research through individual thinking, which would benefit me for the rest of my life.
I further express my gratitude to all the Professors and researchers in Global Center of Excellence (GCOE) Program, International Research Center for River Basin Environment, University of Yamanashi, who instructed, helped and encouraged me in various ways during my doctoral study. My heartfelt appreciation goes to all members of my senior seminar: Professor Y. Sakamoto, Professor T. Suetsugi, Professor F. Kazama, Associate Professor Y. Ichikawa, Associate Professor K. Nishida, Dr. J. Magome, Dr. K. Souma, Dr. I. Inagaki, Dr. T. Sano, Dr. T. Nakamura, Dr. K. Kakizawa and Dr. V. Pandey. I also would like to specially thank the retired Professor K. Sunada for his helpful guidance and encouragement.
I will appreciate the kindly support from stuffs of GCOE project and International Student Center and Office of International Exchanges of University of Yamanashi, especially grateful to Ms. M. Ishihara, Ms, S. Maruyama Ms. W. Sano and Ms. M. Katou. I would like to express my gratitude to all my friends in GCOE program, who accompany, support and encourage me during my life in Japan. My sincere thanks go to Dr. W. Sun, Dr. Q. Li, Dr. W. Khanitchaidecha, Dr. S.S. Wu, Dr. R. Hapsari, Dr. T. Ty, Dr. I. Inagaki, Dr. B. Seng, Dr. T. Khujanazarov, Dr. R.A. Kristanti, Dr. M. Sujata, Dr. D.T. Nga, Dr. D.N. Khoi, Dr. Y. Wijayanti, Mr. S. Manandhar, Ms. L. Li, Ms. S. Salina, Ms. R. Setyawaty, Mr. S. Park, Mr. M. Hashimoto, Ms. Y. Li, Mr. S. Heng, Ms. H. Widyasamratri, Ms. S. Shrestha, Mr. D. Amarathunga, Mr. P.D. Udmale, Ms. T.H. Bui, Mr. S. Ning, Ms. N.T.P. Mai.
I would like to give my sincere gratitude to Professor Z.X. Xu and Ms. J.Y. Li, who recommended me to study in Japan, and keeps encouraging and supporting me during my Ph.D. study. As well, I want to acknowledge my wife, my son and my parents, their love and support enabled me to overcome the frustrations of last three years.
Last but not least, thanks to GCOE Program and Ministry of Education, Culture, Sports, Science and Technology (MEXT) and for the financial support during the study period. I
v
would also like to thank everyone who directly or indirectly offered his or her help to this thesis.
vi
TABLE OF CONTENTS
Abstract ... i
Acknowledgement ...iv
List of figures ... x
List of tables ...xii
List of abbreviations ... xiii
CHAPTER I ... 1
Introduction ... 1
1.1. Background ... 1
1.2. Necessity of the study ... 2
1.3. Research objective ... 3
1.4. Organization of the dissertation ... 4
CHAPTER II ... 7
Literature review ... 7
2.1. Introduction ... 7
2.2. Relationships among land/vegetation cover, climate, human activities related to streamflow and sediment yield ... 7
2.2.1. Researches on relationship between climate change and land or vegetation cover ... 8
2.2.2. Researches on relationship between human activities and land or vegetation cover ... 9
2.2.3. Researches on separation impacts from climate change and human activities on land or vegetation cover change ... 9
2.3. Relationship between streamflow and sediment yield ... 10
2.3.1. Researches on relationship between streamflow and sediment yield ... 10
2.3.2. Researches on models to estimate sediment yield of a basin... 12
2.4. Studies on impacts of land/vegetation cover change and climate change on streamflow and sediment yield ... 15
2.4.1. Studies on separation of integrated impacts on historical streamflow and sediment yield ... 15
2.4.2. Studies future climate change and its impact on streamflow and sediment yield ... 17
2.4.3. Studies on land use/cover change prediction and its impact on streamflow and sediment yield ... 21
vii
2.4.4. Combine impact of future climate and land use/cover change on
streamflow and sediment yield ... 23
CHAPTER Ⅲ ... 25
Study area and General research framework ... 25
3. 1. Study Area Description ... 25
3.1.1 General description ... 25
3.1.2 hydro-meteorological condition ... 27
3.1.3 Land use/cover and soil condition ... 28
3. 2. General research framework ... 29
CHAPTER VI ... 31
New sediment rating curves development and its validation in other asian river basins ... 31
4.1. Introduction ... 31
4.2. Dataset and methodology ... 32
4.2.1. Data Description and validation basins... 32
4.2.2. Methodology ... 33
4.3. Results ... 34
4.3.1. Limitation of common sediment rating curve ... 34
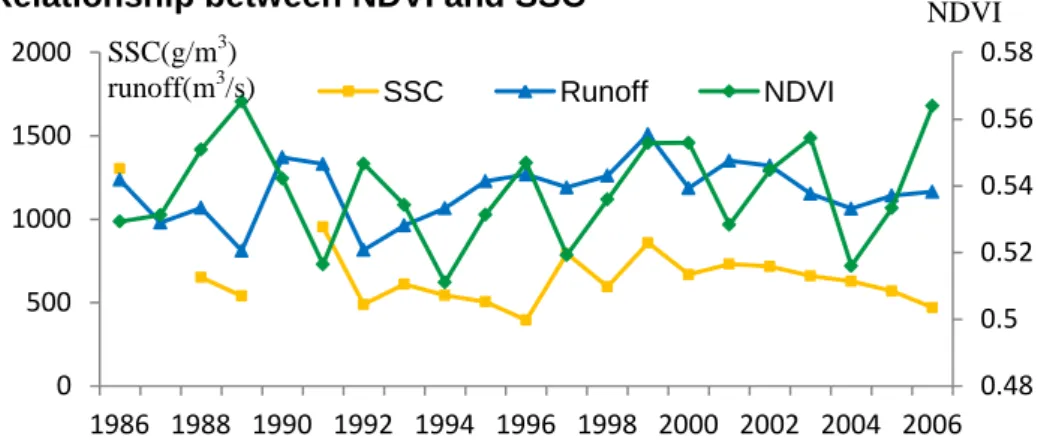
4.3.2. Relationship between NDVI and SSC ... 35
4.3.3. New sediment rating curve development ... 35
4.3.4. Validation in other river basins ... 37
4.3.5. Discussions ... 38
4.4. Conclusions ... 39
CHAPTER Ⅴ ... 41
Developing model simulation method to separate impacts from climate change and human activities on streamflow and sediment flow ... 41
5.1. Introduction ... 41
5.2. Dataset and methodology ... 43
5.2.1. Data Description ... 43
5.2.2. Analysis of change point in annual series ... 43
5.2.3. Model simulation method ... 44
5.3. Results ... 47
5.3.1. Determination of research period ... 47
viii
5.3.3. Effects of human activities and climate change on sediment load ... 50
5.3.4. Discussions ... 51
5.4. Conclusions ... 52
CHAPTER VI ...55
Coupling new sediment rating curve and ecological model to evaluate human-induced vegetation cover change effect on sediment flow ...55
6.1. Introduction ... 55
6.2. Dataset and methodology ... 57
6.2.1. Data Description ... 57
6.2.2. Ecological model (Biome-BGC)... 57
6.2.3. Standardization of LAI and NDVI ... 59
6.2.4. New modified sediment rating curve ... 60
6.3. Results ... 60
6.3.1. Determination of research period ... 60
6.3.2. Biome-BGC simulation results ... 61
6.3.2. NDVI and potential LAI analysis ... 62
6.3.3. New modified sediment rating curve development ... 63
6.3.4. Effects of human-induced vegetation cover change on sediment load ... 65
6.3.5. Discussions ... 65
6.4. Conclusions ... 66
CHAPTER Ⅶ ...67
Analyzing the potential effect of future land cover and climate change on streamflow and sediment flow based on land use change model and GCMs DOWNSCALING MODEL...67
7.1. Introduction ... 67
7.2. Dataset and methodology ... 69
7.2.1. Data Description ... 69
7.2.2. Research framework ... 70
7.2.3. BTOPMC model ... 70
7.2.4. Land use/cover change prediction ... 72
7.2.5. Climate change scenarios generation ... 73
7.3. Results ... 76
7.3.1. Land cover change scenarios generation ... 76
ix
7.3.3. Future LAI prediction ... 83
7.3.4. BTOPMC model simulation (1991-2000) ... 83
7.3.5. New sediment rating curve (1991-2000) ... 84
7.3.6. Future climate change impacts on streamflow and sediment yield ... 85
7.3.7. Future land cover change impacts on streamflow and sediment yield ... 86
7.3.8. Combined impacts of future climate and land cover change impacts on streamflow and sediment yield ... 88
7.4. Conclusions ... 89
CHAPTER Ⅷ ... 91
Summary of the Study ... 91
8.1. Conclusions ... 91
8.2. Contributions ... 93
8.3. Recommendations for future research... 93
References ... 95
Appendices ... 109
Appendix Tables ... 109
x
LIST OF FIGURES
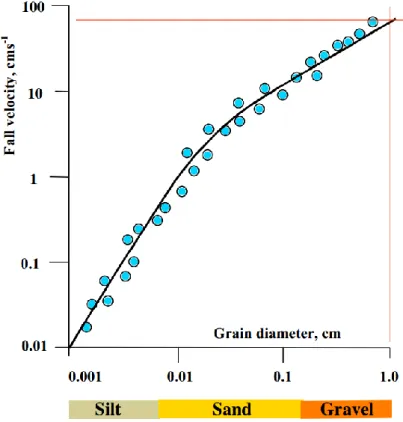
Figure 2.1. Fall velocity in relation to diameter of a spherical grain of quartz ... 11
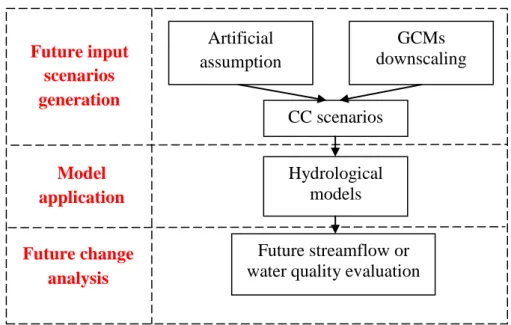
Figure 2.2. General approach for evaluation of future climate change impact on streamflow and water quality ... 18
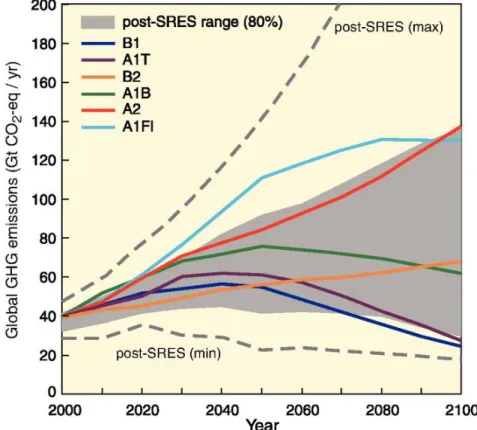
Figure 2.3. Scenarios for GHG emissions from 2000 to 2100 in the absence of additional climate policies (IPCC,2007) ... 19
Figure 2.4. Overview of the general land use/cover change modeling procedure ... 22
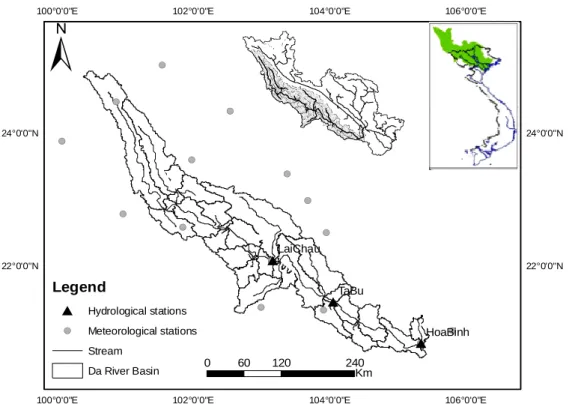
Figure 3.1. Location of the study area and the meteorological stations ... 26
Figure 3.2. (a) DEM and (b) Slope maps of the Da River Basin ... 26
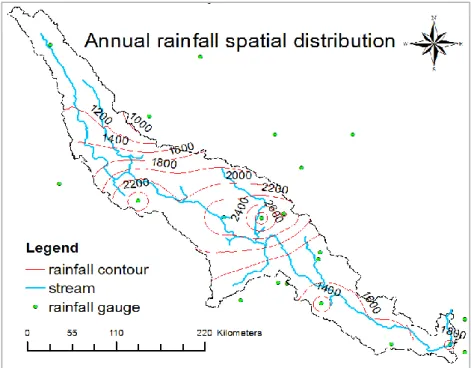
Figure 3.3. Spatial distribution of annual rainfall in the Da River Basin ... 27
Figure 3.4. Monthly mean rainfall in the Da River Basin... 27
Figure 3.5. Annual runoff (left) and SSC (right) in the Da River Basin ... 28
Figure 3.6. Land cover map (right) and soil map (left) in the Da River Basin ... 28
Figure 3.7. The general framework of the thesis ... 29
Figure 4.1. Location of another two validation basins ... 33
Figure 4.2. The research framework for developing new sediment rating curve ... 33
Figure 4.3. Comparison of monthly observed SSC and simulated SSC from common sediment rating curve ... 35
Figure 4.4. Comparison among annual SSC, runoff and NDVI in Da River Basin ... 35
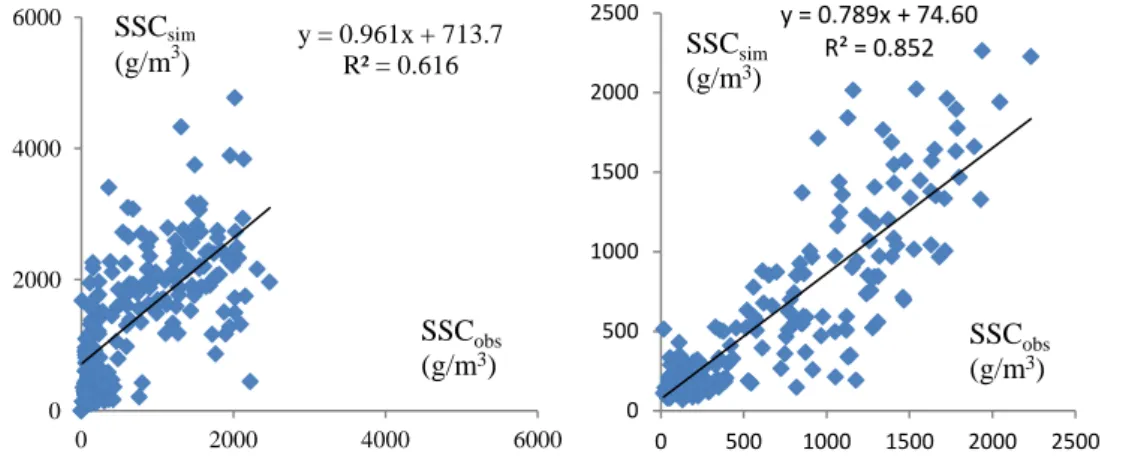
Figure 4.5. Scatterplot of observed and simulated monthly SSC from SWAT (left) and new sediment rating curve (right) in the Laichau station ... 37
Figure 4.6. Relationship between annual SSC and NDVI ... 37
Figure 5.1. Schematic diagram of ΔQ and different period separation ... 44
Figure 5.2. Hydrologic cycle considered by SWAT model (from Neitsch et al., 2001) .. 45
Figure 5.3. Pettitt mutation test of annual streamflow. The horizontal dotted and solid lines represent the critical values of the 5% and 10% significance level respectively. ... 48
Figure 5.4. Comparison of observed and simulated monthly streamflow in the DRB ... 49
Figure 5.5. Relation between observed Q and SSC in the DRB ... 50
Figure 5.6. (a) Difference between annual accumulated NDVI from 1982 to 1993 and from 1994 to 2006; (b) Linear slope of annual accumulated NDVI from 1982 to 2006 ... 52
Figure 6.1. Conceptual Diagrams of Biome-BGC model ... 58
Figure 6.2. Conceptual diagram showing BiomeBGC general model structure ... 59
Figure 6.3. Change of annual maximum NDVI in the upstream of laichau station (1982-2006) ... 61
Figure 6.4. Scatterplot of satellite and simulated monthly basin average LAI ... 61
Figure 6.5. Comparison between simulated and satellite annual maximum LAI ... 62
Figure 6.6. Linear slope of actual annual maximum NDVI from GIMMS (1982-2006) (Significant: passed significance level of 0.05) ... 63
Figure 6.7. Linear slope of potential annual maximum LAI from Biome-BGC model (1982-2006) (Significant: passed significance level of 0.05) ... 63
Figure 6.8. Comparison of season and month average standardized potential LAI and NDVI from 1994 to 2004 ... 64
xi
Figure 6.9. Scatterplot of observed and simulated monthly SSC in the Laichau station . 64
Figure 7.1. The research framework for Chapter 7 ... 70
Figure 7.2. BTOPMC Runoff Generation Structure ... 71
Figure 7.3.Technological process of SDSM and ASD model ... 75
Figure 7.4. Gains and losses of land cover between 2001 and 2008 ... 77
Figure 7.5. Net land cover change between 2001 and 2008 ... 77
Figure 7.5. Selected drive factors for LCM ... 78
Figure 7.6. Potential for transition from forest to shrublands ... 79
Figure 7.7. Potential for transition from shrublands to croplands ... 79
Figure 7.8. Reference (left) and simulated (right) land cover map of 2011 ... 80
Figure 7.9. Predicted future land cover map of 2050 ... 80
Figure 7.10. Basin average monthly rainfall changes from 2046 to 2055 compared with baseline from 1991 to 2000(up: CCCMA47 model; bottom: ECHAM5) ... 82
Figure 7.11. Average annual rainfall changes from 2046 to 2055 compared with baseline from 1991 to 2000 for different stations (up: CCCMA47 model; bottom: ECHAM5) ... 83
Figure 7.12. Comparison between current vegetation cover (Mndvi1991-2000) and future vegetation cover (Mlai2046-2055)... 83
Figure 7.13. Comparison of observed and simulated daily streamflow in the DRB (calibration period: 1991-1995, validation period: 1996-2000) ... 84
Figure 7.14. Changes in future monthly, seasonal annual streamflow under the A1B scenario for Laichau station and Tabu station ... 85
Figure 7.15. Changes in future monthly, seasonal annual streamflow and sediment load under the A1B scenario for Laichau station ... 86
Figure 7.16. Changes in monthly, seasonal annual streamflow under land cover changes in 2050 for Laichau station and Tabu station... 86
Figure 7.17. Changes in future monthly, seasonal annual streamflow and sediment load under land cover change scenario in 2050 for Laichau station ... 87
Figure 7.18. Changes in monthly, seasonal annual streamflow under land cover changes and climate changes in 2050s for Laichau station and Tabu station... 88
Figure 7.19. Changes in monthly, seasonal annual streamflow and sediment load under land cover changes and climate changes in 2050s for Laichau station ... 88
Figure B.1. Potential for transition from shrublands to forest ... 110
Figure B.2. Potential for transition from forest to croplands ... 110
Figure B.3. Changes in monthly, seasonal annual streamflow under the A1B scenario downscaled by SDSM and ASD (up:Laichau station, down: Tabu station) ... 111
xii
LIST OF TABLES
Table 2.1. Sediment rating curves ... 12
Table 2.2. Erosion/sediment transport models (Modified from Merritt et al., 2003) ... 14
Table 2.3. Algorithm of land use/cover change models ... 21
Table 4.1. Basic characters of our selected basins ... 32
Table 4.2. Statistics analysis between monthly observed SSC and simulated SSC from common sediment rating curve ... 34
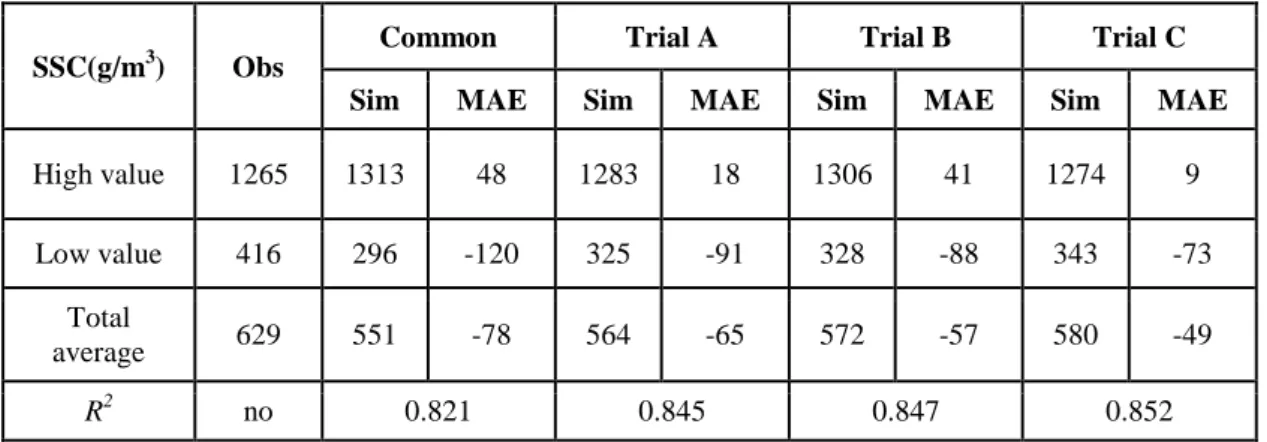
Table 4.3. Comparison of simulation results from three new sediment rating curves and common sediment rating curve in Da River Basin ... 36
Table 4.4. Comparison of simulation results from new sediment rating curve and common sediment rating curve in Chiang Saen basin ... 38
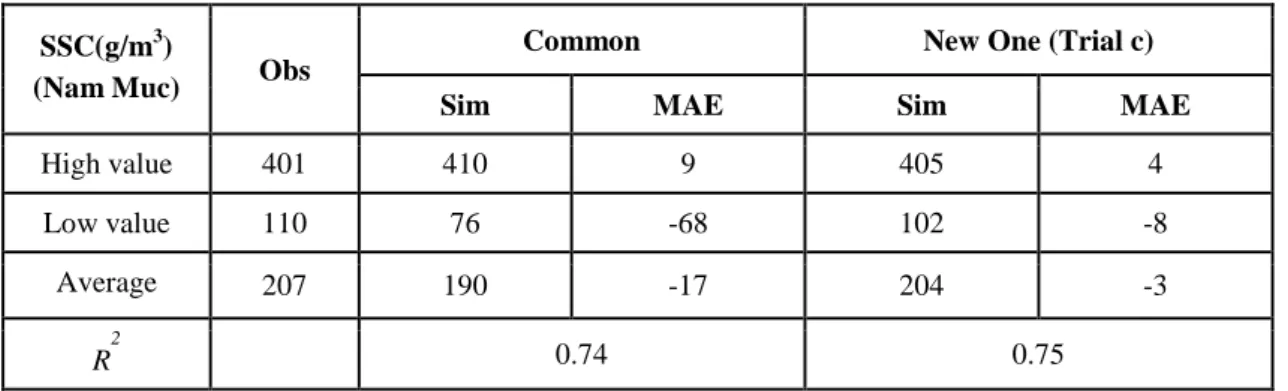
Table 4.5. Comparison of simulation results from new sediment rating curve and common sediment rating curve in Nam Muc basin ... 38
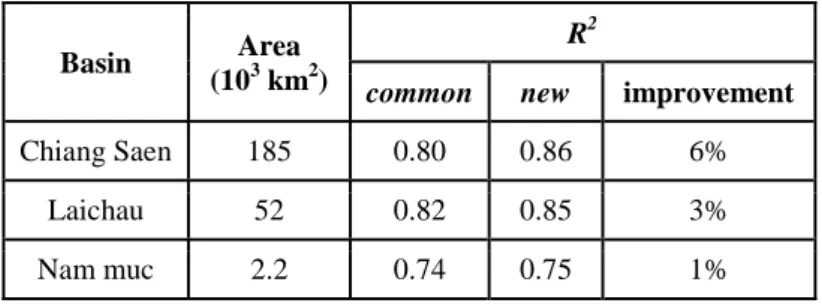
Table 4.6. Summary of improvement compared with common rating curve in three basins ... 39
Table 5.1. Evaluation of model simulation during the pre-change period for the catchments controlled by Laichau and Tabu stations in the DRB ... 49
Table 5.2. Effects of human activities and climate change on the annual streamflow (mm) across catchments controlled by hydrological stations in the DRB ... 49
Table 5.3. Performance of New sediment rating curve for Laichau ... 50
Table 5.4. Effects of human activities and climate change on the annual sediment load (106 ton/yr) of Laichau station ... 50
Table 6.1. Statistic results of MLAI and MNDVI from 1994 to 2004 ... 64
Table 6.3. Effects of human-induced vegetation cover change on month average sediment load (106ton/month) at Laichau station ... 65
Table 7.1. Dataset summary for different models ... 70
Table 7.2. Difference between the reference map of 2011 and the simulated map 2011 80 Table 7.3. Future land cover changes of 2050 created through neural networks compared with the baseline map of 2011 image (area percent: %) ... 81
Table 7.4. Explained variances (R2) of rainfall stations in calibration of ASD and SDSM ... 82
Table 7.5. Evaluation of model simulation during the baseline period for the catchments controlled by Laichau and Tabu stations in the DRB ... 84
xiii
LIST OF ABBREVIATIONS
CC Climate changeLUCC Land use/cover change VCC Vegetation cover change
IPCC Intergovernmental Panel on Climate Change GCM General Circulation Model
SWAT Soil and Water Assessment Tool NDVI Normalized difference vegetation index LAI Leaf area index
PCA Principal Component Analysis SSC Suspended sediment concentration SL Suspended load
SDSM Statistical Downscaling Model
ASD Automatic Statistical Downscaling Model DRB Da River Basin
FAO Food and Agriculture Organization of the United Nations Corr Correlation coefficient
1
CHAPTER I
INTRODUCTION
1.1. BackgroundWe live in a rapidly changing world. Studies on ecohydrological processes in a changing environment have been the focus of hydrological science in the 21st century. Among all environmental changes, Land use/cover change and climate change are two most important factors influencing hydrological conditions of catchments along with geology and topography (Ma, 2005; Zheng et al., 2009). Elucidating the impacts of land use/cover change at different scales on hydrological process, surface energy balance and surface roughness are not straightforward but rather complex to warrant any generalizations. Quantitative assessment of land use/cover and climate changes on streamflow and sediment load of past and future is a complex and difficult task that requires many aspects to be considered, including environmental, socioeconomic and institutional issues.
With the increase of population and rapid economic and social development, human activities have been seriously accelerating the speed of land use/cover changes, which is human-induced land use/cover change. On the other hand, global patterns in the vulnerability of ecosystems to vegetation shifts due to climate change (Patrick et al., 2010), that is climate change-induced land use/cover change. Both human-induced and climate change-induced land use/cover change are directly linked to changes of hydrological cycle by altering the balance between rainfall and evaporation (Chomitz et al., 1998; Costa et al., 2003). Land use/cover change can also alter the velocity of water, whether in the form of streams or overland flow, by changing slope or gradient and the roughness encountered by the flow (Wardrop et al., 1998), which modify the surface resistance and soil erodibility, and consequently impact the sediment yield.
Land cover plays an important role for the hydrological systems in catchments. Streamflow and sediment load also responds to climate variability and it is necessary to consider the effect of climate variability in assessing streamflow and sediment load changes. The Intergovernmental Panel on Climate Change (IPCC) emphasized that global warming and climate change is unavoidable phenomenon (IPCC, 2007). It has been generally accepted that climate change have brought great impacts on the hydrological process of basin scale, especially for streamflow and sediment flow (Schulze, 2000; Li et al., 2007; Zhao et al., 2009). Climate change has resulted in the rise of atmospheric temperature and modified pattern of precipitation and evapotranspiration, which has directly led to alteration in streamflow (Li et al., 2007) and further affected sediment load.
2
In view of global environmental changes, faced to complex relationship between land use/cover change and climate change, quantitative assessment of environmental changes effect on both streamflow and sediment flow of past and future is essential and urgent. Investigating their contributions to affect the changes of the eco-hydrological processes is thus of paramount importance to improve the sustainable development of water resources and provide ecological conservation measures.
1.2. Necessity of the study
As well known, streamflow and sediment load of one catchment is intimately related to the geology, topography, climate, and land use/cover within the basin. The geologic and topographic variables are mostly fixed, but long term changes in climatic conditions, land use/cover will produce abrupt alterations in hydrological processes and sediment yield. Both land use/cover change and climate change are the major controls of water balance and sediment yield in a catchment, however, streamflow and sediment load changes are affected by climate change and land use/cover change in an integrated way. In order to evaluate effect of land use/cover change, the climate change effect assessment is also indispensable.
Generally, assessment effect of land use/cover change and climate change on streamflow and sediment flow should be studied from two perspectives, historical evaluation and future prediction assessment. Historical insight into these effects can not only improve the knowledge of river processes, but also is precondition for analysis of future environmental changes impacts on streamflow and sediment load. It is necessary to first investigate the main factor affecting the changes of historical streamflow and sediment load. Related to past researches, the most commonly used methods for estimating impacts of environmental changes on runoff or streamflow are statistical analysis method and catchment experiment method and to a lesser extent the hydrological simulation method. Statistical method is simple but lacking of a physical basis. The paired catchment experiment method is traditionally used for estimating the effect of forest management practices, such as afforestation and deforestation on catchment water availability (Hewlett et al., 1969; Garcia-Ruiz et al., 2008). Although the catchment experiment method is very useful in quantifying the impacts of past land cover change, paired catchment experiment method is quite costly, time-consuming, and it is difficult to find one reasonable paired catchment for most studies. Moreover, studies of paired catchments are typically less than 1 km2 in size. Whether the results from these catchments can be used to larger basins is necessary to further investigate. The hydrological simulation approach is one growing method considering all these drawbacks, so it is encouraging to apply the hydrological simulation method for historical evaluation, complemented by the statistical analysis method.
3
Quantitative assessment impacts of future land use/cover and climate change on streamflow and sediment flow is continuation and further extension of historical changes analysis. Past studies of the impact of climate and land cover changes on streamflow and sediment load have been paid much attention worldwide. However, few published studies consider impacts of environmental changes on both streamflow and sediment load. Most studies have considered the impact of climate change and land cover change on streamflow (Middelkoop et al., 2001; Phan et al., 2011) or sediment yield itself (Leh et al., 2011; Wilson and Weng, 2011). Compared with streamflow, it is more complex and difficult to study changes of sediment yield, which is strongly affected by surficial materials, topography, rainfall seasonality, and land cover and can be increased by soil disturbance, which often occurs as the result of land use (Minella et al., 2009). Besides that, there was no agreement systemic research framework for quantitative assessment of double effects on streamflow and sediment load. Moreover, knowledge of the interface between land use-cover/climate, water and sediment yield required to undertake adaptation strategies is lacking worldwide. Consequently, more comprehensive and systemic research or project should be proposed for combined impacts of climate and land cover changes on both streamflow and sediment load, especially for sediment load.
1.3. Research objective
The general objective of this thesis is to develop of a framework for quantitative assessment of environmental changes on streamflow and sediment flow. The specific objectives of the study are as follows.
(1) To develop new sediment rating curve considering temporal vegetation cover changes.
(2) To develop model simulation method to quantitatively separate impacts on streamflow and sediment flow from climate change and human activities.
(3) To couple new sediment rating curve and ecological model to evaluate human-induced land cover change effect on sediment flow.
(4) To analyze the impact on streamflow and sediment flow under different future climatic change scenarios.
(5) To analyze the effect of potential future land cover change on streamflow and sediment flow based on land use change model.
4 1.4. Organization of the dissertation
This thesis is structured in seven chapters. The brief content and outline of these chapters is presented as follows:
Chapter 1: Introduction
This chapter discusses general information of climate and land use/cover change impacts on streamflow and sediment flow, motivation and necessity of the study, objectives of the research. In addition, the structure of the thesis is also presented. In this chapter, the organization of dissertation is presented to give the overview of the study.
Chapter 2: Literature review
This chapter summarizes the main relevant information and previous research results. They are presented in six topics, including: relationship among land/vegetation cover, climate, human activities related to streamflow and sediment yield; sediment flow calculation methods; separation of integrated impacts on historical streamflow and sediment yield, impact of future climate change on streamflow and sediment flow, impact of future land cover change on streamflow and sediment flow, combine impacts of climate and land use/cover change.
Chapter 3: Study area and general research framework
In this chapter, a description of the study area is firstly presented including the physical features and climate conditions. In addition, general framework of this research is discussed for the whole thesis, including model development, historical changes analysis and future changes evaluation.
Chapter 4: New sediment rating curve development and its validation in Asian river basins
In this chapter, new sediment rating curve which could describe the relationship among sediment yield, streamflow and vegetation cover, is developed for our following research. We will firstly check the shortage of common rating curve and find out the relationship between vegetation cover change and SSC in this study. Then new sediment rating curves will be carried out and validated in some other East-south Asian basins.
Chapter 5: Developing model simulation method to separate impacts from climate change and human activities on streamflow and sediment flow
In this chapter, quantification of climate change and human activities contributions to changes of historical streamflow and sediment load is partitioned and evaluated.
5
Firstly, the historical trend of hydro-meteorological data of our study area was calculated based on the Mann-Kendall test and Pettitt test in the past. Then, SWAT model is applied and evaluated in our research basin. Finally, the validated SWAT model and new sediment rating curve are proposed to calculate the individual effects of climate change and human activities on streamflow and sediment flow. Moreover, land cover change is determined as the main human activities in this area.
Chapter 6: Coupling new sediment rating curve and ecological model to evaluate human-induced vegetation cover change effect on sediment flow
In this chapter, one new approach to analyze effect of human-induced vegetation cover change on the historical sediment load is proposed, which cross validation with results of chapter 4. On purpose of this, time series NDVI from Global Inventory Modeling and Mapping Studies (GIMMS) is introduced to analyze the changing trend of vegetation cover in the past years. In addition, potential LAI is simulated by one ecosystem model to describe the potential vegetation cover condition without human activities effects. Based on the relationship between NDVI and LAI, they are then converted into standardized values. Finally, standardized NDVI and LAI are inputted into new sediment rating curve to evaluate vegetation cover change effect on sediment load.
Chapter 7: Analyzing the potential effect of future land cover and climate change on streamflow and sediment flow based on land use change model and GCMs
In this chapter, potential effects of future land cover and climate change on streamflow and sediment flow based on land use change model and GCMs are presented. Specifically, based on spatial physical and socioeconomic drive factors of the basin, future potential land cover map is calculated. In addition, future precipitation from two selected GCMs is downscaled to all stations by different methods. And then, both future land cover and future precipitation scenario are used to feed hydrological model. Finally, streamflow and sediment flow response to changes in land cover and climate are discussed.
Chapter 8: Summary of the study
This chapter summarizes the results and contributions of this study, and then gives suggestions for the future works.
7
CHAPTER II
LITERATURE REVIEW
2.1. IntroductionAs well known, streamflow, sediment yield are the integrated product of climate, geology, soil, land/vegetation cover, human activities and so on. Understanding the interactions between terrestrial ecosystems and hydrological system are fundamental in addressing issues of climate change and environmental degradation. However, quantifying these dynamic interactions both in space and time are compounded by challenges. Specifically, elucidating the impacts of land use/cover change and climate change at the basin scales on surface hydrology, water quality as well as sediment load are not straightforward but rather complex to warrant any generalizations. Subsequently, many insights into consequences of land use/cover and climate change on hydrology have been investigated at small spatial, observable scales. However, extrapolating findings from such small scales to larger scales such as river basins is confounded by the diversity of land use/cover and climate change as well as hydrological systems. Not only does the diversity in land use/cover and climate change complicate such a study, but also quantifying the effect of land use/cover and climate change on hydrology and sediment load have been considered as the difficult problem in hydrology.
In this chapter, previous researches related to the six specific objectives addressed in Chapter 1 have been reviewed. Relationships among land/vegetation cover, climate, and human activities related to streamflow and sediment yield, and relationship between streamflow and sediment yield are first reviewed. Followings this, models to estimate sediment yield of basin scale will be sorted out and analyzed. Based on these complex interactions, studies on impacts of land/vegetation cover change and climate change on streamflow and sediment yield will be listed and concluded from view of historical evaluation and future potential impacts. In addition, land use/cover change prediction methods to predict future land cover change are also reviewed in this Chapter.
2.2. Relationships among land/vegetation cover, climate, human activities related to streamflow and sediment yield
As well known, streamflow, sediment yield are the integrated product of climate, geology, soil, land/vegetation cover, human activities and so on. As a result, all these factors could be divided into input group (climate, geology, soil, land/vegetation cover,
8
human activities) and output group (streamflow, sediment yield). In order to evaluate impacts of climate change and land cover change on streamflow and sediment yield, making this interactive relationships among input group clearer appears necessary and indispensable, should be firstly investigated. Many studies have already carried out to investigate the interactive feedback among land/vegetation cover, climate and human activities.
2.2.1. Researches on relationship between climate change and land or vegetation cover
Climate change is a significant and lasting change in the statistical distribution of weather patterns over periods ranging from decades to millions of years. The climate exerts the dominant control on the spatial distribution of the major vegetation types on a global scale. In turn, vegetation cover affects climate via alteration of the physical characteristics of the land surface like albedo, roughness, water conductivity (biogeophysical mechanisms) and atmospheric gas composition, for example, CO2 and
CH4 (biogeochemical effects). Faced to this interrelation, most studies have been
conducted in different ways. One way to understand these feedbacks is coupled vegetation–climate model simulation. For example, Ziegler et al. (2003) made the strong case for a link between air mass dynamics, consequent climate patterns, and vegetation distribution, beginning with the Permian and advancing to the present day. Levis et al. (2004) applied the Community Climate System Model (CCSM2) with dynamic vegetation model to conclude that soil feedbacks, linked to surface albedo changes, contributed to the northward advance of the North African monsoon during the mid-Holocene. Based on the Fast Ocean Atmosphere Model–Lund Potsdam Jena (FOAM-LPJ), Gallimore et al. (2005) simulated a poleward expansion of boreal forest cover and an increase in midlatitude grasslands during the mid-Holocene, compared to simulated vegetation under modern orbital forcings. The expanded boreal forest, by masking snow cover, led to springtime warming through the albedo feedback. Another way is to apply observational data to determine the impact of vegetation feedbacks. Several researches made a conclusion that springtime leaf emergence initiates discontinuities in numerous meteorological variables (Schwartz 1996; Fitzjarrald et al. 2001), and McPherson et al. (2004) showed that Oklahoma‘s winter wheat belt locally induces feedbacks on temperature and moisture. In addition, with the help of a satellite-based normalized difference vegetation index (NDVI) and gridded temperature data, Kaufmann et al. (2003) quantified the effects of inter-annual variations in vegetation on temperature over North American and Eurasian forests. They concluded that increased NDVI over North America resulted in warming during winter and spring and cooling during summer and autumn. The impact on temperature was strongest during winter, when NDVI was negatively correlated with snow extent and weakly correlated with vegetation. Liu et al. (2006) estimated the magnitude of observed global vegetation feedbacks on temperature and precipitation. And results showed that in the northern mid and high latitudes, vegetation variability is
9
predominantly driven by temperature, while vegetation also exerts a strong positive feedback on temperature. They also concluded that, while most tropical and subtropical vegetation is driven by precipitation, the influence of vegetation on precipitation is not so strong globally, without any evidence of a dominant positive vegetation– precipitation feedback. Using high-resolution digital data and remote sensing dataset across a broad region with a pronounced climate gradient, Smith et al. (2013) developed empirical relationships between landscape morphology and vegetation cover with rainfall and runoff. In fact, the coupling between vegetation and climate is so strong that it has been utilized by scientists to assess climate change and identify changes in climate patterns (Dunne et al., 2004; Goldblum and Rigg, 2005).
2.2.2. Researches on relationship between human activities and land or vegetation cover
At the same time, human activities have also directly or indirectly affected land/vegetation cover in the world. On the one hand, human interference such as afforestation, deforestation, urbanization or farming activities will modify vegetation cover pattern. On the other hand, humans have greatly impacted the rates of supply of the major nutrients that constrain the productivity, composition, and diversity of terrestrial ecosystems (Taub, 2010). For instance, atmospheric CO2 concentrations
have been increased to about 40% above preindustrial levels (IPCC, 2007). Since 1700, land cover changes have been reported as being human-induced changes. Recently, David and Clarence (2001) concluded that anthropogenic changes in environmental limiting factors are likely to cause significant loss of plant diversity. Vescovi et al. (2002) proposed a new method combined Principal Component Analysis (PCA) and the vector analysis methods to identify and quantify the type of human-induced changes in savannah landscapes, which showed that human activities are important factors to lead to land cover changes. Chaudhry et al. (2008) analyzed that there is remarkable increase in urban area due to increasing population and Industrial/Infrastructural development pressure of National Capital.
2.2.3. Researches on separation impacts from climate change and human activities on land or vegetation cover change
Since land/vegetation cover change is caused by complex climate change and human activities, a major challenge hinges on how to distinguish between vegetation changes due to climatic variations and those caused by human land use activities on broad spatial scales. In particular, the impacts of human activities on vegetation dynamics can be extremely difficult to be separated out in the area where precipitation and vegetation cover show large variability (Buyantuyev and Wu 2009).
Faced to this challenge, researchers have already tried to conduct some studies based one satellite data like long time series of NDVI. Evans and Geerken (2004) presented a technique to discriminate between climate or human-induced dryland
10
degradation. In this research, the climate influence was firstly removed based on evaluations the relation between AVHRR NDVI data and rainfall data, then remaining changes in NDVI signal were attributed to human influence and those areas displaying a negative trend over time were considered degrading. Geerken and Ilaiwi (2004) also separated the different effects from climate change and human activities caused rangeland degradation in the Syrian Steppe. Wessels et al. (2007) applied Rain-Use Efficiency method and Residual Trends method to try to distinguish human-induced land degradation from the effects of rainfall variability. However, results showed that Rain-Use Efficiency method was not a reliable indicator of degradation, and the Residual Trends method also can only identify potential problem areas at a regional scale, while the cause of negative trends has to be determined by local investigations. Li et al. (2012) also demonstrated the Residual Trends method provided an effective tool to distinguish between the effects of climatic factors and human activities on vegetation changes when plant cover and production are highly coupled with precipitation, which indicated that land use policies played the main role to affect vegetation changes. Specifically, results showed that the grassland vegetation in the Xilingol region of Inner Mongolia deteriorated from the early 1980s to 2000 primarily because of increased livestock grazing, while the degrading trend in vegetation was reversed between 2000 and 2006 due to decreased stocking rates, which was attributable to several new land use policies geared toward grassland conservation and restoration.
As a conclusion, satellite data like long time series of NDVI plays an important role for separation impacts from climate change and human activities on land or vegetation cover change. Even though increasing efforts are being carried out to separate impacts from climate change and human activities on land or vegetation cover change, the applicability and effectiveness of above research method still need to be evaluated and, especially when used in different vegetation zones.
2.3. Relationship between streamflow and sediment yield
2.3.1. Researches on relationship between streamflow and sediment yield Steamflow is a function of water volume and velocity, which could affect water quality including suspended sediment in the stream. Stream velocity, which increases as the volume of the water in the stream increases, affects the amount of silt and sediment carried by the stream. Suspended sediment load is the particulate material that moves through the channel in the water column. These materials, mainly silt and sand, are kept in suspension by the upward flux of turbulence generated at the bed of the channel. Sediment particles could be physically carried by the stream current. Stronger the stream current, greater is the particle size (or mass) of the particle that can be carried, as well as the bedload. The upward stream currents must equal or exceed the particle fall-velocity (Figure 2.1) for suspended-sediment load to be sustained. The
11
upward stream currents velocity which is dependence of sediment flux on the force of flowing water is expressed as shear stress driving the turbulent flux supporting the suspension. As a result, sediment introduced to quiet, slow-flowing streams will settle quickly to the stream bottom. Fast moving streams will keep sediment suspended longer in the water column.
(http://www.sfu.ca/~hickin/RIVERS/Rivers4(Sediment%20transport).pdf)
Figure 2.1. Fall velocity in relation to diameter of a spherical grain of quartz
A sediment rating curve is always used to describe the average relation between streamflow and suspended sediment concentration (SSC) or sediment load for a certain location. Although there are some other methods for developing sediment rating curves (Phillips et al., 1999) and some other type of equations may also perform well (Walling, 1984; Hickin, 1989; Asselman, 2000; Horowitz, 2003; Schmidt and Morche, 2006), but the most common is a power function (regression) that relates SSC to Q (e.g. Walling, 1977; Crawford, 1996; Phillips et al., 1999; Asselman, 2000). Linear or second-order polynomial sediment rating curves, with and without a ‗smearing‘ correction could also calculate very good results for the annual or longer term suspended sediment fluxes (Horowitz et al., 2001). The most common sediment rating curve covers both the effect of increased stream power at higher discharge and the extent to which new sources of sediment become available in weather conditions that cause high discharge. Despite its general use several problems are recognized that regard the accuracy of the fitted curve as well as the physical meaning of its regression
12
coefficients. Unfortunately, the most common sediment rating curve is recognized that the common sediment rating curve method tends to under-predict high, and over-predict low suspended sediment concentrations (Asselman, 2000; Horowitz, 2003). In addition, it does not consider temporal dynamic changes of vegetation cover. However, different vegetation cover should have different effect on soil erosion production and transport capacity by slowing flow through friction losses (Howe et al., 2005). Consequently, one new sediment rating curve considering the effect of land/vegetation cover should be developed to calculate vegetation cover change effect on the sediment load.
Table 2.1. Sediment rating curves
Format Reference Walling, 1984 Hickin, 1989 Asselman, 2000 Horowitz, 2003; Schmidt and Morche, 2006
Walling, 1977; De Vries and Klavers, 1994; Gergov, 1996; Phillips et al., 1999; Asselman, 2000
Qmi: the median value of streamflow for the particular discharge class interval
Cmi: the concentration associated with Qmi estimated using the common rating relationship
Pci: the percentage of the high frequency discharge record associated with the particular flow class interval
TSL: total sediment load; Q: instantaneous streamflow SSC: suspended sediment concentration
a,b,c,d,e: different coefficients in equations
Even though the format of relationship could not be agreement with each other, the strong relationship does presents between streamflow and sediment flux.
2.3.2. Researches on models to estimate sediment yield of a basin
In general, all these models fall into three main categories: empirical or statistical, conceptual and physical-based models. The distinction between models is not sharp and therefore can be somewhat subjective. Merritt et al. (2003) summarized these models in terms of their classification, scales of application and input data requirements, and concluded that model components generally contain a mix of empirical, conceptual and physics-based algorithms. It is difficult to sort these models
13
exactly according to physical processes and model algorithms. They are likely to contain a mix of modules from each of these categories (Merritt et al., 2003). Because of this, we would like to classify all into models with more parameters and models with less parameter by amount of model parameters or input requirements.
Among models with more parameters, physical-based models accounts for the main part. This kind of model could be universally used to predict sediment yield of a watershed and to provide an indication of the qualitative and quantitative effects of land use changes or climate change. However, it is always very difficult to determine value of parameters especially at describing the complex process of erosion and sediment yield. Due to the requirement that parameter values are determined through calibration against observed data, these models tend to suffer from problems associated with the identifiability of their parameter values and non-uniqueness of ‗best fit‘ solutions (Jakeman and Hornberger, 1993; Beck et al., 1995; Merritt et al., 2003). In addition, models with more parameters generally require a lot of detailed information including hydrological, hydraulic and geological characteristics of the river basin, and as well as sediment characteristics itself. Preparation of such dataset will be difficult and costly.
As for models with less parameter, sediment rating curves (Asselman, 2000) represents a linear or nonlinear functional relationship relates suspended sediment concentration/load to streamflow are one main type. Among all sediment rating curves, one power functional relationship is most common one (Horowitz, 2003). Due to measuring the sediment flux on a river is a time-consuming and expensive operation, the sediment rating curve provide one considerable way to estimate sediment flux in the routine measurement of the flow in our rivers. As you might imagine, measuring the average suspended-sediment concentration in streamflow is no less time-consuming and expensive and for these same reasons we make considerable use of the suspended sediment rating curve. Unfortunately, it is recognized that the common sediment rating curve method tends to over-predict high, and under-predict low suspended sediment concentrations (Asselman, 2000; Horowitz, 2003). In addition, it is too simple without considering temporal dynamic changes of vegetation cover. However, different vegetation cover should have different effect on soil erosion production by modifying soil erodibility and transport capacity by slowing flow through friction losses (Howe et al., 2005).
Summarily, for basins without enough input data or no data, sediment rating curve provide one opportunity to evaluate sediment load. And on purpose of calculating land cover change effect on the sediment load, new sediment rating curve with few parameters considering the effect of vegetation cover should be developed (Wang and Ishidaira, 2013).
14
Table 2.2. Erosion/sediment transport models (Modified from Merritt et al., 2003)
Model Type Scale Input/output Reference AGNPS Conceptual Small
catchment
Input requirements: High Output: runoff volume; peak rate, SS, N, P, and COD
concentrations Young et al. (1987) ANSWER S Physical Small catchment
Input requirements: High Output:
sediment, nutrients Beasley et al. (1980) CREAMS Physical field 40–400
ha
Input requirements: High Output:
erosion; deposition Knisel (1980) EMSS Conceptual Catchment
Input requirements: Low Output: runoff, sediment loads, nitrogen loads and
phosphorus loads
Vertessey et al. (2001);Watson et al.
(2001) HSPF Conceptual Catchment
Input requirements: High Output: runoff, flow rate, sediment load, nutrient
concentration Johanson et al. (1980) IHACRES-WQ Empirical/C onceptual Catchment
Input requirements: Low Output: runoff, sediment and nutrients
Jakeman et al., 1990, Jakeman et al., 1994a
and Jakeman et al., 1994b,Dietrich et al.
(1999) IQQM Conceptual Catchment
Input requirements: Moderate Output: many pollutants including nutrients,
sediments, algae.
DLWC (1995)
LASCAM Conceptual Catchment Input requirements: High Output: runoff, sediment, salt fluxes
Viney and Sivalapan (1999) SWRRB Conceptual Catchment
Input requirements: High Output: streamflow, sediment, nutrient and
pesticide yields
USEPA (1994) GUEST Physical Plot Input: High Output: runoff; sediment
concentration
Yu et al. (1997); Rose et al. (1997) LISEM Physical Small
catchment
Input: High Output: runoff; sediment yield
Takken et al. (1999); De Roo and
Jetten (1999) PERFECT Physical Field Input: High Output: runoff, erosion, crop
yield Littleboy et al. (1992b) SEDNET Empirical/C
onceptual Catchment
Input requirements: Moderate Output: suspended sediment, relative contributions from overland flow, gully
and bank erosion processes
Prosser et al. (2001c)
TOPOG Physical Hillslope Input: High Output: water logging, erosion hazard, solute transport
Gutteridge Haskins and Davey (1991) USLE Empirical Hillslope Input: High Output: erosion Wischmeier and Smith
(1978) WEPP Physical Hillslope/
catchment
Input: High Output: runoff; sediment
characteristics; form of sediment loss Laflen et al. (1991) MIKE-11 Physical Catchment Input: High Output: sediment yield,
15
2.4. Studies on impacts of land/vegetation cover change and climate change on streamflow and sediment yield
Generally, impact assessment of land/vegetation cover change and climate change on streamflow and sediment flow should be studied from two perspectives, historical evaluation and future prediction. Historical insight into these effects can not only improve the knowledge of river processes, but also is precondition and foundation for analysis of future environmental changes impacts on streamflow and sediment load. Quantitative assessment impacts of future land use/cover and climate change on streamflow and sediment flow is continuation and further extension of historical changes analysis.
2.4.1. Studies on separation of integrated impacts on historical streamflow and sediment yield
The climate change factor and the human activities factor are interacted with each other to affect changes of streamflow and sediment yield. Since both climate change and human activities are the major controls of water balance and sediment yield in a catchment, research towards separation of their effects on streamflow and sediment yield has become one of the widespread issues of scientific concern. It is important to determine the main factors and their contributions to affect the changes of the streamflow and sediment yield to improve the sustainable development of water resources and provide ecological conservation measures.
Many studies have been conducted for this purpose in different ways. One traditional way is paired catchments experiment. Change of streamflow and sediment load among paired catchments are monitored to quantify sediment dynamics response to land cover change or climate change (Garcia-Ruiz et al., 2008). Although this approach is very useful in quantifying the impacts, it is quite costly, time-consuming, and it is difficult to find one reasonable paired catchment for most studies. In addition, most of these are carried out either based on statistical methods or hydrological models. However, their limitations are obvious: statistical methods lack a physical basis and studies based on hydrological models require considerable amount of information which, in many cases, may not be available. This is especially important in distributed hydrological models used to improve the accuracy of the separation. Among all exsited methods, one ―fixing–changing‖ method combined with the hydrological modelling was most popular one (Wang et al., 2009; Tang et al., 2011). For instance, a lumped hydrologic model (CHARM) and a distributed hydrologic model (SWAT) were used to model the impacts of both land-cover change and climate variation on river runoff during the past four decades in the upper reaches of the Yangtze River (Chen et al., 2005). The results showed that the contribution of climate variation to the change of runoff regime makes up 60%–80%, while that of land cover changes only 20%. Wang et al. (2009) applied distributed time-variant gain model (DTVGM) at the watershed
16
scale to quantitatively identify the impacts of climate changes and human activities on runoff in the Chaobai River Basin in North China. Comparing the annual precipitation means over 13 years (before 1980), the means of the second period (1980-2001) decreased by 5.4% and 4.9% in the Chao River and Bai River basins, respectively. However, the related annual runoff decreased by 40.3% and 52.8%, respectively, a much greater decline than exhibited by precipitation. Through the monthly model simulation and the fixing-changing method, it is determined that decreases in runoff between the two periods can be attributed to 35% (31%) from climate variations and 68% (70%) from human activities in the Chao River (Bai River). Thus, human impact exerted a dominant influence upon runoff decline in the Chaobai River basin compared to climate. Li et al. (2009) indicated that SWAT proved to be a powerful tool to simulate the effect of environmental change on surface hydrology. Results showed that both land use change and climate variability decreased runoff by 9.6% and 95.8%, respectively, and decreased soil water contents by 18.8% and 77.1%. Land use change increased evapotranspiration by 8.0% while climate variability decreased it by 103.0%. The climate variability influenced the surface hydrology more significantly than the land use change in the Heihe catchment during 1981–2000; therefore, the influence of climate variability should be considered and assessed separately when quantifying the hydrological effect of vegetation restoration in the Loess Plateau. Tang et al. (2011) presented a geomorphology-based non-point source pollution (GBNP) model for separation of land cover change and climate variability effects on streamflow and water quality, including sediment yield. On the basis of long-term simulation of the GBNP model, annual runoff presented a decreasing trend from 1980 to 2005, where precipitation and increase in air temperature were the dominant factors in runoff decrease. Afforestation, a water–soil conservation practice, positively affected the reduction of non-point source pollution; however, it also caused a reduction of streamflow. A comparison between 1980–1998 and 1999–2005 showed that land-use changes accounted for 6.6% and 9.2% of the decrease in streamflow and sediment load, respectively, while climate variability accounted for 93.1% and 91.3%. Khoi and Suetsugi (2012) also used SWAT model to separate impacts of climate and land-use changes on streamflow, sediment load, and water balance components in Be river basin of Vietnam. The hydrologic and sediment yield responses to land-use and climate changes were simulated based on the calibrated model. The results indicated that a 16.3% decrease in forest land was likely to increase streamflow (1.2%), sediment load (11.3 %). Climate change in the catchment leaded to decreases in streamflow (26.3%) and sediment load (31.7%). Furthermore, the results emphasized water scarcity during the dry season and increased soil erosion during the wet season. Gao et al. (2013) used double mass curve to detect impact of precipitation and human activity on streamflow and sediment discharge. Trends and change-points for streamflow and sediment discharge in the flood season in two major sub-catchments were firstly identified, and then based on the changing point the impacts of precipitation and human activities on the changes were analyzed. Results showed the average human activities contribution