(fig)
if}Zstva* 18 : 289-299, 1992key words : dental curriculurn - opinion suryey - basic science - clinical science
An Opinion Survey of the Dental Curriculum
at Matsumoto Dental College
HIROO MIYAZAWA and TAKAHIRO IMANISHI
DePartment of Pedodontics, Matsumoto Dental College (Chief : Prof T. Imanishi)
Summary
Recent dental curriculum consists of two columus, that is, basic science and clinical science in Japan.
However, we regard current dental curriculum as important to comprise cultural
sciences, social sciences and natural sciences under the present condition, such as the rapid
development of science technology, the progress of dental health care quality, and the
directivity of the community medical health care.
We regard current dental curriculum as necessary to reform and fill up to satisfy the
new academic development and social demand.
Therefore we made this opinion survey for the purpose to make characteristic to examine dental surriculum. (The object and method of the survey)
We selected 637 dental students in M. D. C. from the first grade to the sixth grade when students in finished clinical practice. Of 532 male students and 105 female students, opinion
survey on dental curriculum was made. (Result)
1. As for the occupation of dental students' parents, it is notified that "medical doctor" rank first (29.2%) and "dental doctor" rank second (24.20/o) and together they forrn 53
percent of the total, and "Company executives" rank third, and "self-employed" rank fourth.
Howerver "Office worker" form 7.4 percent of the total and "Govemment worker" form 4.2 percent.
2 . As for the motivation to become a dental doctor, it is notified that "advice of parent"
and "stabilization of livelihood" form about 70 percent of the total at the point of admission. After admission to school, "stabilization of livelihood" and "too much payment of school expenses" have a majority.
3. As for ideal dental doctor to be desired, it is notified that "dental doctor to be kind to the patients" rank first, and "dental doctor who has excellent technique" rank second.
4. As for cultural sciences in liberal arts, it is notified that the higher the school year, the
higher the percentage of the students who regard cultural sciences as necessary and
lmportant.
5 . As for linguistics, it is notified that about 90 percent of the students regard English as
most necessary, and about 50 percent of the students regard German as necessary.
6 . As for natural sciences, it is notified that the ratio of the students who deny to regard
"mathematics" and "physics" as necessary is high and the ratio of the students who regard "chemistry" and "biology" as necessary is high.
Introduction
The dental curriculum at Matsumoto Dental College has until recently been based upon two
pillars : basic science and clinical science. However, it is now considered important to incorporate into the dental curriculum humanities, social science and natural science, given the rapid develop-ment of scientific technology, the qualitative improvedevelop-ment of dental health care, and the increasing
attention to regional and community oriented medical care"6}.
We think it necessary to reform and improve the dental curriculum by actively taking up these topics in order to achieve the development of new areas of learning and better serve social needs. This opinion survey was conducted with for the purpose of utilizing its findings for the examination of future dental education.
Material and Method
As shown in Teble 1, this opinion survey was conduction a total of 637 students 532 males 83.50/o and 105 females 16.5% who are in their first to sixth school years at Matsumoto Dental
College.
Using the questionnaire shown in Table 2, the survey was conducted in November, 1989
following clinical study by the sixth year students. We sought data and opinions on such matters as"occupation of parents". "ideas about dentists" and "the curriculum now being offered at this college". Items of the questions are summurijed as follows. Out of 18 items, 2 question were concerned to liberal arts. "questions to basic science, 6 to clinical science, 3 to medical science, 1 to
preclinical practice, 2 to image of dentist.
Table 1: Object of the survey
unit:person (%)
Table 2: Item of questions
(multiplex) male female total
lst grade 2nd grade 3rd grade 4th grade 5th grade 6th grade
94
(80.3)95
(80.5)65
(77.4) 102 (82.3)75
(85.2) 101 (95.3)23
(19.7)23
(19.5)19
(22.6)22
(17.7)13
(14.8)5
(4.7) 117 (18.4) 118 (18.5)84
(13.2) 124 (19.5)88
(13.8) 106 (16.6) Liberal arts Basic science Clinical science Medical science Preclinical practice Image of dentist total 532 (83.5) 2 7 6 3 1 2 105 (16.5) 637 (100.0)ll[EJztsva* 18(3) 1992 291
Result and Discussion
1. Classified by the occupation of parents
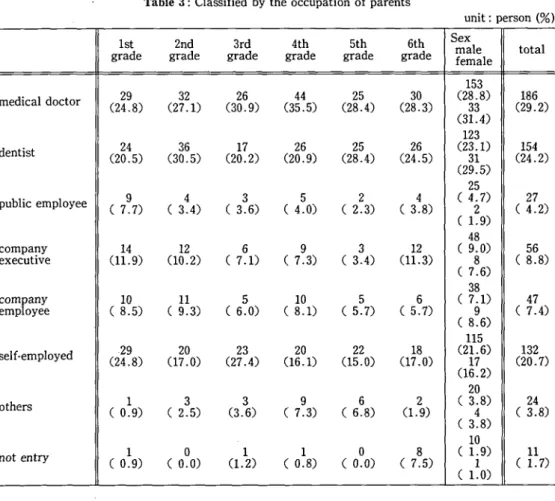
Table 3, show the ratio of occupation of the parents of the respondents. "Medical doctors"
ranked top with 29.2%, followed by "dentists" with 24.20/o , with both categories accounting for 53% of total. This percentage is believed to indicate a strong occupational linkage or motivation for children to follow in their parents' career. These occupations were followed by "the self-employed"
with 20.70/o "company executives" with 8.80/o, "company employees" with 7.40/o and "public employees" with 4.2%.
A similar tendency was also seen when classified by sex. The total percentage of those replying
that their parents were "medical doctors" or "dentists" was a high 610/o for female students,
apparently showing their parents' stronger desire to have their children pursue a similar profession. In this survey, 82.90/o of the parents of the respondents were judged large income earners on the basis of their occupations as "medical doctors", "dentists", "self-employed people" and "company executives." This higher percentage is believed to be attributable to the large financial burden for parents in sending their children to a private medical college typically costing some 400,OOe dollars in school expenses before graduation.
2. Reason to become dentist
Table 3 : Classified by the occupation of parents
unit: person (O/o)
1st grade 2nd grade 3rd grade 4th grade 5th grade 6th grade Sex male female total 153 rnedicaldoctor (24.8)29 (27.1)32 (30.9)26 (35.5)44 (28.4)25 (28.3)30 (28.8)33 (29.2)186 (31.4) 123 dentist 24 (20.5) 36 (30.5) 17 (20.2) 26 (20.9) 25 (28.4) 26 (24.5) (23.1) 31 154 (24.2) (29.5) 25 publicemployee ( 97.7) 4(3.4) 3(3.6) ( 54.0) 2(2.3) 4(3.8) (4.7)2 (4.2)27 (1.9) 48 cornpany 14 12 6 9 3 12 (9.0) 56 .executlve (11.9) (10.2) (7.1) ( 7.3) (3.4) (11.3) 8 (8.8) (7.6) 38
company
10 11 5 10 5 6 (7.1) 47 employee ( 8.5) (9.3) (6.0) ( 8.1) (5.7) (5.7) 9 (7.4) (8.6) 115 seif-employed .29 (24.8) 20 (17.0) 23 (27.4) (16.1)20 (15.0)22 18 (17.0) (21.6) 17 132 (20.7) (16.2) 20 others ( 1O.9) 3(2.5) 3(3.6) ( 97.3) 6(6.8) 2(1.9) (3.8)4 (3.8)24 (3.8)notentry ( 1O.9) o(o.o)
'1(1.2) ( 1O.8) o(o.o) 8(7.5) 10 (1.9) 1 11 (1.7) (1.0)
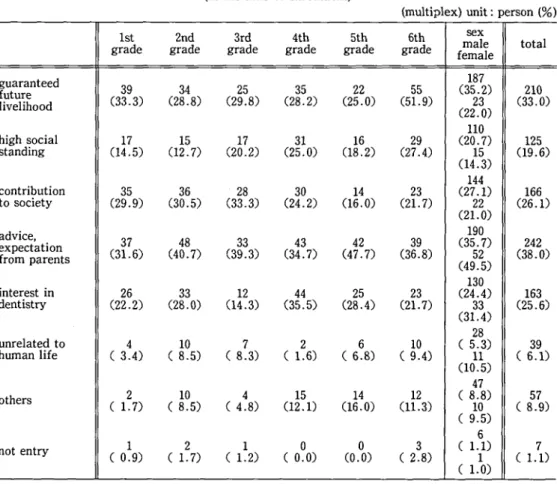
Table 4, show the percentage of replies to the question about "reasons for aspiring to become dentists at the time of enrollment".
38% of the respondents, the largest single group, cited "advice or expectation from parents" as the reason ; followed by "future livelihood will be guaranteed" with 330/o ; "contribution to society" with 26.1% ; and "interest in dentistry" with 25.6%.
By sex, about 50% of female students cited "advice from parents", showing a marked difference
in opinion between male and female students. Female students replying "future livelihood is
guaranteed" aecounted for only 220/o as against 35.20/o of the male students. One major reason for this phenomenon is believed to be the fact that female students are less enthusiastic about
support-ing themselves, as many Japanese women have to be retired after marriage.
As the reason for aspiring to become dentists, 31.4% of the female tsudents cited "interest in dentistry" as against only 24.40/o of male students. By school year, the iargest portion of students in their second to fifth school years cited "advice from parents, "but first and sixth year students tended more to cite "future Iivelihood will be guaranteed". Most notably, 51.9% of the sixth year students cited this reason.
3. Reason to become dentist after admission
This concerns "the reasons for aspiring to beceme dentists cited after admission to college.
Table 4 : Reason to become dentist (at the time of enrollment)
(multiplex) unit : person (O/o)
lst grade 2nd grade 3rd grade 4th grade 5th grade 6th grade sex male female total guaranteed future livelihood 39 (33.3) 34 (28.8) 25 (29.8) 35 (28.2) 22 (25.0) 55 (51.9) 187 (35.2) 23 (22.0) 210 (33.0) 110 highsocial 17 15 17 31 16 29 (20.7) 125 standing (14.5) (12.7) (20.2) (25.0) (18.2) (27.4) 15 (19.6) (14.3) 144 contribution 35 36 28 30 14 23 (27.1) 166 .tosoclety (29.9) (30.5) (33.3) (24.2) (16.0) (21.7) 22 (26.1) (21.0) advice,.expectatlon fromparents 37 (31.6) 48 (40.7) 33 (39.3) 43 (34.7) 42 (47.7) 39 (36.8) 190 (35.7) 52 (49.5) 242 (38.0) 130 interestin 26 33 12 44 25 23 (24.4) 163 dentistry (22.2) (28.0) (14.3) (35.5) (28.4) (21.7) 33 (25.6) (31.4) 28 unrelatedto 4 10 7 2 6 10 (5.3) 39 humanlife (3.4) (8.5) (8.3) (1.6) (6.8) (9.4) 11 (6.1) (10.5) 47 others 2(1.7) 10 (8.5) 4(4.8) 15 (12.1) 14 (16.0) 12 (11.3) (8.8)10 57 (8.9) (9.5)
notentry 1(O.9) 2(1.7) 1(1.2) o(o.o) o(o.o) 3(2.8) 7(Ll)
k[}Jzlide"+!` 18(3) 1992 293
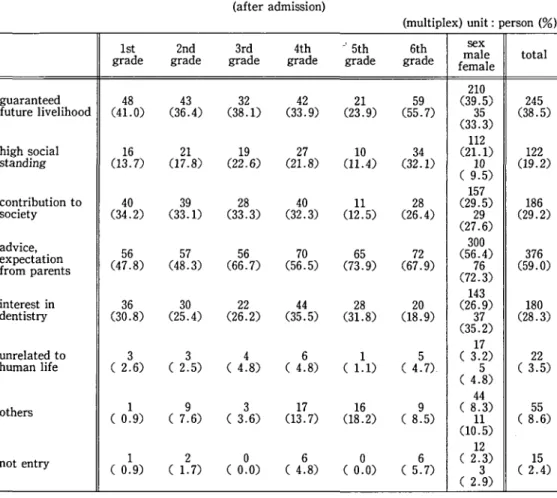
The largest portion, 38.5%of the respondents, cited "future livelihood is guaranteed" ; followed by desire to get a retum on previous investment for education with 35.6% ; "contribution to society" with 29.2% ; "interest in dentistry" with 28.30/o ; and "advice from parents" with 23.4%.
When these ratios are compared with those at the time of enrollment, the percentage of "advice from parents" declined sharply, while that of students citing "contribution to society" and "interest in dentistry" increased. This is believed to indicate students' increasing self-awakening to their future occupation.
When this matter is examined by school years, the percentage of students in their fifth or earlier years who cited "future livelihood is guaranteed" showed a tendency to increase during the period between the time of enrollment and the present.
A similar trend was also seen in students in their fourth or earlier school years for the reason of "contribution to society." A decrease in the relevant percentage seen in fifth year students is believed to reflect their apparent increasing unrest as they neared clinical study.
The percentage of those replying "interest in dentistry" showed signs of increasing among
students in their first to fifth school years, but decreased among sixth year students. We believe this phenomenon indicates that the sixth year students felt relieved as their clinical study was over, apparently increasing their optimism regarding dentistry. One wonders in this connection if these
j
Table 5: Reason to become dentist
(after admission)
(multiplex) unit : person (O/o)
lst grade grade2nd 3rd grade 4th grade :-5th grade 6th grade sex male female total 210 guaranteed 48 43 32 42 21 59 (39.5) 245 futurelivelihood (41.0) (36.4) (38.1) (33.9) (23.9) (55.7) 35 (38.5) (33.3) 112 highsocial 16 21 19 27 10 34 (21.1) 122 standing (13.7) (17.8) (22.6) (21.8) (11.4) (32.1) 10 (19.2) (9.5) 157 contributionto 40 39 28 40 11 28 (29.5) 186 -soclety (34.2) (33.1) (33.3) (32.3) (12.5) (26.4) 29 (29.2) (27.6) advice,.expectatlon fromparents 56 (47.8) 57 (48.3) 56 (66.7) 70 (56.5) 65 (73.9) 72 (67.9) 300 (56.4) 76 (72.3) 376 (59.0) 143 interestin 36 30 22 44 28 20 (26.9) 180 dentistry (30.8) (25.4) (26.2) (35.5) (31.8) (18.9) 37 (28.3) (35.2) 17 unrelatedto 3 3 4 6 1 5 (3.2) 22 humanlife (2.6) (2.5) (4.8) (4.8) (1.1) (4.7). 5 (3.5) (4.8) 44 others 1(O.9) 9(7.6) 3(3.6) 17 (13.7) 16 (18.2) 9(8.5) (8.3) 11 55 (8.6) (10.5) 12
notentry 1(O.9) 2(1.7) o(o.o) 6(4.8) o(o.o) 6(5.7) (2.3)3 (2.4)15 (2.9)
students might have grown more interested in dentistry following clinical study.
The percentage of students saying they want a return on their education showed a tendency to increase as their school years advanced. This is believed to indicate that many of them were
enrolled at the college without seriously considering the matter of whether dentistry would be a suitable profession, and are now studying to become dentists for the reason that so much money is being spent on their education. (Table 5)
4. Ideal dentist
Table 6 show replies to the question about "ideal dentist". The largest portion (72.1% of the respondents) replied "dentists who are very kind to patients", followed by "reliable dentists" with 60.60%, and "dentists with superior skills" with 50.2906o. Those who replied "dentists studying hard"
accounted for 24.8% and those saying "dentists who do not work for profit" accounted for 17.4%.
By sex, there were notable differences between male and female students in the ratios of the replies "dentists with superior skills", "reliable dentists" and "dentists studying superior skills", "reliable dentists" and "dentists studying hard". In each of the reply items, the percentage of female
students was higher than that of male students, suggesting that females have a higher level of consciousness about the dental occupation than do males.
5. Types of dentist want to be 'in the future
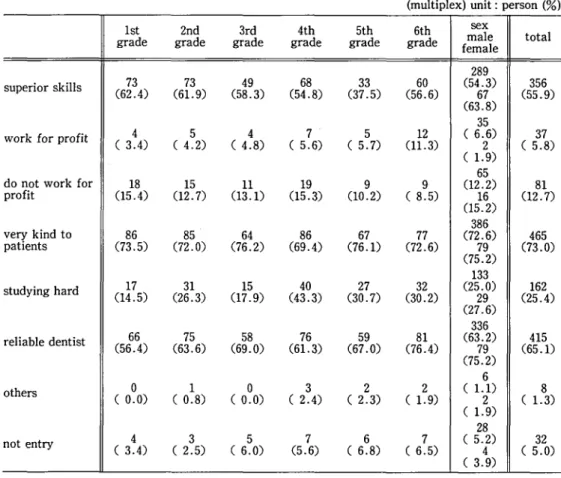
Table 7 show the ratio of replies to the question of what types of dentists the respondents want to be in the future, irrespective of their ideals about the matter.
The largest portion, (73.00/o of the respondents), cited "dentists who are•kind to patients,
"followed by "reliable dentists" with 65.1% and "dentists with superior skills" with 55.9% The
replies came in the same order as those cited in the case of ideal dentists, and the percentage of the relevant replies shows signs of increasing.
Table 6: Ideal dentist
(multiplex) unit : person (%)
1st grade 2nd grade 3rd grade 4th grade 5th grade 6th grade sex male female total 255 superiorskills 57 (48.7) 69 (58.5) 48 (57.1) 58 (46.8) 33 (37.5) (51.8)55 (47.9) 65 320 (50.2) (61.9) 89
donotworkfor
22 17 17 18 18 19 (16.7) 111 profit (18.8) (14.4) (20.2) (14.5) (20.5) (17.9) 22 (17.4) (21.0) 382verykindto
83 87 64 89 64 72 (71.8) 459 .patlents (70.9) (73.7) (76.2) (71.8) (72.7) (67.9) 77 (72.1) (73.3) 123 studyinghard 13 (11.1) 30 (25.4) 20 (23.8) 40 (32.3) 31 (35.2) 24 (22.6) (23.1) 35 158 (24.8) (33.3) 309 reliabledentist 64 (54.7) 71 (60.2) 53 (63.1) 73 (58.9) 54 (61.4) 71 (67.0) (58.1) 77 386 (60.6) (73.3) 13notentry o(o.o) 1(O.8) o(o.o) 3(2.4) 4(4.5) 5(4.7) (2.5)o (2.1)13 (o.o)
ig[}J!tsdvRt]i!L4 18(3) 1992 295
The percentage of those citing ttdentists studying hard" remains almost the same, but that of these citing 'tdentists who do not work for profit" shows a decrease.
When we compare these ratios to the replies about {tideal dentists," the percentage of those
citing {tdentists who are kind to patients" shows increases in the first, fifth and sixth year students, and either decreases or levels off in second through fourth year students.
The ratio of those citing {'dentists with superior skills" levels off in among fifth year students, but increases in students of other school years. For the item "reliable dentists," the ratio of students citing this reply increases in students of all school years.
For the item of ttdentists studying hard", the percentage shows an increase among first, second
and 6th year students, with that of six year students showing a marked increase. For the item
ttdentists who do not work for profit", the percentage decreases among students in the fourth or
earlier school years, and the relevant percentage falls to nearly one-half among fifth and sixth years students, apparently showing a gap between the ideal and reality.
6. Humanity subjects
Table 8 show the ratio of those replying in the affirmative to the question about the necessity of offering the humanities subjects of philosophy, ethics and literature at this college.
Regarding the necessity for philosophy and literature, those replying in the affirmative account-ed for less than 30%, while 37.4% of students repliaccount-ed the same about t'ethics."
Table 7: Types of dentists want to be in the future (multiplex) unit : person (O/o)
1st grade grade2nd 3rd grade 4th grade 5th grade 6th grade sex male female total superiorskills workforprofit
donotworkfor
profit verykindto' patlents studyinghard reliabledentist others notentry 73 (62.4) 73 (61.9) 49 (58.3) 68 (54.8) 33 (37.5) 60 (56.6) 12 (11.3) 289 (54.3) 67 (63.8) 35 (6.6) 356 (55.9) 37 (5.8) 81 (12.7) 465 (73.0) 162 (25.4) 415 (65.1) 8(1.3)32(5.0)296 Miyazawa and I manis
Table. 8 : Humanity subject
lum unit: person(O/o)
lst2nd3rd
gradegradegrade
4th grade 5th grade 6th grade total philosophy ethics(18.8)(27.1)(19.0)
(28.2)(39.0)(44.1)
(23.9)(24.6)(25.0)
34 (27.4) 48 (38.7) 37 (29.8) 24 (27.3) 31 (35.2) 29 (33.0) 36 (34.0) 43 (40.6) 43 (4O.6) 164 (25.7) 238 (37.4) 187 (29.4)Table. 9: Social sciences
unit: person(%) lst grade 2nd grade 3rd grade 4th grade 5th grade 6th grade total .economlcs psychology 55 (47.0) 66 (56.4) 40 (33.9) 76 .(64.4) 36 (42.9) 55 (65.5) 62 (50.0) 93 (75.0) 49 (55.7) 59 (67.0) 54 (50.9) 66 (62.3) 296 (46.5) 415 (65.1)
Table. 10: Language study
unit: person(%) lst grade 2nd grade 3rd grade
gradegrade
4th5th
6th grade total EnglishGerman
101 (86.3) 72 (61.6) 102 (86.5) 48 (4O.7) 72 (85.7) 42 (50.0)10874
(87.1)(84.1)
6437
(51.6)(42.1)
99 (93.4) 55 (51.9) 556 (87.3) 318 (49.9)Table. 11 : Natural sclences
unit: person(%) lst grade 2nd grade 3rd grade 4th grade 5th grade 6th grade total mathematics physics chemistry biology 37 (31.6) 46 (39.3) 76 (65.0) 110 (94.0) 42 (35.6) 61 (51.7) 93 (78.8) 109 (92.4) 35 (41.6) 44 (52.4) 63 (75.0) 74 (88.0) 64 (51.6) 69 (55.7) 94 (75.8) 110 (88.7) 40 (45.4) 44 (50.0) 69 (78.4) 78 (88.6) 50 (47.2) 60 (56.6) 89 (84.0) 94 (88.7) 268 (42.1) 324 (50.8) 484 (76.0) 575 (90.3)
Table. 12: History an d comprehensive dentistry
unit: person(%) lst grade 2nd grade 3rd grade
gradegrade
4th5th
6th grade total comprehensive 99 657356
50 343 dentistry dental (83.9) 58 (77.4) 47(58.9)(63.6)
4840
(47.2)27 (66.0) 220 history (49.2) (56.0)(38.7)(45.5)
(25.5) (42.3)taztsva\ 18(3) 1992 297
By school years, the ratio of students admitting the necessity of philosophy and literature shows shows an increasing trend as their school years advance.
7. Social sciences
Table 9 show the ratio of those replying in the affirmative about the necessity for the social
sciences of economics and psychology.
46.50/o of students admitted the necessity for economics, and 65.10/o of students for psychology.
There were no marked differences by school years, showing roughly similar ratios.
Subjects of study such as psychology, philosophy and ethics are clearly necessary for dentists in both their clinical and spiritual aspects. However, it is regrettable that the ratio of students admitting the necessity for these subjects is relatively low. This phenomenon may be related to the contents of curricula themselves.
8. Language study
This concems the necessity of offering the subjects of English and German. (Table 10)
87.3% of students consider English necessary. By school years, 93.4% of the sixth year students admit the necessity for English. However, students' academic ability in English is relatively low. Indeed, many of them are unable to carry on a reasonable English conversation even in the area of technical terms for dentistry.
The percentage of students seeing the necessity for German is lower than that of students
favoring English, standing at about 500/o. By school years, 61.6% of the fist years students admit the necessity for German, showing the highest rate of affirmative replies among all the respondents. The students are not required to study German at this college, and they need to have no knowledge
whatsoever about German dentistry terms.
9. Natural science.
Table 10 concerns the necessity for offering the subjects of mathematics, physics, chemistry and biology. 42.1% of students see the necessity for mathematics, and 50.8% of the pollees for physics. These figures are relatively low compared with 76.0%o for chemistry and 90.3% for biology. By school years, the percentage of first year students replying in the affirmative for mathemat-ics, physics and chemistry is lower than that of students in other school years. The lower percentage
for these subjects among first year students may indicate the students' idea that such subjects
constitute merely an extension of study at senior high schools. The percentage of fist and second year students seeing the necessity for biology is higher than that of students in other school years.
10. History and comprehensive dentistry
This concerns the necessity for having students study ttdental history" and "comprehensive
dentistry." (Table 12)
66% of the students consider comprehensive dentistry necessary. The ratio of students replying in the affirmative shows signs of decreasing as school years advance. Less than 50% of the students and only 25.5% of the sixth year students see the necessity of dental history study.
This phenomenon may be attributed to the possibility that what the students expect from these subjects has not yet been clarified, and that the contents of lectures do not meet their expectations.
We feel it necessary to improve this situation and offer education from the standpoint of
developing character as the fist step for training good dentists.
Conclusions
findings obtained.
1. As for the occupation of the parents of the students, C'medical doctors" and "dentists" account for 53% of the total, with the former standing at 29.2% and the latter at 24.2%. They are followed
by "self-employed persons" and t'company executives." The ratio for ttcompany employees" stands
at 7.4% and tCpublic employees" at 4.2%. The generally high-income occupations of parents reflect the large financial burden for school expenses.
2. As for the motives for becoming dentists, about 70% of students cited t'advice from parents" and "future livelihood is guaranteed" at the time of their enrollment. After their admission to the college, however, a greater portion of the students cited ttfuture livelihood is guaranteed" and
Ctdesire for a return on educational investment."
3. As for the question about ideal dentists, a majority of students replied, "dentists who are kind of patients" and C'dentists with superior skills."
4. Regarding the question of offering humanities subjects in the basic course of study, a growing
percentage of students attach importance to the necessity of humanities as their school years advance.
5. As for language study, about 90% of the students attach importance to the necessity of
English, while about 50% of the respondents see the necessity of German.
6. Regarding natural science, the percentage of those replying negatively on mathematics and physics is high among students in all school years, whereas that of students recognizing the necessity for chemistry and biology is relatively high.
References
1) Yamaguchi, T., Himuro, T., Nishiguchi, S., and Ohara, H. Åq1990) Study on evatuation of educational
effects in predoctoral clinic. JJDE, 5 : 73--41.
2 ) Jacobs, R. M. (1988) Ten-year study of stralegies for teaching clinical interence in prdoctoral education,
J. Dent. Educ. 52: 235-244.
3 ) Ishikawa, T. (1989) Post graduate educational system in clinical dentistry. JJDE, 4: 42--43. 4 ) Hosoda, H. (1989) Post graduate educational system in clinical dentistry. JJDE, 4 : 44-45.
5 ) Sato, H., Harano, K and Totoki, T (1990). Introduction of curriculum evaluation by student. Medical Education (Japan), 21 : 100-103.
6 ) Okamura, K., Ohotaki, J., Hoshino, M., Kobayashi, M., Ochi, G., Orii, K., Itakura, M. and Yamashita, K. (1991) Investigation of effect of the rotation curriculum in early postgraduate pariod on subsequent
clinical work. Medical Education (Japan), 22 : 41-46.
trssen : Zs :Mi t:s tt 6 en4E:kii":ljEokncftE
giRmsill, Adi$re (tE} zXtsJk • ,SxSH.tsP})
ts FtEL'iii't- ut fi eX basic science t clinical science, `D 2 ") cD el V= X b fi tsbj}"L '( Ls6. U bi L, ,&. g taFl# SitrJ cEÅrme25, as 6 v s "ltsiB}Etw Vytzz'":+ {D Hts ffi] L, commuity iggag L L teASItw eeasvhN cD tts zz L L N " )
k )rk 2' FL cD pP '(}, dw Fl za =pt]L va E eX .A.] Pt e}E Je] 2ti Si FEt]!L` tg E l}t E ts L tc # fi pt pt9 'zE" b 6 .
gZ6Vl, gnLLN=n]i-LF.BeeMcDre{l6•.] Ue3ikEEJetiil 5tmak-t-M•(•,• in.6ai -)vN-(Maje9VcllitD1 ZF, ssFteeE+XigEltdrwt L]EscXe, %em t LÅqof.P.H&ff ig ges t L-(, 7Xn+gVcama=]z-g-6 1 E+Xl#bi6 6 =niYL
t4i 5t*SXe=k.E E E iz77tr - b vcX O sctsLfiLorpt-atLLIToreMltete.
1. geOwa\Åq•Vt, reeemJ 29.2% rts$i}eeemJ 24.20/.t2ts0530/.ftfitsl), J}kT reAsi-XJ rkHiU
2 3 4 5
ifElta\ 18(3) 1992 299
b2ttc.
. caPFeeemlirfi.k.-;-Yecizi-,LN-(et, .JK\ee-("et, rge6DththJ [!kva6DesaJ h:ts70%EtfiZL, .IS.}=4
pa -C• ig ra st Vc K. L,stec -(. th .,, la
. ge es Bl g cD .A. }kiBl*.k\F} ve -D v s 'c e# {l]Etl#hS"ft' Åq t 6 vcft L N, E cD tXiee tr 5t$M'l- 6 *!k cD gU ft hSagh"-3- 6 ta M h;M..th 6 2zk.
. ge.\.k-(•e#1, rptgi.1 tze-)VN-(, (O,j25sttrltptbl-g-6,L3} L!4{kh;fo90O/.2 N. Åq rF' -t ),S,ii.j b:-)LN-C e:, ts500/ocD\tiith:ecDpt9tr5rmal;'(Lste.
. fi pt. liit*;iii -(f et, rX\J rim mp*J VC -) L s -C 2S-*tEli ilt3 ec • t cD iLiZs ee tr 5r as re -9- 6 * ttl oD ZU B- h: -ftL Åq