1
学位論文 博士(医学)甲
Regulation of micturition reflex by
neural activity in the anterior cingulate
cortex
(前帯状皮質による排尿反射の制御)
望月 孝規
山梨大学
2
Table of contents
Abbreviations
3
Abstract
4
Introduction
5
Materials and Methods
8
Results
15
Discussion
40
Acknowledgments 51
References 52
3
Abbreviations
AAV
adeno-associated virus
ACC
anterior cingulate cortex
BP
basal bladder pressure
CC cingulate cortex
ChR2
channelrhodopsin-2
CMG
cystometrogram
CTB cholera toxin subunit B
CPu caudate putamen (striatum)
ec external capsule
EW Edinger-Westphal nucleus
HIP hippocampus
ICI
intercontraction interval
LH lateral hypothalamic area
LUT lower urinary tract
PAG
periaqueductal gray matter
PBS
phosphate buffered saline
PFA
paraformaldehyde
PMC
pontine micturition center
PSTH
peristimulus time histogram
PTX
picrotoxin
PV
parvalbumin
RMC red nucleus, magnocellular part
Thy1 thymus cell antigen1
TP
threshold bladder pressure
4
Abstract
Patients with traumatic brain injury and stroke tend to have trouble with lower urinary tract (LUT) function, which caused LUT symptoms such as urinary frequency. Previous studies have shown that several brain areas are considered to be involved in the regulation of LUT function, including the periaqueductal gray matter (PAG), the pontine micturition center (PMC), and the anterior cingulate cortex (ACC). Although the role of PAG and PMC in LUT function has been extensively studied, the contribution of ACC to LUT function is still controversial and its underlying mechanisms remain largely unclear. The purpose of this study is to elucidate the neuronal mechanisms of how ACC controls micturition reflex in LUT function. I first examined the neuronal pathways between ACC and the bladder by using a transsynaptic neuro tracer and found the descending pathway from a subset of neurons in ACC to the bladder. Next, electrical stimulation and pharmacological manipulation of ACC revealed that activation of ACC neurons could induce contraction of the bladder. Furthermore, selective activation of layer 5 pyramidal neurons and parvalbumin (PV) positive interneurons in ACC by using optogenetics induced and suppressed micturition, respectively. These results suggest that ACC plays a crucial role in the initiation of micturition and that the balance of excitation and inhibition in ACC may regulate micturition reflex.
5
Introduction
Lower urinary tract (LUT) function has been known to be controlled by the brain, which has been initially demonstrated in a lesion study using cats by Barrington. The identified region in brainstem was named as Barrington’s nucleus or pontine micturition center (PMC) [1]. Pharmacological studies have shown that application of glutamate, carbachol, acetylcholine, noradrenaline, naloxone, or bicuculine to PMC induces bladder contraction [2-4]. On the other hand, application of opioids such as fentanyl or leucine-enkephalin has been shown to have opposite effects[5, 6]. Recently, it has been shown that direct activation of corticotropin releasing hormone (CRH)-positive neurons in PMC by optogenetics induces micturition [7]. All these studies suggest that PMC acts as an on/off switch for the induction of micturition reflex and plays a critical role for promoting micturition. Given that PMC is reciprocally connected with the periaqueductal gray matter (PAG) [8, 9], coordinated action of PMC and PAG is presumed to be important for regulation of LUT function. In particular, dorsolateral and ventrolateral PAG are involved in micturition [10]. Electrical stimulation of these regions induces bladder contraction [11]. Local administration of glutamate to PAG induces bladder contractions[12], whereas application of GABA or opioid produced a reduction in the frequency of reflex contractions [13, 14]. Therefore, PAG plays similar role as PMC for micturition reflex and functions of both regions have been studied in detail at molecular level. Furthermore, PAG interconnects with the anterior cingulate cortex (ACC), amygdala, and insular cortex. Thus, these brain regions are also considered to have significant role in LUT function [15]. However, their functions for urinary continence remain elusive.
6
Retrospective observational studies on brain disorder patients [16] or human brain imaging studies [17] have shown that several brain areas have been speculated to be involved in LUT function [18]. Patients of stroke and brain hemorrhage at brainstem showed high rate (49%) of urinary disturbance [19]. This result was consistent with animal studies[1]. In contrast, lesions in frontal cortex often resulted in urine storage disorder such as urinary frequency or urinary urgency (68% of cases) [20] , indicating that the prefrontal cortex is believed to have suppressive effects for micturition reflex. Furthermore, recent functional brain imaging studies using fMRI and PET have shown that multiple brain regions including PMC, PAG, ACC, thalamic nuclei, the insular cortex and the prefrontal cortex are activated during micturition [21]. In addition, optogenetic stimulation in mice revealed that a part of the primary motor area (M1) is also involved in micturition[22] . Among the areas related to LUT function, ACC is the most enigmatic. Human brain imaging studies reported that ACC was activated during storage phase[23], whereas, activation of ACC during voiding phase of micturition [24] or storage phase in patients of overactive bladder[25] were also reported. Therefore, it is still controversial whether ACC is activated during storage phase or micturition phase. Although a study showed that electrical stimulation to ACC in rat reduced the frequency of micturition[26] , the underlying neuronal mechanisms for regulation of micturition reflex by ACC is totally unknown.
In this study, I first identified descending pathway from ACC to the bladder by using retrograde transsynaptic tracing methods. Next, I performed electrical stimulation and pharmacological manipulation of the neuronal activity in ACC to
7
confirm whether the activity of ACC induces or suppresses micturition reflex. Finally, I employed more direct approach using optogenetics to specifically manipulate the activity of excitatory or inhibitory neurons in ACC and investigated their contribution to micturition reflex.
8
Materials and Methods
All animal experiments were performed in accordance with the national and institutional guidelines and approved by the Animal Experiment Committees of University of Yamanashi (#A27-1).
Mice
Adult female wild-type (WT) C57BL6 mice (Japan SLC, Shizuoka, Japan; n = 25), Thy1-ChR2-EYFP mice ([27]; n = 36) and PV-Cre mice ([28]; n = 6) at 8–10 postnatal weeks were used in this study. The mice were housed in a 12h/12h light-dark cycle. Food and water were provided ad libitum.
Virus injection
Mice were anesthetized with isoflurane (2.5% for induction; 1.5–2% for maintenance). Mice were held by a stereotaxic apparatus (Narishige, Tokyo, Japan). The skull over ACC was exposed. A small hole (0.2–0.5 mm in diameter, centered at 0.5 mm rostral to bregma, and 0.2 mm lateral from midline) was made for insertion of a glass pipette by using a dental drill. A pulled glass pipette was beveled to an outer diameter of 70 µm and loaded with a virus solution. Adeno-associated virus (100 nL; AAV2/1-CaMK2a-hChR2(H134R)-EYFP (addgene, Watertown, MA, #26969) or AAV2/1-EF1a-double floxed-hChR2(H134R)-EYFP-WPRE-HGHpA (addgene #20298); not diluted from original stock with ≥ 1×10¹³
µg/mL) was injected directly into ACC at a rate of 20 nL/min. The axis of the pipette was angled at 20° from the vertical axis and advanced by 1.2 mm from the pia along the axis of the pipette. After the injection, the pipette was kept in
9
place for 5 min. After the surgery, mice were singly housed and allowed to recover for 14-21 days. Abnormal behavior was not observed after AAV injections.
WGA injection into Bladder and histology
Wheat germ agglutinin (WGA)-Alexa633 (Invitrogen, Carlsbad, CA) was diluted to 1.0 mg/mL with distilled water as a stock solution. The stock solution was further diluted to 10 μg/mL for injection [29]. Mice were anesthetized with 1.5–2% isoflurane, and we performed low abdominal midline incision and the bladder was exposed. The bladder was held by holding the median umbilical ligament with forceps. A glass pipette was lowered into the bladder and 100 µL of WGA-Alexa633 was injected into the posterior and bilateral wall [30]. After injection, the pipette was left in place for 5 min and retracted slowly [7]. After the procedure, the incision line was closed with 5-0 silk. Five days after injection, mice were transcardially perfused with 4% paraformaldehyde (PFA) in phosphate-buffered saline (PBS) under deep isoflurane anesthesia. Brains were removed and fixed in 4% PFA at 4°C for 1 day. Sagittal or coronal sections of 50–100 µm thickness were obtained using a microslicer (VT1000S, Leica Camera AG, Wetzlar, Germany) [31]. Fluorescence images were taken with a fluorescence microscope (BZ-9000, Keyence,Osaka, Japan.).
CTB injection into PAG and histology
Cholera toxin B subunit (CTB)-Alexa594 (Invitrogen) was diluted to 10 μg/µL with distilled water as a stock solution. Mice were anesthetized with 1.5–2% isoflurane and a small hole was drilled for insertion of a glass pipette (3.0 mm
10
caudal to bregma, 0.2 mm lateral from midline). A pulled glass pipette (beveled to an outer diameter of 50 µm) was filled with a CTB solution. CTB-Alexa594 was injected directly into PAG at a rate of 20 nL/min. The axis of the pipette was angled at 20° from the vertical axis and advanced by 2.5 mm from the pia along the axis of the pipette. After the injection, the pipette was kept in place for 5 min. After the surgery, mice were singly housed and allowed to recover for 3–5 days. Abnormal behavior was not observed. Five days after injection, mice were transcardially perfused with 4% PFA in PBS under deep isoflurane anesthesia. Brains were removed and fixed in 4% PFA at 4°C for 1 day. Sagittal or coronal sections of 50– 100 µm thickness were obtained using a microslicer (VT1000S, Leica) [31]. Fluorescence images were taken with a fluorescence microscope (BZ-9000, Keyence).
Surgical procedure of indwelling catheter into the bladder
Mice were anesthetized with an intraperitoneal injection of urethane (1.5 g/kg, Sigma-Aldrich, St. Louis, MO). An abdominal midline incision was made, and the bladder was exposed. For bladder pressure measurements, a pore was made in bladder apex using a 20-gauge needle. After that, a polyethylene catheter (PE50, Clay-Adams, Thermo Fisher Scientific, Waltham, MA) was inserted gently through the bladder apex pore into the lumen. Purse string suture was performed to fix the catheter using 6-0 ethilon (Johnson & Johnson, New Jersey, USA). The catheter was tunneled subcutaneously and anchored to the skin of the back with a 6-0 ethilon. Abdominal wounds were closed [32].
11
Cystometry recording
The indwelling bladder catheter was connected to a perfusion apparatus (KD780220, Fisher Scientific, Pittsburgh, USA), which was connected to a syringe pump. The perfusion rate was controlled at 10 μL/min [33]. A pressure transducer was placed in-line between the perfusion apparatus and the animal. The bladder pressure induced by perfusion of normal saline was recorded. Data was acquired by using a data acquisition system (Power Lab/8sp, AD Instruments Inc., Colorado, USA) interfaced through a personal computer running a vendor-supplied software (Power Lab Chart version 8.0, AD Instruments). The following cystometric parameters were investigated: maximal voiding pressure (maximal bladder pressure during micturition), basal pressure, threshold pressure, and intercontraction interval (ICI, the intervals between peak spontaneous bladder contraction)[32, 34-36] .
Electrical stimulations
After cystostomy, mice were held by a stereotaxic apparatus (Narishige). Craniotomy was performed with a dental drill. Small holes (0.5 mm in diameter) were made bilaterally (position: A: 0.5 mm, L: ±1.2–1.5 mm, insert depth 2.2 mm, insertion angle: 45°). Sixty minutes after the start of cystometry, a coaxial bipolar electrode [37] were inserted on both sides under stereotaxic assistance. The oblique (angled 45°) depth was 2.2 mm. Immediately after insertion, electrical stimulation was performed by using a constant current stimulus isolator [38] and a pulse generator (Pulse Pal, Sanworks LLC., NY, USA). Detailed stimulation parameters were as follows; pulse amplitude: 40 µA, pulse duration: 0.001s,
12
pulse intervals: 0.02s, burst duration: 0.2s, burst intervals: 6.0s, train duration: 600s. ICI was measured as cystometric parameters.
Drug administration
After the cystometry started, the recording of the bladder pressure was kept until stable waveforms were obtained. Subsequently, glass pipettes (Harvard apparatus) for injection were inserted into bilateral ACC (A: 0.5 mm, L: ±1.2–1.5 mm, D: 2.2 mm, 45°). Picrotoxin (PTX, 100 nL, 0.1 mg/mL, dissolved in PBS, Invitrogen) or muscimol (100–500 nL, 0.1 mg/mL, dissolved in PBS,Invitrogen) was injected into ACC at a rate of 20 nL /min with a custom-made pressure injection device [39, 40].
Optogenetic stimulation of excitatory neurons
Cystostomy was performed on Thy1-ChR2-EYFP mice. Mice were held with stereotaxic apparatus (Narishige) after the surgery. Then, small craniotomies (0.5 mm in diameter) were made bilaterally (A: 0.5 mm, L: ±1.2–1.5 mm) using a dental drill. Light probes (cannula with Ø400 µm core, 0.39 NA multimode fiber, CFML14L05, Tholabs, New Jersey, USA) were inserted into both sides. To avoid damage to ACC by insertion of probes, they were tilted by 45° and inserted by 1.8–2.0 mm along the longitudinal axis. After insertion, light probes were fixed by dental cement. 30–45 minutes later, cystometry was started. After the stable bladder pressure was obtained, light stimulation was delivered by a light-emitting diode light source (470 nm, Lumencor; stimulation parameters using Pulse Pal, pulse duration: 0.005s, pulse intervals: 0.015s, burst duration: 0.5–60s, burst
13
intervals: 60s, train duration: 30 min, power: 6.4–10.2 mW/mm2). Stimulation for
M1 was performed in the location based on previous literature (A: –0.9 mm, L: +1.0 mm, D: 0.58 mm, 0°) [22]. In brain mapping experiments, a craniotomy was performed to expose the area surrounded by right coronal suture, midline, and right inferior cerebral vein. Light probes consisted of the cannula with Ø105 µm Core and 0.22 NA multimode fiber (CFML21L05, Tholabs) was used. Light stimulation was performed at the locations on 3 × 3 grid pattern (A: 0.2, 0.7, 1.2 mm, L: 0.2, 0.7, 1.2 mm, insert angle: 0°) and at 2 different depths (superficial layer: 0.5 mm, deep layer: 1 mm from the surface). For cell-type specific stimulation, we injected 100nL of AAV2/1-CaMK2a-hChR2(H134R)-EYFP into ACC bilaterally. After 3–4 weeks, cystometry, and light stimulation was performed. After the experiments, mice were transcardially perfused with 4% PFA and coronal microslicer sections were processed, and the expression of ChR2 was confirmed by fluorescence of EYFP.
Optogenetic stimulation of PV neurons
We injected 100nL of AAV2/1-EF1a-double floxed-hChR2(H134R)-EYFP-WPRE-HGHpA into bilateral ACC of PV-Cre mice. After 3–4 weeks later, we performed cystometry and light stimulation. Stimulation parameters were as follows (470 nm, Lumencor; stimulation parameters using Pulse Pal, pulse duration: 0.005 s, pulse intervals: 0.015 s, burst duration: 120 s, burst intervals: 60 s, train duration: 30 min, power: 6.2–10.1 mW/mm2). After the experiments,
mice were transcardially perfused with 4% PFA and coronal microslicer sections were processed, and the expression of ChR2 was confirmed by fluorescence of
14
EYFP.
Data analysis
All intravesical pressure data were acquired using Lab chart. Lab chart data files were converted to axon pClamp files (Molecular Devices, San Jose, CA) and CSV and Excel files. The converted data was analyzed using Python. In a series of changes in the urinary bladder pressure waveform from the storage period to the voiding period (Supplementary Figure 1), ICI was measured as the interval between the peaks of pressure waveform. Pmax and basal pressure (BP) was the maximum and the minimum value of the bladder waveform, respectively. Threshold pressure (TP) was defined as the pressure immediately before the start of micturition [36].
Statistics
All values were presented as mean ± SEM unless otherwise stated. Statistical analyses of the acquired data were performed using the Excel (Microsoft, One Microsoft, WA, USA) and Excel Statistical Program File y-stat 2018 (Igakutosyo shuppan, Saitama, Japan). Wilcoxon t-test was used to compare two sets of paired data. Mann-Whitney U test was used to compare two sets of unpaired data. Friedman’s chi-square test and subsequent Wilcoxon t-test with Bonferroni correction as a post hoc test were used to more than three sets of repeated measures. Kruskal Wallis H-test and subsequent Mann-Whitney U-test with Bonferroni correction as post hoc test were used to more than three sets of non-repeated measures.
15
Results
A descending pathway from ACC to the bladder
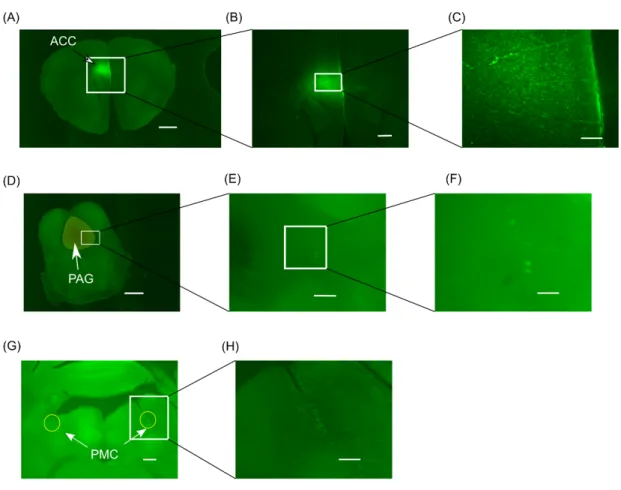
To identify brain project pathways related to micturition, a retrograde neural tracer, cholera toxin subunit B (CTB)-Alexa488 was injected into PAG of WT mice. In sagittal sections, fluorescence signal was found in ACC (Figure 1A–1C), paraventricular thalamic nucleus, perifornical part of the lateral hypothalamic area, nucleus accummbens, and stria medullaris. In coronal sections, the fluorescence was divided into three directions: ventral, lateral, and dorsal as it moved anteriorly (Figure 1D–1G). Axonal fluorescence was observed in the regions leading to the Edinger-Westphal nucleus (Figure 1H), cingulate cortex (CC) (Figure 1J and 1K) and caudate putamen on the ventral side (Figure 1N and 1O). Fluorescence signal was also observed at a zonal layer of the superior colliculus, optic nerve layer of superior colliculus on the cephalic side, external capsule (Figure 1L and 1M).
Subsequently, a transsynaptic tracer, wheat germ agglutinin (WGA)-Alexa594, was injected into ACC to confirm the descending pathways from ACC (Figure 2A– 2C). Fluorescence was detected inside the caudate putamen (not shown) and was confirmed in PAG (Figure 2D and 2F) and PMC (Figure 2G and 2H).
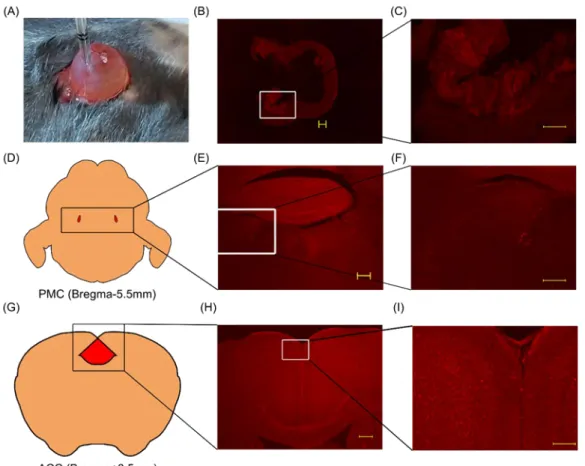
Furthermore, to elucidate the existence of a neural pathway from ACC to the bladder, we injected WGA-Alexa633 into the bladder of WT mice (Figure 3A). After 3–5 days later, we confirmed fluorescence in the bladder wall (Figure 3B and 3C), PMC (Figure 3E and 3F), and ACC (Figure 3H and 3I). This result showed the existence of a pathway from ACC to the bladder. This pathway
16
includes PMC and would also include PAG (Figure 1), which have previously been shown to associate with micturition [21, 40].
17
Figure 1. Identification of brain regions projecting to PAG
(A) – (C): A sagittal section of WT mouse brain in which CTB-Alexa488 was injected into PAG. (A) Image integration of a sagittal section. Scale bar: 1000 µm. (B) Magnified image around ACC indicated by a box in (A). Scale bar: 200 µm. (C) Labeled cells were clearly observed in ACC. Scale bar: 50 µm. (D)–(O): A series of coronal sections of a WT mouse brain in which CTB-Alexa488 was injected into PAG. From (D) to (I), each section was arranged in order from PAG to forward. (D) The section from the injection site. Scale bar: 200 µm. The fluorescence was also confirmed in red nucleus (RMC). (E) Around PAG. Scale bar: 200 µm. (F) Around PAG Scale bar: 200 µm. The fluorescence signal was divided into three regions. (G) Image integration of a section rostral to (F). Scale bar: 1000 µm. (H) Image integration of a section rostral to (G). Scale bar: 1000 µm. (I) Image integration of a section rostral to (H). Scale bar: 1000 µm. (J) Image integration of a section rostral to (I). Fluorescence was confirmed in CC caudal area (area29). Scale bar: 1000 µm. (K) Magnified image of the boxed region in (J). Scale bar: 200 µm. (L) Image integration around hippocampus. Fluorescence was observed in the external capsule (ec). Scale bar: 1000 µm. (M) Magnified image of boxed region in (L). Scale bar: 200 µm. (N) Image integration around caudate putamen (CPu). Scale bar: 1000 µm. (O) Magnified image of boxed region in (N). Scale bar: 200 µm.
18
Figure 2. Projection from ACC to PMC and PAG
(A) Image integration around the injection site. Scale bar: 1000 µm. (B), (C) Magnified images around ACC. Scale bar: 300 µm (B), 100µm (C). (D) A section around PAG. Scale bar: 1000 µm. (E), (F) Magnified images of PAG. Scale bar: 200µm (E), 100µm (F). (G) A section around PMC. Scale bar: 300µm. (H) Magnified image of boxed region in (G). Scale bar: 200µm
19
Figure 3. The pathway from ACC to bladder
(A) Injection of WGA-Alexa633 into the bladder wall. (B) Fluorescence was confirmed in bladder mucosa. Scale bar: 300 µm. (C) Magnified image of the boxed area shown in (B). Scale bar: 200 µm. (D) Schema of PMC. The red areas indicate PMC. (E) Fluorescence signals were confirmed in PMC. Scale bar: 300 µm. (F) Magnified image of the boxed area shown in (E). Scale bar: 200 µm. (G) Schema of ACC. Red area indicates ACC. (H) Fluorescence signals were confirmed in the bilateral ACC. Scale bar: 300 µm. (I) Magnified image of the boxed area shown in (H). Scale bar: 100 µm.
20
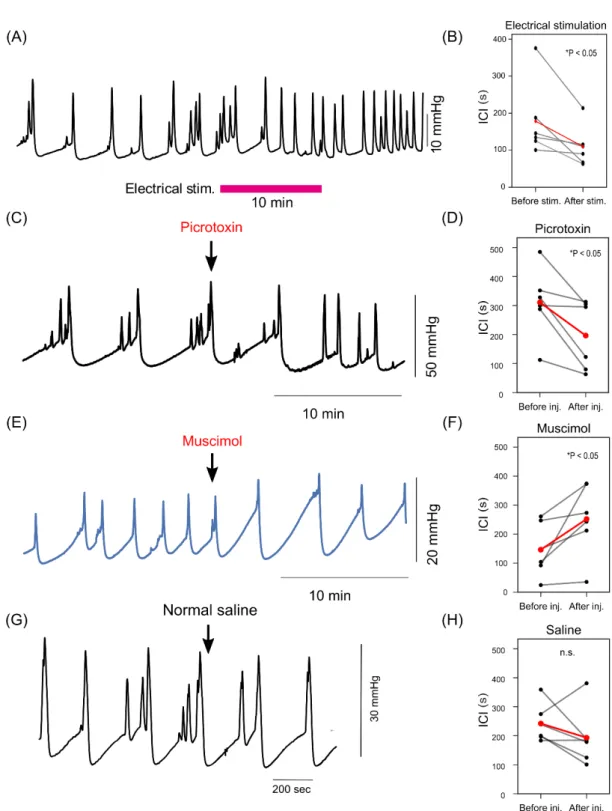
Electrical and pharmacological activation of ACC induces urination
Next, I examined whether the activity of ACC could induce micturition reflex. I electrically stimulated bilateral ACC while the bladder pressure was continuously monitored by cystometrogram (CMG). Electrical stimulation to ACC significantly shortened intercontraction interval (ICI) (Figure 4A and 4B). This result is inconsistent with previous reports with rats using a vertical insertion approach, which showed that electrical stimulation of ACC prolonged ICI [26].
To overcome possible artifact or tissue damage induced by electrical stimulation, I performed additional pharmacological experiments that manipulated the activity of ACC. Injection of GABAA receptor antagonist
picrotoxin (PTX) significantly shortened ICI (Figure 4C and 4D). This result was consistent with electrical stimulation experiments (Figure 4A and 4B) and indicated that elevated activity of neurons in ACC enhanced micturition reflex. On the other hand, I found that injection of GABAA agonist, muscimol into ACC
prolonged ICI (Figure 4E and 4F), suggesting that inhibition of neurons in ACC suppressed micturition reflex. Injection of normal saline into ACC did not significantly change ICI (Figure 4G and 4H). These results indicated that micturition reflex could be controlled by the activity of neurons in ACC.
21
Figure 4. The effect of non-selective stimulation and inhibition of ACC during cystometrogram (CMG)
22
electrical stimulation. (B) Statistical analysis of ICI changes between before and after electrical stimulation (Before vs After stim.: 178.3 ± 41.2 vs 110.0 ± 22.4 s, Average ± SEM, *P<0.05, Wilcoxon T-test, N=6). (C) A representative example of picrotoxin injection. Picrotoxin injection into ACC shortened ICI. (D) Statistical analysis of ICI changes between before and after PTX injection (Before vs After injection: 325.1 ± 63.3 vs 183.6 ± 46.9 s, *P<0.05, Wilcoxon T-test, N=5). (E) A representative example of ICI changes by muscimol injection. Muscimol injection into ACC prolonged ICI. (F) Statistical analysis of ICI changes between before and after muscimol injection (Before vs After injection: 149.7 ± 31.4 vs 247.9 ± 61.7 s, *P<0.05, Wilcoxson T-test, N=5). (G, H) Saline injection into ACC did not change ICI. (Before vs After injection: 242.2 ± 27.1 vs 193.3 ± 40.3 s, P=0.260, Wilcoxson T-test, N=5)
23
Selective activation of layer 5 pyramidal neurons in ACC initiate micturition reflex
Electrical stimulation and pharmacological manipulation of ACC activity suggested that elevation of neural activity in ACC induces micturition reflex. However, these experiments could not discriminate what kinds of neuronal populations in ACC was critical for micturition reflex and could not determine the relationship between the neuronal activity of ACC and micturition reflex. Therefore, I conducted optogenetic experiments to selectively stimulate specific neuronal populations in ACC (Figure 5A). I first targeted excitatory projection neurons in ACC by using Thy1-ChR2-EYFP transgenic mice. In this mouse line, most of layer 5 pyramidal neurons express channelrhodopsin-2 (ChR2) throughout the cerebral cortex (Figure 5B) [27]. When bilateral ACC of Thy1-ChR2-EYFP mice was irradiated with a train of blue light pulses, the bladder pressure was consistently elevated (Figure 5C and 5D). Stimulus triggered averaging of the bladder pressure clearly showed a reliable elevation in Thy1-ChR2-EYFP mice, whereas photostimulation to ACC in WT mice failed to induce the bladder pressure elevation (Figure 5E). The latency of peak bladder pressure was precisely time-locked to the onset of photostimulation (Thy1-ChR2 vs. WT mice: 11.9 ± 1.97s vs 98.6±17.2s; N=3 and 4, respectively, Figure 5F).
I also found that only a brief period of photostimulation (2s) could induce significant elevation of the bladder pressure, and peak bladder pressure was dependent on the duration of photostimulation; longer stimulus duration induced larger peak bladder pressure (Figure 6A and 6B). CMG in WT mice indicated that
24
approxymately 10 mmHg pressure increase was required to reach the threshold pressure from the basal pressure [32]. The average increase in bladder pressure with photostimulation for 20 seconds was the closest to this value (8.53 ± 8.40 mmHg).
Based on this condition, photostimulation of 20 seconds duration was delivered every 1 minute to examine the effect of optogenetic activation in ACC on the micturition parameters (Figure 6C). In Thy1-ChR2 mice, photostimulation significantly shortened ICI and lowered threshold pressure (TP) and maximum bladder pressure (Pmax) (Figure 6D–6F). In WT mice, only a micturition reflex was observed regardless of photostimulation (Figure 6G–6I).
26
Figure 5. Optogenetic stimulation of ACC activity induces micturition reflex.
(A) Photostimulation to ACC of Thy1-ChR2 mouse induced micturition reflex. (B) A coronal section of the Thy1-ChR2 mouse brain after the experiment. Probe traces in both hemispheres were confirmed near ACC. Scale bar: 1000 µm. (C) Representative example of bladder pressure with 10 sec phototimulation delivered to ACC of Thy1-ChR2 mouse: every 1 min photostimulation reliably increased bladder pressure. (D) Changes in the bladder pressure of Thy1-ChR2 mouse and WT mouse in response to the photostimulation. Shadings indicate the timing of photostimulation. (E) Overlaid traces. Photostimulations induced micturition reflex in Thy1-ChR2 mice but not in WT. (F) Relative cumulative histogram of the latency of the peak bladder pressure to the onset of photostimulation.
28
Figure 6. Effect of photostimulation to ACC of Thy1-ChR2 mouse
(A) Trial-averaged changes in intravesical pressure by photostimulation to bilateral ACC in Thy1-ChR2 mice. Thick lines and shadings indicate mean and 95% confidence interval (CI), respectively. Colors indicate the duration of light stimulation. (B) The maximum bladder pressure (Pmax) induced by photostimulation in Thy1-ChR2 and WT mice. Light stimulation longer than 2s induced significantly larger Pmax in Thy1-ChR2 mice than that in WT. *P<0.05, **P<0.01, N=5. (C) Upper, representative bladder pressure waveform before and during photostimulation to ACC in a Thy1-ChR2 mouse. Light blue bars indicate the timing of photostimulation (50Hz, 20 sec, every 1 min). Photostimulations shortened ICI, and lowered TP and Pmax. The same photostimulation did not induce these effects in WT mice. (D)–(F) The effect of photostimulation to TP, Pmax, and ICI in Thy1-ChR2 mice. Photostimulation significantly reduced all of these parameters (No photostimulation vs Photostimulation, median ± SE, TP: 13.1 ± 1.8 vs 7.5 ± 1.4 mmHg, Pmax: 27.9 ± 7.3 vs 24.8 ± 5.8 mmHg, ICI: 6.9 ± 1.7 vs 5.7 ± 1.2 sec, Wilcoxon t-test,*p<0.05,**p<0.01, N=5). (G)–(I) The effect of photostimulation in WT mice. There were no significant change all of these parameters (No photostimulation vs Photostimulation, median ± SE, TP: 13.1 ± 1.8 vs 7.5 ± 1.4 mmHg, Pmax: 27.9 ± 7.3 vs 24.8 ± 5.8 mmHg, ICI: 6.9 ± 1.7 vs 5.7 ± 1.2 sec, Wilcoxon t-test, N=5)
29
Selective activation of excitatory neurons in ACC induced micturition reflex. It was possible that photostimulation in Thy1-ChR2 mice could activate neurons located in nearby cortical areas or passing fibers. Therefore, we next used an adeno-associated virus (AAV) encoding ChR2 in ACC of WT mice to specifically express ChR2 in local neurons. AAV-CaMKII-ChR2 was injected in ACC to specifically activate excitatory neurons (Figure 7A–7C). Photostimulation induced elevation of bladder pressure (Figure 7D), and the latency of the peak bladder pressure to the onset of photostimulation was indistinguishable to that observed in Thy1-ChR2 mice (17.2 ± 5.7 s vs. 13.9 ± 3.8 s, p=0.1876). Furthermore, changes in TP, Pmax, and ICI upon light stimulation were not significantly different from those in Thy1-ChR2 mice (Figure 7E–7G). These results indicate that selective activation of excitatory neurons in ACC reliably induced micturition reflex.
31
Figure 7. Selective activation of excitatory neurons in ACC induces micturition reflex.
(A)–(C) Local expression of ChR2 in bilateral ACC using AAV. (A) Bright-field image of a coronal section. Scale bar: 1000 μm. (B) Fluorescence image of the same slice. Scale bar: 1000 μm. (C) Magnified view. Scale bar: 300 μm. ChR2 was locally expressed in bilateral ACC. (D) Representative bladder pressure waveform during photostimulation to ACC in mice expressing ChR2 using AAV-CaMKII-ChR2. Blue bars indicate the timing of photostimulation (50Hz, 20 sec, every 1 min). (E)–(G) Comparison of micturition parameters induced by light stimulation with those in Thy1-ChR2 mice. All parameters (ICI, Pmax and TP) were not significantly different between two groups (Thy1-ChR2 vs. AAV-CaMKII-ChR2; ICI: 4.2 ± 2.7 vs 3.6 ± 2.2 min, p=0.841; Pmax: 29.4 ± 13.0 vs 22.8 ± 6.1 mmHg, P=0.224; TP: 6.3 ± 3.1 vs 4.7 ± 3.3 mmHg, p=0.548, Mann Whitney U test, N=5)
32
Selective activation of inhibitory interneurons in ACC suppresses micturition reflex.
Muscimol injection in ACC significantly prolonged ICI (Figure 4F). Therefore, we hypothesized that the activity of GABAergic neurons in ACC also controls micturition reflex. To test this, ChR2 was specifically expressed in parvalbumin (PV) positive neurons, which is a major inhibitory interneuron in the neocortex, by injecting an AAV encoding ChR2 in ACC of PV-Cre mice [28]. Figures 8A and 8B show an example coronal section of ACC in which only PV neurons expressed ChR2. In these mice, ICI was significantly prolonged just after photostimulation (Figure 8C–8F), indicating that micturition reflex was suppressed by the activity of local inhibitory interneurons in ACC.
34
Figure 8. Selective activation of PV neurons in ACC suppresses micturition reflex.
(A) Fluorescence image of a cortical slice obtained by injecting AAV-EF1a-DIO-ChR2 into ACC of a PV-Cre mouse. Scale bar: 300 µm. (B) Magnified image of the same slice shown in (A). Scale bar: 100 µm. (C) Representative bladder pressure waveform during photostimulation to ACC in a PV-Cre mouse which was injected AAV-EF1a-DIO-ChR2 into bilateral ACC. Blue bars indicate the timing of photostimulation (50Hz, 2 min, every 10 min). (D) Raster plot of peak bladder pressure (upper) and PSTH (lower) indicate that photostimulation suppressed bladder pressure elevation. (E) ICI significantly prolonged by the activation of PV neurons in ACC (median ± SEM before vs. after stimulation, 112.6 ± 46.9 vs 189.2 ± 39.2 s, Wilcoxon t-test *P<0.05, N=6). (F) Each ICI distribution of ICI before or after photostimulation (N=6).
35
Optogenetic mapping of the cortical regions inducing micturition reflex Finally, to compare the contribution of ACC and nearby cortical areas to micturition, we performed optogenetic brain mapping experiments by using Thy1-ChR2 mice (Figure 9A). A range of cortical areas including ACC and the primary motor area anterior to bregma (rostral M1) was optogenetically stimulated at superficial and deep layer, while the bladder pressure was monitored (Figure 9B– 9K and Figure S2A–S2I, N=9). The heat map of the average Pmax at each stimulation site showed that stimulation to ACC was more effective than that to rostral M1 in both layers (Figure 9B and Figure S2J). Pmax was highest when stimulating ACC (deep layer of No.1, No.4, and No.7) and decreased at the lateral part corresponding to rostral M1.
On the other hand, a part of the primary motor area located posterior to bregma (caudal M1) has been shown to be involved in micturition reflex [22, 41]. Therefore, we also compared the effect of the activity in ACC and the caudal M1 on micturition reflex (Figure 10A –10C). Stimulation in ACC and the caudal M1 showed the same effect on increasing bladder pressure. We did not observe a significant difference in the effect of photostimulation to ACC and the caudal M1 (Figure 10D–10F). The probability of the occurrence of the micturition reflex by photostimulation and the probability of the micturition reflex accompanied by photostimulation were not significantly different between ACC and the caudal M1 (Figure 10G, 10H).
37
Figure 9. Optogenetic mapping of cortical regions related to micturition reflex
(A) Location of photostimulation including ACC and the rostral M1. (B) The heat map showing average Pmax plotted at each stimulation point in the deep layer (depth:1.0mm). Photostimulation to ACC tended to show higher Pmax compared with that to lateral locations corresponding to M1. (C)–(K) Trial-averaged bladder pressure waveforms in response to 20-s photostimulation. Each number indicates the location of photostimulation. Thick lines and shadings are mean and 95% CI, respectively.
39
Figure 10. Comparison of ACC and the caudal M1
(A) A representative fluorescence image showing the optical fiber track located at ACC. Scale Bar: 300 µm. (B) A representative image showing the optical fiber track located at M1. Scale Bar: 300 µm. (C) Representative bladder pressure waveforms during photostimulation in ACC (upper) and M1 (lower). Blue bars in the middle indicate the timing of photostimulation. (D)–(F) Micturition parameters were not significantly different between ACC and the caudal M1(TP: 6.3 ± 3.1 vs 7.2 ± 4.8 mmHg, P=0.244; Pmax: 29.4 ± 13.0 vs 51.6 ± 38.6 mmHg, P=0.244; ICI: 4.2 ± 2.7 vs 6.0 ± 2.5 min, P=0.188). (G) Probability of existence of micturition reflex during photostimulation (ACC vs M1 44.35 ± 35.1 vs 13.91 ± 10.83%, P=0.053). (H) Probability of being photostimulated when there was a micturition reflex (ACCvs M1 95.9 ± 5.84 vs 61.2 ± 4.05%, P=0.259).
40
Discussion
The purpose of this study is to clarify how ACC contributes to micturition reflex. Human brain imaging studies using fMRI and PET for LUT function have revealed the involvement of higher brain regions including ACC [23, 24, 42-44]. However, I cannot rule out the possibility that these experiments detected neural activity that is not directly involved in LUT function, because situation and condition during investigation may affect brain activity. Furthermore, a human imaging study has reported that the activity of ACC was enhanced during the storage phase [21], while another study has reported seemingly contradictory result that ACC activity was enhanced during micturition or in patients with an overactive bladder [45]. Therefore, it is necessary to investigate whether the neural activity in ACC associated with LUT function is directly related to micturition reflex.
I hypothesized that ACC was directly involved in micturition reflex based on these previous reports. To prove this hypothesis, 1) I confirmed the existence of the ACC and bladder projection pathway, and 2) I also confirmed that nonselectively stimulation or inhibition for the ACC neurons affected interval of the bladder contractions with using drugs and electrical stimulation.Furthermore, by selectively stimulating neurons in ACC according to their excitatory and inhibitory functions, 3) I clarified the role of each ACC neuron in micturition reflex. Finally, compared with other cortical regions, 4) I found that ACC excitatory neurons have a facilitative effect on the micturition reflex. The results of these experiments supported my hypothesis.
41
The pathway between ACC and the bladder
Although previous studies have shown the neural pathways between the bladder and several brain regions such as PMC, PAG and primary motor cortex [22, 46], the pathway between ACC and the bladder was unclear. Therefore, I first sought to confirm the existence of pathways between ACC and the bladder. Consistent with the hypothesis that ACC projects to PAG [46], injection of a retrograde tracer, CTB, resulted in strong signals in ACC (Figure 1A–1C). In addition to ACC, fluorescence signals could be confirmed over a variety of regions including M2, M1, the genu of the corpus callosum, hypothalamus, paraventricular hypothalamic nucleus, and nucleus accumbens. The coronal slice showed that the fluorescence present in PAG was branched into dorsal, lateral, and ventral pathways (Fig1D-1F). Fluorescence were also observed in red nucleus magnocellular part. The cephalic nerve layer of the superior colliculus and the zona layer of the superior colliculus showed fluorescence. The superficial gray layer of the superior colliculus, which is the region sandwiched between the two, did not show any fluorescence, while the zona layer of the superior colliculus showed a continuous fluorescence toward the dorsal side and cingulate cortex (Area 29). No fluorescence was observed in the hippocampus in the lateral direction, but fluorescence was observed in the nearby alveus of the hippocampus, confirming a transition to the primary somatosensory cortex near the hippocampal CA2 level. In the ventral direction, fluorescence was observed in Edinger-Westphal nucleus. The trend within the other caput putamen was confirmed. On the other hand, no fluorescence was observed in thalamus or
42
caudoputamen. One of the parts of this result was same that of previous report [47].
From these results, it was confirmed that there is a pathway between PAG and ACC. Paraventricular hypothalamic nucleus, which controls the posterior pituitary lobe [48], the site of production of the antidiuretic hormone vasopressin, and accumbens, where the pathway from PAG is responsible for fear [49], also showed fluorescence in some parts of the pathway, suggesting that micturition activity may be regulated by various input and outputs in PAG. Subsequently, WGA, an antegrade and retrograde neural tracer, was injected into ACC to confirm the distribution (Figure 2A–2C) [29]. Fluorescence was observed in the cell bodies of PAG and PMC, respectively (Fig2D–2H), indicating that there are pathways from ACC to PAG and PMC. Although I have not been able to fully identify the pathways involved in micturition reflex, the results at least indicate a linkage among ACC, PMC and PAG. Furthermore, WGA injection into the bladder revealed the descending pathway including ACC, PMC and PAG (Figure 3A–3I). Therefore, all these tracing experiments suggest the presence of the pathway from ACC to the bladder via PAG and PMC.
Non-selective stimulation and inhibition experiments
Since the presence of a pathway from ACC to the bladder was confirmed, it was considered that a stimulation intervention for ACC could affect micturition reflex. Therefore, I decided to examine whether the stimulation or suppression of ACC would affect micturition reflex.
43
examined in rodents under urethane anesthesia [26]. In rats, the interval between bladder contractions was prolonged by stimulating ACC with an electric stimulation needle [26]. In my experiments in mice, however, the intervals of the bladder contraction were shortened by the stimulation (Figure 4A and 4B). The possible explanations of these contradictory results are 1) the difference in the insertion angle of the stimulation electrode, which could stimulate different neural populations in ACC, 2) tissue damage that might be induced by heat generated by relatively strong electrical stimulation, or 3) the species difference. To exclude the possibility of artifact or tissue damage, I next conducted additional drug administration experiments. Picrotoxin, a GABAA receptor antagonist shortened
interval of the bladder contraction (Figure 4C–4D), whereas, muscimol, a GABAA
receptor agonist prolonged interval of the bladder contractions. These results of the drug administration experiments are consistent with previous pharmacological studies [2-4], and support the results of my electrical stimulation experiments such that the activation of ACC induces micturition reflex. However, in these non-specific stimulation experiments, the details of which types of neurons in the ACC were activated is unclear. Therefore, I decided to use optogenetics as a method with excellent manipulability, cell-type specificity, and reproducibility.
Selective stimulation and inhibition in micturition reflex using optogenetics Photostimulation to the bilateral ACC of Thy1-ChR2 mice, which express the excitatory opsin, ChR2, in cortical layer 5 excitatory neurons, reliably induced an increase in bladder pressure (Figure 5). Photostimulation significantly reduced
44
TP and Pmax, and significantly shortened the interval of bladder contractions in Thy1-ChR2 mice (Figure 6D–6F), but not in WT mice (Figure 6G–6I). Besides, I found that these effects were extremely reproducible.
Although optogenetic stimulation on Thy1-ChR2 mice was performed by pointing the light probe at ACC, I could not rule out the possibility that other cortical regions were also photostimulated. In fact, the results of tracing experiments show that both ACC and M1, and possibly S1 project to PAG, and thus it was possible that the micturition reflex was induced by the activation of M1 and S1 rather than ACC. As a further experiment, I stimulated only ACC excitatory neurons. To show that neural activity in ACC is important for micturition reflex, ChR2 was expressed in excitatory neurons specifically in ACC using AAV. Photostimulation to these mice gave the comparable results to those of Thy1-ChR2 mice (Figure 7E–7G). These results indicate that ACC excitatory neurons play an important role in induction of micturition reflex.
Contribution of inhibitory neurons in ACC to micturition reflex
Given that the activation of excitatory neurons in ACC induced bladder contractions, it was anticipated that the activation of inhibitory neurons suppresses micturition reflex. I targeted PV neurons, which are the most abundant inhibitory neurons in the cerebral cortex [50]. Using PV-Cre mice, I specifically expressed ChR2 in PV neurons of ACC (Figure 8A). As expected, the interval of bladder contractions was prolonged after the photostimulation in these mice (Figure 8B–8F). Thus, the activation of PV neurons in ACC suppressed micturition reflex. The results indicate that activating the neurons with different
45
function within ACC resulted in a diametrically opposite response in micturition reflex. The results of this study are summarized in Table 1.
It was previously considered that functions of micturition and storage are controlled by distinct brain regions, and the primary function of ACC is to suppress micturition reflex and induce storage of urine [51]. On the other hand, there is a human brain studies that ACC is activated during voiding phase[24]. My study revealed that functions of micturition and storage are controlled by the activities of excitatory and inhibitory neurons within ACC, respectively. These results resolved discrepancies in human cerebral imaging studies measuring nonselective cerebral neural activity, and indicated that even in a single region (ACC), micturition reflex is regulated by independent activation of neurons with different functions. Although micturition reflex has been thought to be regulated by interactions between different regions, I have shown that even in a single region (ACC), micturition reflex is regulated by independent activation of neurons with different functions. Therefore, the balance of excitation and inhibition in ACC is most likely the determinant factor of the induction or suppression of micturition.
Exploration of the cortical regions involved in LUT function
Emerging evidence and the results of my tracing experiments suggested that not only ACC but also M1 region of the cerebral cortex is related to LUT function [22]. Therefore, we performed optogenetic mapping experiments to investigate whether the area in the cortex involving micturition reflex is restricted to ACC. In the anterior region, I found that the activation of the most medial region corresponding to ACC was much more effective for inducing micturition than the
46
lateral region corresponding to the rostral M1 (Figure 9). As reported by Yao et al. [22], I also found that the activation of the caudal part of M1 induces micturition reflex and is as effective as the activation of ACC (Figure 10). Therefore, I conclude that the neural activity of ACC plays an important role in the storage and micturition behavior, and this function of ACC is comparable to that of the caudal M1. The difference in the role for LUT function between ACC and M1 remains to be investigated.
Future perspective towards therapeutic applications
In clinical practice, therapeutic procedures in patients with LUT dysfunction, such as indwelling urethral catheters or clean intermittent self-catheterization, are often performed to manage urological complications. However, these treatments may still cause urological troubles during follow-up and affect patient’s quality of life. Recently, several studies have shown that electrical or optogenetic stimulation of spinal motor neurons can be utilized to precisely control micturition reflex and these techniques are expected as new therapeutic approaches [52]. The results of my study also open the possibility of another method for controlling micturition reflex by manipulating the brain activity and may contribute to the development of novel therapies in the future.
47
48
:
Supplement Figure1.
Definition of bladder waveform
Pmax: maximum bladder pressure, BP: basal bladder pressure, TP: threshold pressure, ICI: intercontraction interval
49
Supplement Figure 2: Mean changes in bladder pressure in response to photostimulation to the shallow layer (0.5 mm)
50
(A)–(I) The numbers correspond to the positions as in Figure 9. (J) Heat map of average bladder pressure elevation in response to light stimulation at the depth of 0.5 mm. The numerical values show the average of the maximum intravesical pressure generated during light stimulation for 20 seconds.
51
Acknowledgments
I would like to express my sincere gratitude to Professor Kazuo Kitamura for having accepted me as a Ph-D student and for his supervision. I also warmly thank Dr. Satoshi Manita for his advice, supervision, and helpful discussions. Finally, I am very grateful to Professor Masayuki Takeda for his advice, supervision and to Professor Takahiko Mitsui for his advice, supervision, technical teaching, and Dr. Mitsuharu Yoshiyama, Dr. Norifumi Sawada, Dr. Hiroshi Nakagomi, Dr. Satoru Kira, Dr. Tatsuya Ihara for useful advice.
52
References
1. Barrington, F.J.F., The Effect of Lesions of the Hind- and Mid-Brain on
Micturition in the Cat. Quarterly Journal of Experimental Physiology, 1925.
15(1): p. 81-102.
2. Mallory, B.S., J.R. Roppolo, and W.C. de Groat, Pharmacological
modulation of the pontine micturition center. Brain Res, 1991. 546(2): p.
310-20.
3. Sugaya, K., et al., Electrical and chemical stimulations of the pontine
micturition center. Neurosci Lett, 1987. 80(2): p. 197-201.
4. de Groat, W.C. and N. Yoshimura, Pharmacology of the lower urinary tract. Annu Rev Pharmacol Toxicol, 2001. 41: p. 691-721.
5. Sugaya, K., et al., Central nervous control of micturition and urine storage. J Smooth Muscle Res, 2005. 41(3): p. 117-32.
6. Noto, H., et al., Opioid modulation of the micturition reflex at the level of
the pontine micturition center. Urol Int, 1991. 47 Suppl 1: p. 19-22.
7. Keller, J.A., et al., Voluntary urination control by brainstem neurons that
relax the urethral sphincter. Nat Neurosci, 2018. 21(9): p. 1229-1238. 8. Kuipers, R., L.J. Mouton, and G. Holstege, Afferent projections to the
pontine micturition center in the cat. J Comp Neurol, 2006. 494(1): p.
36-53.
9. Mantyh, P.W., Forebrain projections to the periaqueductal gray in the
monkey, with observations in the cat and rat. J Comp Neurol, 1982. 206(2):
p. 146-58.
10. Zare, A., et al., The Role of the Periaqueductal Gray Matter in Lower
Urinary Tract Function. Mol Neurobiol, 2019. 56(2): p. 920-934.
11. Taniguchi, N., et al., A study of micturition inducing sites in the
periaqueductal gray of the mesencephalon. J Urol, 2002. 168(4 Pt 1): p.
1626-31.
12. Matsuura, S., J.W. Downie, and G.V. Allen, Micturition evoked by
glutamate microinjection in the ventrolateral periaqueductal gray is mediated through Barrington's nucleus in the rat. Neuroscience, 2000.
101(4): p. 1053-61.
13. Stone, E., et al., GABAergic control of micturition within the periaqueductal
grey matter of the male rat. J Physiol, 2011. 589(Pt 8): p. 2065-78.
14. Matsumoto, S., et al., Activation of mu opioid receptors in the ventrolateral
53
Neurosci Lett, 2004. 363(2): p. 116-9.
15. Fowler, C.J., D. Griffiths, and W.C. de Groat, The neural control of
micturition. Nat Rev Neurosci, 2008. 9(6): p. 453-66.
16. Brittain, K.R., S.M. Peet, and C.M. Castleden, Stroke and incontinence. Stroke, 1998. 29(2): p. 524-8.
17. Kavia, R.B., R. Dasgupta, and C.J. Fowler, Functional imaging and the
central control of the bladder. J Comp Neurol, 2005. 493(1): p. 27-32.
18. Andrew, J., P.W. Nathan, and N.C. Spanos, Disturbances of micturition
and defaecation due to aneurysms of anterior communicating or anterior cerebral arteries. J Neurosurg, 1966. 24(1): p. 1-10.
19. Sakakibara, R., et al., Micturitional disturbance and the pontine tegmental
lesion: urodynamic and MRI analyses of vascular cases. J Neurol Sci,
1996. 141(1-2): p. 105-10.
20. Sakakibara, R., et al., Micturitional disturbance after acute hemispheric
stroke: analysis of the lesion site by CT and MRI. J Neurol Sci, 1996.
137(1): p. 47-56.
21. DasGupta, R., R.B. Kavia, and C.J. Fowler, Cerebral mechanisms and
voiding function. BJU Int, 2007. 99(4): p. 731-4.
22. Yao, J., et al., A corticopontine circuit for initiation of urination. Nat Neurosci, 2018. 21(11): p. 1541-1550.
23. Blok, B.F., A.T. Willemsen, and G. Holstege, A PET study on brain control
of micturition in humans. Brain, 1997. 120 ( Pt 1): p. 111-21.
24. Harvie, C., et al., Brain activation during the voiding phase of micturition in
healthy adults: A meta-analysis of neuroimaging studies. Clin Anat, 2019.
32(1): p. 13-19.
25. Tadic, S.D., et al., Brain activity underlying impaired continence control in
older women with overactive bladder. Neurourol Urodyn, 2012. 31(5): p.
652-8.
26. Kitta, T., et al., Role of the Anterior Cingulate Cortex in the Control of
Micturition Reflex in a Rat Model of Parkinson's Disease. J Urol, 2016.
195(5): p. 1613-1620.
27. Arenkiel, B.R., et al., In vivo light-induced activation of neural circuitry in
transgenic mice expressing channelrhodopsin-2. Neuron, 2007. 54(2): p.
205-18.
28. Inoue, M., et al., Rational Engineering of XCaMPs, a Multicolor GECI Suite
54
p. 1346-1360.e24.
29. Wright, C.S., Structural comparison of the two distinct sugar binding sites
in wheat germ agglutinin isolectin II. J Mol Biol, 1984. 178(1): p. 91-104. 30. Kanai, A.J., Afferent mechanism in the urinary tract. Handb Exp Pharmacol,
2011(202): p. 171-205.
31. Manita, S., et al., A Top-Down Cortical Circuit for Accurate Sensory
Perception. Neuron, 2015. 86(5): p. 1304-16.
32. Smith, P.P. and G.A. Kuchel, Continuous uroflow cystometry in the
urethane-anesthetized mouse. Neurourol Urodyn, 2010. 29(7): p. 1344-9.
33. Ito, H., et al., Muro-Neuro-Urodynamics; a Review of the Functional
Assessment of Mouse Lower Urinary Tract Function. Front Physiol, 2017.
8: p. 49.
34. Füllhase, C., et al., 121 Neuronal Control of Micturition Via Cannabinoid
(Cb) Type 1 Receptors - Evaluation of a Cb1 Knockout Mouse. Journal of
Urology, 2013. 189(4S).
35. Zhou, J., et al., Pharmacologic characteristics of bladder micturition
function in anesthetized mice. Comp Med, 2010. 60(6): p. 436-42.
36. Yoshiyama, M., et al., Sex-related differences in activity of lower urinary
tract in response to intravesical acid irritation in decerebrate unanesthetized mice. Am J Physiol Regul Integr Comp Physiol, 2008.
295(3): p. R954-60.
37. Schekutiev, G. and U.D. Schmid, Coaxial insulated bipolar electrode for
monopolar and bipolar mapping of neural tissue: technical note with emphasis on the principles of intra-operative stimulation. Acta Neurochir
(Wien), 1996. 138(4): p. 470-4.
38. Brasil, R.O. and J.H. Leal-Cardoso, An optically coupled power stimulus
isolation unit with high voltage and fast rise time output. Braz J Med Biol
Res, 1999. 32(6): p. 767-71.
39. Olsen, R.W., Picrotoxin-like channel blockers of GABAA receptors. Proc Natl Acad Sci U S A, 2006. 103(16): p. 6081-2.
40. de Groat, W.C., D. Griffiths, and N. Yoshimura, Neural control of the lower
urinary tract. Compr Physiol, 2015. 5(1): p. 327-96.
41. Fukuda, H. and T. Koga, Stimulation of three areas of the primary motor
cortex interrupts micturition in dogs. J Auton Nerv Syst, 1992. 38(3): p.
177-90.
urge-55
incontinent women. Neuroimage, 2007. 37(1): p. 1-7.
43. Matsuura, S., et al., Human brain region response to distention or cold
stimulation of the bladder: a positron emission tomography study. J Urol,
2002. 168(5): p. 2035-9.
44. Mehnert, U., et al., Brain activation in response to bladder filling and
simultaneous stimulation of the dorsal clitoral nerve--an fMRI study in
healthy women. Neuroimage, 2008. 41(3): p. 682-9.
45. Komesu, Y.M., et al., Functional MRI of the Brain in Women with
Overactive Bladder: Brain Activation During Urinary Urgency. Female
Pelvic Med Reconstr Surg, 2011. 17(1): p. 50-54.
46. Hou, X.H., et al., Central Control Circuit for Context-Dependent Micturition. Cell, 2016. 167(1): p. 73-86.e12.
47. Verstegen, A.M.J., et al., Non-Crh Glutamatergic Neurons in Barrington's
Nucleus Control Micturition via Glutamatergic Afferents from the Midbrain
and Hypothalamus. Curr Biol, 2019. 29(17): p. 2775-2789 e7.
48. Qin, C., J. Li, and K. Tang, The Paraventricular Nucleus of the
Hypothalamus: Development, Function, and Human Diseases.
Endocrinology, 2018. 159(9): p. 3458-3472.
49. Schwienbacher, I., et al., Temporary inactivation of the nucleus
accumbens disrupts acquisition and expression of fear-potentiated startle in rats. Brain Res, 2004. 1027(1-2): p. 87-93.
50. Ferguson, B.R. and W.J. Gao, PV Interneurons: Critical Regulators of E/I
Balance for Prefrontal Cortex-Dependent Behavior and Psychiatric Disorders. Front Neural Circuits, 2018. 12: p. 37.
51. Fowler, C.J. and D.J. Griffiths, A decade of functional brain imaging applied
to bladder control. Neurourol Urodyn, 2010. 29(1): p. 49-55.
52. Ito, H., et al., Probabilistic, spinally-gated control of bladder pressure and
autonomous micturition by Barrington's nucleus CRH neurons. Elife, 2020.