POTENTIAL APPLICATIONS OF REMOTE SENSING
PRECIPITATION PRODUCTS ON RAINFALL-RUNOFF
SIMULATIONS FOR UNGAUGED BASINS
(観測不足流域における降雨-流出解析への
衛星観測降水プロ
ク
の利用可能性の検討)
山梨大学大学院
医学工学総合教育部
博士課程学位論文
2015
年 9 月
i
ABSTRACT
The hydro-meteorological monitoring stations are highly heterogeneity all over the world. Moreover, it is very difficult or impossible to install the meteorological observation stations in the areas which are difficultly physical assess such as in remote mountainous areas or over the ocean. Therefore, the limitation numbers of monitoring rain gauge networks bottlenecks the quantification of the hydrological budget and water resources management, weather forecast in many regions across the world. Fortunately, remote sensing precipitation products which is available quasi global and economically retrieval with their broad spatial coverage and repeat temporal coverage supply promising alternative data source for hydrologic analysis to overcome the data sparse problem (Lakshimi, 2004 [1]). However, the quantitative rainfall estimates accuracy of remote sensing precipitation is still remaining issues. Hence, the raising question is that how to use the remote sensing precipitation efficiently in the circumstances of limited number of rain gauge for basin scale hydrological applications? Therefore, this study provides synthetic insight into the potential applications of remote sensing precipitation products on stream-flow simulations in data sparse catchments using the conceptual rainfall runoff model. The targeted river basins are well gauged basins located in East and South East Asia under the temperate and sub-tropical climate regions. The details of this research are discussed in the three subsequent sections.
1) Evaluations the ability of satellite precipitation data for stream-flow simulations
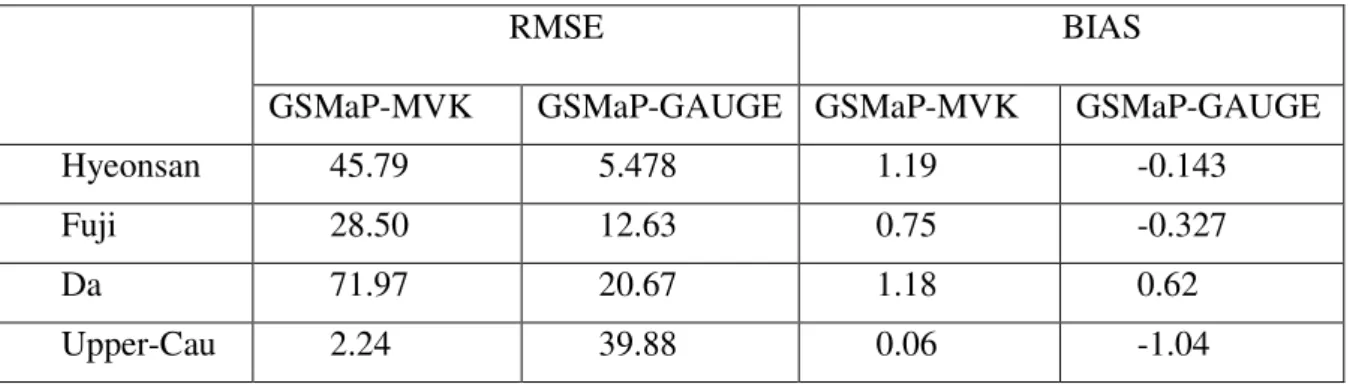
This study provides a well organized and synthesized insight into the applications of some remote sensing precipitation estimations for stream-flow prediction skills in several variety-sized river basins under different climates. In addition, this research also analyzes the deviations of model parameters due to the bias in remote sensing precipitation inputs in comparison with the standard ground measurements. The results reveal that GSMaP-MVK shows modest to moderate satisfactory discharge simulation skills in those four river basins which can be explained by the fact that satellite only product GSMaP-MVK significantly underestimates rainfall in Hyeonsan, Fuji and Da and modest relationship with rain gauge in monthly rainfall budget in Upper-Cau. In addition, satellite-gauge product GSMaP-Gauge product illustrates remarkable improvements of model performances compared with GSMaP-MVK in both temperate basins (Hyeonsan and Fuji) and sub-tropical basin (Da). However,
ii
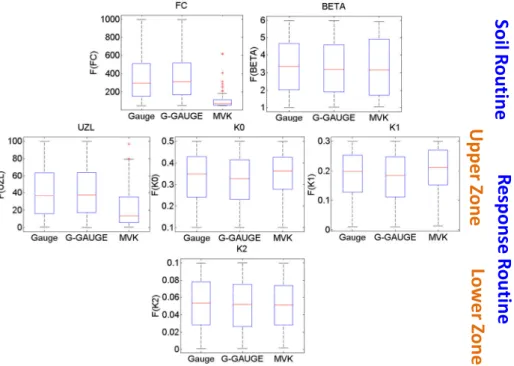
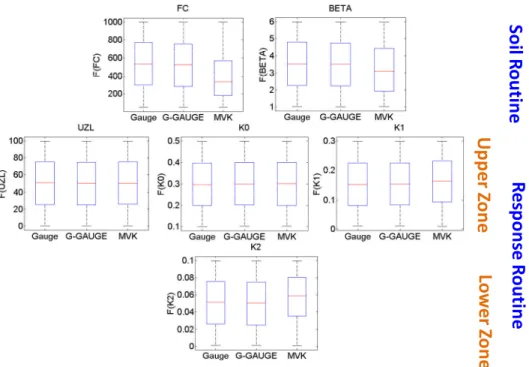
GSMaP-Gauge does not always enhance the original GSMaP-MVK performances, which is illustrated by slightly less stream-flow simulation skill of GSMaP-Gauge than GSMaP-MVK in Upper-Cau. This outcome can be explained by the fact that the quality of satellite-gauge merging precipitation highly depends upon satellite-gauge blending algorithm and limitation of sparse rain gauge network. In addition, the rainfall estimates uncertainties of remote sensing precipitation products would cause the parameters are adapted in the way that the model produces more stream-flow. Therefore, better parameter agreements with the observations of GSMaP-Gauge than that of GSMaP-MVK are observed in the river basins where remote sensing precipitation shows continuous discrepancy trends compared with the ground measurements.
As the above mentioned conclusion, the performances of the satellite-gauge merging products depend highly upon the merging retrieval algorithm and the blended rain gauge density. Hence, the aim of this study is assessing several blending methods at the catchment scale in different climatic regions to produce daily precipitation from remote sensing precipitation and rain gauge observations for investigating the stream-flow simulation capability. These blending methods, which are not computation expensive, are categorized into two groups: grid based merging and basin average merging. While the grid-based merging methods stem from the idea of geo-statistical interpolation with the emphasis on adjusting the satellite rainfall budget at pixel scale, the basin average merging approaches focus on adjusting the areal mean precipitation over the basin. There are two utilized satellite-gauge blending methods: constant multiple factor and bias reduction. Based on our verification, the best method is the bias reduction BR-MVK which reduces the magnitude gaps between the daily satellite rainfall estimations and the daily rain gauge data at each pixel and expresses fantabulous stream-flow simulation skills. Regarding the remaining satellite-gauge blending precipitation approaches, the monthly constant multiple factor reflects better performances than the annual constant multiple factor methods as the result of reducing the multiple factor time steps to monthly basis. In addition, adjusting the satellite precipitation data at each pixels results in better stream-flow prediction skills than adjusting the basin average precipitation. Especially, the better performances of MMF-MVK and BR-MVK than the rain gauge data in Da river basin suggest the utilizations of satellite-gauge
iii
merging precipitation in very large catchments to improve the rainfall information and overcome the data poor problems.
2) Assess the possibility of satellite precipitation for AMP uncertainty evaluations
One of our research goals was to evaluate the AMP errors using several indices including two proposed AMP error indices that account for not only the gauge density, the rainfall spatial variability but also the location of the rain gauges. The AMP uncertainties were related with the performances of a conceptual rainfall runoff HBV models in this study to investigate the impact of AMP uncertainties on rainfall runoff simulations. Since the AMP error are traditionally computed using the in-situ observations which is highly distort the AMP errors due to the fact that inadequate number of rainfall station cannot capture the true spatial distribution of the rainfall field. Therefore, another alternative data source with fine spatial-temporal resolution is highly needed. Hence, this research explores the uses of remote sensing precipitation product GSMaP-MVK for AMP error quantifications. The obtaining results approves that GSMaP-MVK is feasible alternative data source for this mentioned task because of the small ∆Cvd (around 4.4%) between ground and remote sensed observations. In
addition, the river basins with Esdd(MVK) larger than the threshold 0.46 is suggested to be investigated for rain gauge network configurations to ensure the stream-flow simulation skill of rainfall input. Although the concept of the proposed Eptd index is approved in the case of Fuji basin, it requires a large amount of rainfall data.
Since GSMaP-MVK is capable to estimate the AMP errors in data poor river basins using Esdd index, the AMP error map over the main river basins in Vietnam is produced to visualizing the degree of data sparse and figuring out which river basins should be further investigated for installing more rainfall stations. In general, most of the river basins in the Middle of Vietnam depicted very high Esdd(MVK) values despite of low to medium variations of rainfall field over space, which is mainly due to the limited rain gauge density in this region. Among those Middle part river basins, Thach Han, Tam Ky and Lai Giang catchments exposes severely high AMP uncertainties which are consistently larger than 0.6. This outcome gives the strong suggestion for investigation and installation of more rain gauges to configure appropriate rain gauge network stations in those watersheds.
As the achieved result that the satellite-gauge BR-MVK which reduces the magnitude gaps between the daily satellite rainfall estimations and the daily rain gauge data at each
iv
pixel and expresses fantabulous stream-flow simulation skill in all four targeted river basins; the question is whether BR-MVK also able to quantifying the AMP error. Therefore, BRMVK is also examined the capability for AMP error quantifications using Esdd index. The impact of rain gauge density which is incorporated to create BR-MVK on Esdd estimates ability is also investigated. The main finding is that BR-MVK shows positive capability to evaluate AMP uncertainty using the Esdd index, which is demonstrated by almost identical relations of model performances with Esdd between the merging precipitation using the full set of rain gauge and the standard ground measurements. However, the Esdd quantification performances of BR-MVK is depend upon the rain gauge numbers used for blending with remote sensing product. This result highlights the needs for considering the rain gauge density while investigates the performances of BR-MVK to measure Esdd index.
3) Investigation the effect of rain gauge network on the stream-flow simulation performances
As the enhancement of satellite-gauge precipitation data is depend on the rain gauge density. This research also investigated the impact of rain gauge density on the performances of satellite gauge merging precipitation. Since BR-MVK yields the best performances among the investigated satellite-gauge blending approaches, BR-MVK is applied for merging remote sensing precipitation product GSMaP-MVK and the local rain gauge data in this section. The relationship between model performances with the Esdd index was established to analyze the impact of rain gauge density on the simulation skills of rain gauges and satellite-gauge rainfall estimations to not only make the comparisons of different river basins on the similar scale range but also visualizing the impact of AMP uncertainties on discharge predictions. Moreover, considering the advantage and limitation of each rainfall data source (rain gauge, remote sensing, satellite-gauge precipitation), this study also give the suggestion for appropriate data used for RR simulations in data sparse regions. In medium size catchments, the rain gauge only data appears to be more skillful than the satellite-gauge merging precipitation for all the resample rain gauge networks. However, in very huge catchment such as Da basin, BR-MVK constantly shows better stream-flow simulation skills than the gauge only data. This indicates the satellite-gauge precipitation has the potential to be the supplement information for rain gauge network design to ensure the rainfall information quality with less installed rainfall stations in very large sparse data regions.
v
The synthetic investigations of potential applications of Gauge and GSMaP-MVK in different climatic zones and topography conditions provide useful information and feedback for not only the developer of remote sensing precipitation products but also the users of those products in the field of rainfall runoff simulations. It is concluded that the performances of global satellite-gauge product are depend upon the merging algorithm and the number of the merged rain gauge. This outcome suggests either the consideration of gauge density threshold implementation in the blending algorithm or the increments of the blended rain gauges. The orographic warm rain process could be one of the impacts that cause the underestimations of the GSMaP-MVK in the targeted mountainous basins. It is suggested to consider the orographic effect in the GSMaP-MVK retrieval algorithm to deal with orographic warm rain process such as the retrieval algorithm of NOAA-CPC African Rainfall Estimation (RFE1). In addition, the well satisfactory stream-flow simulations of GSMaP-Gauge and the better performances of GSMaP-MVK than the very limited number of rain gauges and the corresponding BR-MVK in Da suggest the feasible utilities of those products in huge basins for the users. Moreover, the impressive superior performances of BR-MVK and relatively simpler MMF-MVK than the standard rain gauges in Da recommend users to incorporate the local ground measurements rainfall with the satellite precipitation in very big size basins to improve the rainfall information.
Esdd(MVK) map is useful tool for the rain gauge network designers to figure out the river basins which face the serious data sparse problems. In addition, the superior of satellite-gauge merging precipitation BR-MVK compared with the ground measurements in Da recommends the development of rainfall data set using satellite-gauge merging. It is promising for the rain gauge network decision makers for taking the uses of both rain gauge and satellite in configuring the appropriate rain gauge network to optimize the number of the rain gauges and define the geographic location of the rain gauge to optimize the use of rain gauges for stream-flow simulations when the pixel value accuracy and the spatial resolution of the satellite precipitation products would be improved in future.
Keywords: Remote sensed precipitation products, satellite-gauge merging, Rain-fall Runoff simulations, poorly gauged, Areal Mean Precipitation uncertainties.
vi
ACKNOWLEDGEMENTS
Throughout the past three year fantastic journey, I realized that PhD is really something we should experience in life. My PhD journey could not be accomplished and I could not enjoy the staying time in Japan without support, assistant and friendship from many people.
I would like to express my greatest gratitude to my main supervisor, Assoc. Prof. Hiroshi Ishidaira for his continuous, patient, careful support, guidance and inspiration from the very initial stages of this research conceptual inception and through ongoing advice and encouragement to this day. His professional guidance, patience, understandings give me the motivation and encourage me to think deeper and try to improve the research work. Especially, I learn how to make presentation of my research interests in clearer, more easily understandable and more logical way; and how to summarize the whole research framework from individual research components, which will benefit me for the rest of my carrier life.
I would like to express my special thanks to the member of my advisory committee: Prof. T. Suetsugi, Assoc. Prof. K. Nishida, Assoc. Prof. K. Souma, Assoc. Prof. Y. Ichikawa and Prof. K. Masutani for spending their valuable time on evaluating my research, and providing me with valuable comments and suggestions to improve my work. My special gratitude also goes to all members of Hydroscience and Hydraulic Engineering Research Group Seminar, who supported, instructed me in various ways during my doctoral study: Prof. Y. Sakamoto, Prof. F. Kazama, Dr. J. Magome, Dr. I. Inagaki, Dr. T. Sano, Dr. T. Nakamura, Dr. Kakizawa and Dr. V. Pandey.
I appreciate the kindly support from staff of GCOE project and International Student Center and Office of International Exchanges of University of Yamanashi, especially grateful to Ms. M. Ishihara, Ms. W. Sano, Ms. S. Maruyama and Ms. M. Katou.
My sincere thanks go to all my friends in GCOE program, who accompany, help me during my time in Japan: Dr. D.T.Nga, Dr. T. Ty, Dr. D.N. Khoi, Dr. T. Khujanazarov, Dr. J. Wang, Dr. L. Li, Dr. S. Shrestha, Dr. D. Amarathuga, Dr. S. Heng, Dr. H. Widyasamratri, Dr. M. Hashimoto, Dr. S. Salina, Ms. N.T.P.Mai, Mr. P.D. Udmale, Mr. S. Ning, Mr. Ono, Mr. I. Ebata, Ms. Y.N.Nguyen, Mr.M.V.Nguyen, Mr. V.B. Pham, Mr.H.N.Do, Ms.T.H.Pham, Mr.
vii
B.R. Thapa, Mr. S. Shrestha, , Mr. L. Alfaro, Mr. B. Malla, Mr. Y. Takabe, Mr. T. Kozono, Mr. Enokida and all other colleagues and friends.
I would like to acknowledge the GCOE program and Ministry of Education, Culture, Sports, Science and Technology, Government of Japan for providing me the scholarship to carry out my study in Japan. I am also thankful to Yamanashi prefecture, MILT (Ministry of Land, Infrastructure, Transport and Tourism), JMA (Japan Meteorological Agency), Vietnam Academy of Science, Water Resources University, Catalogue of rivers of Southeast Asia and the Pacific, and Technology and China Meteorological Data Sharing Service for providing the hydro-meteorological data. A special thank to Prof. J. Seibert for providing us a new version of hydrological model HBV software package and useful advices for dealing with the HBV running problems.
My deeply heartily acknowledgement is for my husband, my parents and my sisters, who support, encourage, give me strength to face with any challenge with their unconditional love, understanding and sharing.
viii
TABLE OF CONTENTS
ACKNOWLEDGEMENTS ... vi
TABLE OF CONTENTS ... viii
LIST OF FIGURES ... xi
LIST OF TABLES ... xv
LIST OF ABBREVIATIONS ... xvi
CHAPTER 1: INTRODUCTIONS ... 1
1.1 BACKGROUND ... 3
1.2 NEED OF THE RESEARCH ... 4
1.3 OBJECTIVES ... 5
1.4 ORGANIZATION OF DISSERTATION ... 6
CHAPTER 2: LITERATURE REVIEW ... 9
2.1 REVIEW OF UN-GAUGED RIVER BASINS’ ISSUES ... 11
2.2 REVIEW OF APPLICATIONS OF REMOTE SENSING IN HYDROLOGY FIELD ... 12
2.3 REVIEW OF REMOTE SENSING RETRIEVAL PRECIPITATION ... 14
2.3.1 INTRODUCTIONS ... 14
2.3.2 OBSERVING SATELLITE TYPES FOR PRECIPITATION RETRIEVAL ... 16
2.3.3 RESEARCH AND DEVELOPMENT SATELLITE MISSIONS FOR PRECIPITATION ESTIMATIONS ... 17
2.3.4 REMOTE SENSING PRECIPITATION RETRIEVAL METHODS ... 19
CHAPTER 3: STUDY AREAS, METHODS AND GENERAL FRAMEWORK ... 27
3.1 DESCRIPTION OF STUDY AREAS ... 29
3.2 MATERIALS ... 32
3.2.1 RAINFALL RUNOFF HBV MODEL ... 32
3.2.2 REMOTE SENSING PRECIPITATION PRODUCTS ... 39
3.2.3 REMOTE SENSING DATA PROCESSING ... 42
ix
3.3 GENERAL FRAMWORK ... 44
CHAPTER 4: EVALUATIONS OF THE ABILITY OF REMOTE SENSING PRECIPITATION FOR STREAM-FLOW SIMULATIONS ... 47
4.1 EVALUATION THE ABILITY OF GLOBAL REMOTE SENSING PRECIPITATION PRODUCTS FOR STREAM-FLOW SIMULATIONS ... 49
4.1.1 INTRODUCTIONS ... 49
4.1.2 EXPERIMENT DESIGNS ... 50
4.1.3 RESULTS ... 52
4.1.4 CONCLUSIONS AND DISCCUSIONS ... 65
4.2 EVALUATION OF SATELLITE-GAUGE MERGING PRECIPITATION METHODS FOR STREAM-FLOW SIMULATIONS ... 66 4.2.1 INTRODUCTIONS ... 66 4.2.2 METHODOLOGY ... 68 4.2.3 RESULTS ... 72 4.2.4 DISCUSSIONS ... 80 4.3 SUMMARY ... 81
CHAPTER 5: Assess of the possibility of remote sensing precipitation for AMP uncertainty evaluations and its impacts on rainfall runoff simulations ... 83
5.1 Assess the possibility of global remote sensing precipitation product for AMP uncertainty evaluations and its impacts on rainfall runoff simulations ... 85
5.1.1 INTRODUCTIONS ... 85
5.1.2 METHODOLOGY ... 86
5.1.3 RESULTS ... 90
5.1.4 DISCUSSIONS ... 97
5.2 Assess the possibility of satellite gauge merging precipitation for AMP uncertainty evaluations and its impacts on rainfall runoff simulations ...101
5.2.1 BACKGROUND ...101
5.2.2 RESULTS ...101
5.2.3 DISCUSSIONS ...104
x
CHAPTER 6: Appropriate precipitation data for stream-flow simulation in data sparse
regions ... 107
6.1 INTRODUCTIONS ... 109
6.2 EXPERIMENTAL DESIGNS ... 109
6.3 RESULTS ... 111
6.4 DISCCUSIONS ... 115
CHAPTER 7: SUMMARY OF DISSERTATION... 117
7.1 CONCLUSIONS ... 119
7.2 CONTRIBUTIONS ... 122
7.3 FUTURE RESEARCH DIRECTIONS ... 124
Bibliography ... 127
xi
LIST OF FIGURES
Figure 2.1 The WMO Global Satellite Observing System, 2009 ... 16
Figure 2.2 GPM Constellation of Satellites [28] ... 18
Figure 2.3 General cloud structures and the observations of instruments onboard satellites ... 20
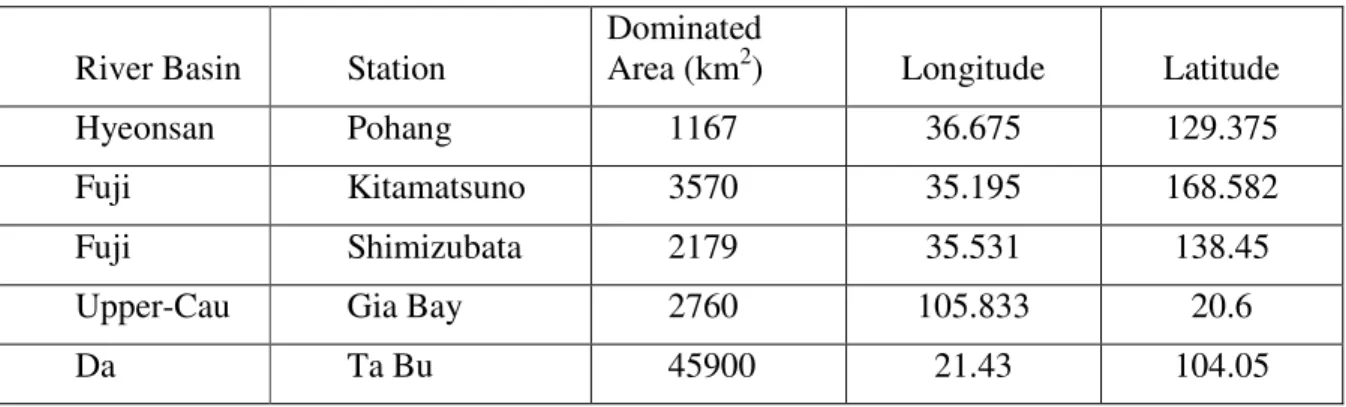
Figure 3.1a) Locations of targeted river basins (red points) and rain gauges, stream-flow gauges of b) Hyeonsan river basin c) Fuji river basin d) Da river basin e) Upper-Cau ... 30
Figure 3.2 Schematic structure of HBV model ... 32
Figure 3.3 Structure of HBV model (Seibert, 2000 [64]) ... 33
Figure 3.4 Schematic description of soil moisture routine ... 35
Figure 3.5 Flow chart of the GSMaP-MVK algorithm [67] ... 40
Figure 3.6 Schematic for calculation of average basin remote sensing data ... 43
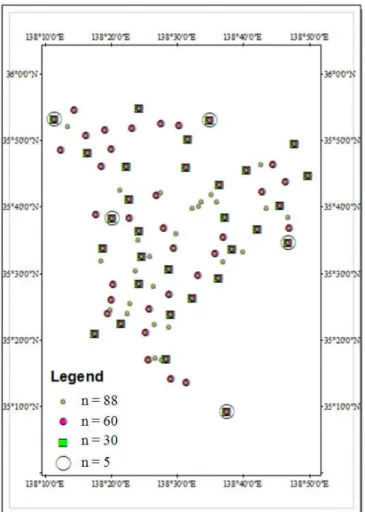
Figure 3.7 Gauge network of decreasing densities in Fuji basin ... 44
Figure 3.8 The overall framework of this study ... 45
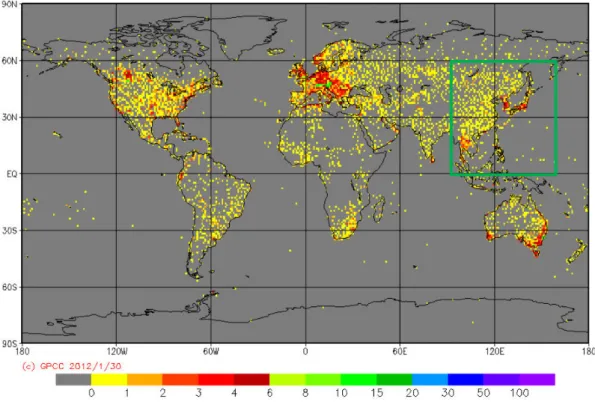
Figure 4.1 Ground rain gauge distributions, the targeted basins are located inside the green square (http:gpcc.dwd.de). ... 55
Figure 4.2 Accumulated precipitation of GSMaP-MVK (red line) and GSMaP-Gauge (blue line) vs ground measurements (green line) in a) Hyeonsan river basin b) Fuji river basin c) Da river basin and d) Upper-Cau river basin. ... 56
Figure 4.3 Seasonal Variation of basin average precipitation of GSMaP-MVK (red line) and GSMaP-Gauge (blue line) vs ground measurements (green line) in a) Hyeonsan river basin b) Fuji river basin c) Da river basin and d) Upper-Cau river basin. ... 56
Figure 4.4 Box plots of 6 parameters impacting on generating discharge for calibration period 2002-2003 in Hyeonsan River basin. ... 59
Figure 4.5 Box plots of 6 parameters impacting on generating discharge for calibration period 2002-2003 in Fuji River basin. ... 59
Figure 4.6 Box plots of 6 parameters impacting on generating discharge for calibration period 2002-2003 in Da River basin. ... 60
Figure 4.7 Box plots of 6 parameters impacting on generating discharge for calibration period 2002-2003 in Upper-Cau River basin. ... 60
xii
Figure 4.8 Model performances a) R2 and b) NS in 4 river basins of rainfall observations
(green columns), GSMaP-Gauge (blue columns) and GSMaP-MVK (red columns) for
Calibration period ... 62
Figure 4.9 Model performances R2 and NS in 4 river basins of rainfall observations (green columns), GSMaP-Gauge (blue columns) and GSMaP-MVK (red columns) for Validation period ... 62
Figure 4.10 Scatter plots between observed discharge and simulation discharge by rain gauge (green star) vs GSMaP-MVK (red star) and vs GSMaP-Gauge (blue star) in a) e) Hyeonsan, b) f) Fuji, c) g) Da and d) h) Upper-Cau. ... 63
Figure 4.11 Hydrograph of in a) Hyeonsan, b) Fuji, c) Da and d) Upper-Cau during validation period. ... 64
Figure 4.12 Summary of satellite-gauge merging precipitation approaches ... 68
Figure 4.13 Summary of grid-based satellite-gauge merging approaches. ... 69
Figure 4.14 Constant multiple factor approaches ... 70
Figure 4.0.15 Scheme of bias reduction approach ... 71
Figure 4.16 Scatter plot between rain gauge vs GSMaP-MVK (red star); vs AMF-MVK (yellow triangle); vs MMF-MVK (magnetic triangle) and vs BRMVK (light blue triangle) in Hyeonsan (a, d,g) and Upper-Cau (b,e,h) and Da (c,f,i). ... 74
Figure 4.17 Scatter plot between rain gauge vs GSMaP-MVK (red star); vs BaAMF-MVK (dark blue triangle); vs BaMMF-BaAMF-MVK (black triangle) in Hyeonsan (a, d) and Upper-Cau (b, e) and Da (c, f) ... 75
Figure 4.18 Model performances of R2 and Nash-Sutcliffe efficiency in a) b) Hyeonsan c) d) Upper-Cau river basin and in Da e) f) for Calibration and Validation processes ... 76
Figure 4.19 Scatter plot between observed discharge and simulation discharge by rain gauge (green star), GSMaP-MVK (red star), AMF-MVK (yellow triangle), MMF-MVK (magnetic triangle), BR-MVK (light blue triangle) in Hyeonsan (a, d, g, k) and Upper-Cau (b, e, h, l) and Da (c, f, i, m). ... 78
Figure 4.20 Scatter plot between observed discharge and simulation discharge by GSMaP-MVK (red star), BaAMF-MVK (dark blue triangle), BaMMF-MVK (black triangle in Hyeonsan (a, d) and Upper-Cau (b, e) and Da (c, f). ... 79
xiii
Figure 5.2 Relation between gauge density and the model performances (R2 and Nash
Sutcliffe efficiency) in Fuji basin ... 91
Figure 5.3 Relation between the model performances (R2 and Nash Sutcliffe efficiency)
with a) Esda(g) b) Esdd(g) c) Epta(g) d) Eptd(g) using gauge observations (g) e) Esda(MVK) f) Esdd(MVK) g) Epta(MVK) h) Eptd(MVK) using GSMaP-MVK (MVK) in Fuji river basin. ... 93
Figure 5.4 Relation between the model performances (R2 and Nash Sutcliffe efficiency)
with Esdd(MVK) in a) Hyeonsan basin b) Upper Cau basin c) Da basin ... 94
Figure 5.5 Relation between the model performances (R2 and Nash Sutcliffe efficiency)
with Eptd(MVK) in a) Hyeonsan basin b) Upper Cau basin c) Da basin ... 95
Figure 5.6 Procedure to specify the Esdd(MVK) values with the model performances
which are less than threshold value. ... 96
Figure 5.7 Map of a) Cvd(MVK) and b) Esdd(MVK) over main river basins in Vietnam
... 98
Figure 5.8 Map of a) Gauge number and b) Gauge density (km2/gauge) over main river
basins in Vietnam ... 99
Figure 5.9 Relation between the model performances (a) R2 and b) Nash Sutcliffe
efficiency) with Esdd computed using in Fuji basin.
... 102
Figure 5.10 Relation between the gauge density and the difference of Cvd between the
reference rainfall field and the BR-MVK which incorporates the different samples of rain gauge network ... 103
Figure 6.1 RMSE, COR and NDP of satellite-gauge BR-MVK for different rain gauge
density in a) b) Hyeonsan, c)d) Fuji and e) f) Da. ... 112
Figure 6.2 Model performances (R2 and NS) of satellite gauge precipitation BR-MVK
for different blending rain gauge density in dark blue dots, of different resample rain gauge network in hollow green dots, of GSMaP-MVK in red line in Hyeonsan. ... 113
Figure 6.3 Model performances (R2 and NS) of satellite gauge precipitation BR-MVK
for different blending rain gauge density in dark blue dots, of different resample rain gauge network in hollow green dots, of GSMaP-MVK in red line in Fuji. ... 114
xiv
Figure 6.4 Model performances (R2 and NS) of satellite gauge precipitation BR-MVK
for different blending rain gauge density in dark blue dots, of different resample rain gauge network in hollow green dots, of GSMaP-MVK in red line in Da. ... 115
xv
LIST OF TABLES
Table 1.1 Dynamic of the meteorological stations in Central Asia for the last decades
(Merkushkin, 2010 [4]) ... 4
Table 3.1 Summary of characteristics of 4 study basins: JP: Japan; VN: Vietnam, SK: South Korea ... 29
Table 3.2 List of flow stations in four targeted river basins ... 37
Table 3.3 Calibrated HBV Parameters and their ranges ... 39
Table 3.4 Characteristics of IR and MW data used for GSMaP-MVK retrieval ... 41
Table 4.1 Relationship between daily average precipitation over catchment between satellite-based precipitation and ground observations through several statistics from 2002-2005 ... 57
Table 4.2 Summary of statistics of basin average rainfall data ... 73
xvi
LIST OF ABBREVIATIONS
GSMaP-MVK Global Satellite Mapping of Precipitation moving vector with Kalman filter method
GSMaP-Gauge Gauge Adjusted Global Satellite Mapping of Precipitation CMORPH The Climate Precipitation Center morphing method
TRMM 3B42 Tropical Rainfall Measuring Mission (TRMM) Multi-satellite Precipitation Analysis (TMPA) 3B42 product
PERSIANN Precipitation Estimation from Remotely Sensed Information using Artificial Neural Networks
CPC Climate Prediction Center
HBV Hydrologiska Byråns Vattenbalansavdelning model GAP Optimisation using a genetic algorithm
BaAMF-MVK Basin average annual constant multiple factor satellite-gauge merging approach
AMF-MVK Grid based annual constant multiple factor satellite-gauge merging approach
BaMMF-MVK Basin average monthly constant multiple factor satellite-gauge merging approach
MMF-MVK Grid based monthly constant multiple factor satellite-gauge merging approach
BR-MVK Bias reduction satellite-gauge merging approach
RR Rainfall Runoff
AMP Areal Mean Precipitation
Esda Annual sample design index for AMP uncertainty quantification Esdd Daily sample design index for AMP uncertainty quantification Epta annual AMP error index consider gauge location
Eptd Daily AMP error index consider gauge location
Cv Coefficient of Variation
TPM Thiessen Polygon Method
R2
xvii
NS Nash Sutcliffe efficiency
COR Correlation coefficient
RMSE Root mean square error
BIAS Bias
1
CHAPTER 1
3
1.1 BACKGROUND
Water is one of the most important renewable resources that support food security, energy production in face of demand pressure from fast-growing industrial production and urbanization in developing countries, while precipitation is the major source for water to rivers and groundwater. Insofar as the results of being done researches, the climate change caused by the “greenhouse” effect tends to intensify the instability of the hydrological process, affecting the spatial and temporal distribution of water resources as well as the intensities and frequencies of extreme hydrological events. Therefore, in this context a dynamic assessment of hydrological process, i.e., assessing or predicting water resources and its variations over a basin in the past, at present and in the future would be a desirable work to ensure a proper water resource management and improve resilience of economy, society and environment. However, the lacking numbers of monitoring rain gauge networks challenges the quantification of the hydrological budget and water resources management, weather forecast in many regions across the world.
The un-gauged or poorly gauged river basins are one of the crucial concerning issues of many regions over the world, especially the developing counties due to inadequate number or time series of water cycle quantities. Over the years, a number of approaches have been launched and implemented for tackling the challenge of the prediction in un-gauged river basin which does not benefit from the past observational time series of the particular predicted hydrological response. As the blooming of many global and regional remote sensing meteorological products, one of the solutions for prediction in un-gauged river basin is the utilizations of remote sensing retrieval data instead of the traditional ground measurements.
Precipitation is one of the main inputs for rainfall runoff simulations. In the data poor catchments, the remote sensing precipitation data with high spatial and temporal coverage is important surrogate of traditional ground measurements for using as input of hydrological rainfall runoff model. The improvements of the quantity and quality of high spatial and temporal resolution of remote sensing data have progressed over the last decades and there are more and more researches of integrating remote sensing data into hydrological studies.
4
1.2 NEED OF THE RESEARCH
Conventional hydrological modeling requires calibration and validation using in situ observations. Lacking of spatial and temporal distribution of physical and hydro-meteorological parameters of the catchment hampered the applications of conventional hydrological modeling. Hence, in un-gauged or poorly gauged basins, where data are not available or too sparse, other alternative methodologies have to be adopted (Jakeman et al., 1993 [2]). In the circumstances that the numbers of hydro-meteorological stations are decreasing in many regions in the world (Georgieveskiy, 2007 [3]) (the obvious example is the case of Central Asia given in Table 1.1) and most of the river basins all over the world are likely to be un-gauged (Georgieveskiy, 2007 [3]), the demands for an alternative data sources for high time and spatial resolution and coverage such as space born data become more and more urgent than ever.
Table 1.1 Dynamic of the meteorological stations in Central Asia for the last decades
(Merkushkin, 2010 [4])
Country Number of meteorological stations
1985 1996 2004
Kyrgyzstan 95 62 31
Tajikistan 64 51 47
Turkmenistan 51 51 48
Uzebekistan 91 75 78
Precipitation is one of the most important factors that have great influence on the hydrological study and applications. The accurate quantitative precipitation estimates are crucial important for rainfall runoff simulation processes. Given that the global rainfall stations are inhomogeneous distributed across global and sparse in many remote difficultly accessible regions and practically non-existed over the oceans, remote sensing precipitation products which are economic, obtainable quasi global even in the physically inaccessible places of the conventional rain gauges are required to provide necessary information to assist the mentioned tasks.
5
There have been great efforts have been made to develop numbers of satellite rainfall retrieval algorithms for the last twenty years. Various inter-comparison programs have been implemented to assess the numerous rainfall algorithms and obtain the understanding of advantages and shortcuts of satellite based rainfall estimates techniques (Ebert and Manton, 1998 [5]; Laurent et al., 1998 [6]; Thorne et al., 2001 [7]). The gained conclusions from those programs are as following. The using microwave data (passive/ active) are superior to the VIS/IR or the combination of multi-source data in providing instantaneous rain rate and precipitation profiles. However, it is recommended to uses multi-source combination approaches for estimating the time integration, spatial average rainfall since they exploit the physically relation between MW and rainfall information with the excellent coverage over time and space of Geostationary satellite that is able to capture the space-time cloud evolutions. Since the multi-source blending algorithms permit to produce fine spatial and temporal surface rainfall, the satellite-precipitation products obtained from those techniques have great potential for stream-flow simulation capability. GSMaP-MVK and GSMaP-Gauge are multi-source satellite based precipitation with advance algorithm to produce averaged surface rainfall estimations over short time scales (1 hour) and very fine spatial resolution (0.1o x 0.1o) to satisfy more users in hydrology field. Although the relative large absolute errors at the fine scales should raise caveats for quantitative applications in hydrology field, it is still highly attempted and necessary to examine the suitability of those multi-source satellite-based precipitation products for hydrological applications at the basin scale. Under the situations that the rain gauges are extremely sparse in un-gauged or poorly gauged basins, and the alternative remote sensing precipitation sources face the problem of inaccuracy rainfall budget estimations due to some current remote sensing technique limitations, the question that how to use those two data efficiently for basin scale hydrology applications critically needs to be addressed to provide the key for future of prediction in data poor basins.
1.3 OBJECTIVES
The concerning issue is how to use the remote sensing precipitation data and limited number of rain gauge information efficiently for basin-scale hydrological applications in poor data basins. In order to address that issue, the broad objective of this dissertation focuses on evaluating the potential applications of satellite-retrieval precipitation estimates to
6
give the recommendation for appropriate precipitation data for stream-flow simulations in un-gauged or poorly gauged river basins. The specific objectives are as below:
1. Evaluate the ability of remote sensing precipitation products and satellite-gauge merging precipitation data for rainfall estimations and stream-flow simulations.
2. To assess the ability of remote sensing precipitation for evaluating the Areal Mean Precipitation (AMP) uncertainties.
3. To analyze the effect of rain gauge density for stream-flow simulations ability of gauge and satellite gauge merging precipitation.
1.4 ORGANIZATION OF DISSERTATION
This dissertation is organized in 6 chapters. The brief content of each chapter is presented as below. Chapter 4, 5, 6 report the main obtained results.
Chapter I: Introductions
This chapter introduces the challenging for hydrology prediction in un-gauged river basins and the application of remote sensing data sources in sparse data regions. The details of research objectives and the outlines of the entire works are pointed out in this chapter.
Chapter II: Literature Review
This chapter presents a literature review on issues of un-gauged basins, the application of remote sensing in hydrology field and remote sensing precipitation retrieval. The information and results of these studies are collected from the journal papers, reports.
Chapter III: Study areas, materials and general framework
The descriptions of targeted river basins are firstly presented, including hydro-meteorological conditions and topographic features. Moreover, the utilized materials including rainfall-runoff HBV model, the details and processing procedure of remote sensing precipitation products as well as the approach for eliminating the rain gauge from an existing network are also mentioned. In addition, the general framework of the whole dissertation is also discussed in this section.
7
The first part of this section (Section 4.1) provides a well organized and synthesized insight into the application for stream-flow predictions of some remote sensing precipitation estimations in several variety-sized river basins. The idea is to evaluate the ability of for stream-flow simulation of two global remote sensing precipitation products: satellite-gauge product GSMaP-Gauge and its original satellite only product GSMaP-MVK in several river basins in East and South East Asia under wide range of climate conditions and different degree of complex topography terrains. In addition, the adjustment of hydrological model parameters due to the precipitation estimates uncertainty of remote sensing precipitation is also investigated.
It is concluded in section 4.1 that the satellite-gauge precipitation is depend on the rain gauge density and the blending algorithm. Therefore, the aim of the second part of this Chapter (Section 4.2) is assessing several blending methods to produce daily precipitation from remote sensing precipitation and rain gauge observations, which are not computation expensive. Its purpose is creating satellite-gauge rainfall data as the input for hydrological model for investigating the stream-flow simulation capability in different climate zones.
Chapter V: Assess the possibility of satellite precipitation for Areal Mean Precipitation (AMP) evaluations
While remote sensing precipitation data are investigated for stream-flow simulation skills, chapter 5 focuses on evaluating the ability of satellite based precipitation for the Areal Mean Precipitation (AMP) errors quantifications using several indices including two proposed AMP error indices Epta and Eptd that account for not only the gauge density, the rainfall spatial variability but also the location of the rain gauges. In addition, a map of AMP error over main river basins in Vietnam is produced to visualize the degree of AMP uncertainties due to limitation of rain gauge density. Based on this map, the basins with seriously lacking of rain gauge stationed could be viewed at the first glance.
Chapter VI: Investigate the effect of rain gauge network on the stream-flow simulation performances
While section 4.2 assesses the different satellite-gauge blending algorithms, this chapter investigates the effects of rain gauge density on the rainfall estimations of satellite-gauge merging precipitation, and analyzes the impact propagation to stream-flow simulation ability.
8
Because satellite-gauge precipitation approach BR-MVK gives good performances in the river basins under different climate conditions (Section 4.2) and Esdd(MVK) has the capability to assess the AMP uncertainty (Chapter 5.1), they are applied in this section. The stream-flow prediction performances of BR-MVK is in comparison with that of the corresponding rain gauge network for all the resample rain gauge density cases in several river basins under different climate conditions and various sizes in order to give the recommendation for appropriate type of precipitation data in data sparse regions. The relationship between the model performance indices (R2 and NS) with the AMP error index Esdd(MVK) are generated to analyze the behavior of discharge simulation skill in all river basin on the similar ranges of rainfall input uncertainties.
Chapter VII: Summary of dissertation
This chapter summarizes the results, contributions of this research, and gives the recommendations for the future works.
9
CHAPTER 2
11
This chapter presents a literature review on issues of un-gauged basins, the application of remote sensing in hydrology field and remote sensing precipitation retrieval. The information and results of these studies are collected from the journal papers, reports.
2.1 REVIEW OF UN-GAUGED RIVER BASINS’ ISSUES
It has been a long history since hydrological models were developed and used as tools for simulating the hydrological process. In order to calibrate and validate model with acceptable confidence, there are still some issues that need to be addressed. The data availability of water cycle is one of the crucial aspects, especially in the third world countries which are usually data poor basins.
According to the definition given by IAHS (International Association of Hydrological Sciences), the un-gauged basin refers to the one with inadequate records (in terms of both data quantity and quality) of hydrological observations to enable computation of hydrological variables of interest (both water quantity or quality) at the appropriate spatial and temporal scales, and to the accuracy acceptable for practical applications (Sivapalan et al., 2003) [8]). The lacking of in-situ hydro-meteorological ground observations in turn leads to capacity shortages for predicting land surface processes and water resources management. The traditional ground observation network is reducing in Africa, Central Asia, South-East Asia and even including North America and Russia (Georgieveskiy, 2007 [3]). In Central Asia, because of insufficient budget, most of climate stations are concentrated outside of significant snow and precipitation accumulation areas; many remote stations in important accumulated area has been abandoned or are staffed by minimally qualified observers (Merkushkin, 2010 [9]). Thus, un-gauged or poorly gauged are concerning issues worldwide, especially in developing country.
There have been a number of approaches have been implemented for tackling with the challenges of data limitation in un-gauge or poorly gauged basins. The early attempts to model the un-gauged catchment was proposed by Mosley, 1981 [10] so called geographical proximity approach. This method simply used the parameters value derived from the neighboring sites where data were available. The limitation of this method is that even nearby catchments can be very different with respect to their hydrological behavior.
12
Relating model parameters and catchment characteristics in a statistical manner which is studied by Jakeman and Hornberger, 1993 [11] and Post et al., 1998 [12] is probably the most common approach. The core of this method named regionalization or spatial generalization is to calibrate a specific model structure in as large as possible number of gauged catchments in order to derive the relation between the model parameters and catchment characteristics.
Another alternative approach called one-way coupled simulation use the simulated rainfall output of a meteorological model directly as the input to hydrological model. This approach benefits the precipitation information forecasts and flood event ahead of its occurrence (Bartholmes, 2005 [13]) and for dam constructions (Nagai et al., 2008 [14])
Finally, the arising applications of the remote-sensing data are considered nowadays a promising way to fill the gap of the problem of sparse data. The blooming of regional and global satellite-based products has opened up new large-scale hydrological applications in data-sparse catchments. Particularly, hydrological models can benefit from the good spatial coverage and distributed nature of satellite-based estimates. The improvement of the quantity and quality of high spatial and temporal resolution of remote sensing data have progressed over the last decades and there are more and more researches of integrating remote sensing data into hydrological studies.
2.2 REVIEW OF APPLICATIONS OF REMOTE SENSING IN HYDROLOGY FIELD
One of the problems that bottleneck the quantification of the hydrological budget is the availability of the data. Fortunately, remote sensing techniques become important tool in analyzing the Earth’s surface observation, and hence their broad spatial coverage and repeat temporal coverage supply promising alternative data source for hydrologic analysis to overcome the data sparse problem (Lakshmi, 2004 [15]). It has been reported that various meteorological data sets can be directly or indirectly derived via remote sensing that have yielded useful information for hydrologists which leads to significantly changes in the water resources assessment and management methodology. Insofar, remote sensing has been applied widely for surface water body delineation, estimations of hydro-meteorological variables such as temperature, precipitation, evaporation, soil moisture and land surface
13
characteristics and so on. The use of remote sensing data in hydrological model can be categorized into three broad classes according to the levels of utility. The basic one is simply to identify items of interest such as snow covered areas or plumes using remote sensing imagery. An advanced level is the interpolation of satellite data such as land cover, geological features, or other hydrological parameters and is often used in conjunction with existing hydrological models. The last level involves the application of digital data to estimate hydrological parameters directly. This usually requires a validation of the products based on the known hydrological observations. All three categories have been demonstrated successful application in hydrological studies, with the second class being particularly well suited to hydrological models. Recently, high resolution satellite data is important aid for near real time monitoring of flood, drought events and irrigation management.
Remote sensing precipitation estimates have the potential to greatly improve spatially-distributed hydrological modeling capacity (Pan et al., 2010 [16]) since they offer effective and economical means of calculating areal rainfall estimations (Artan et al., 2007b [17]) with high spatial and temporal coverage. Khan et al., 2011 [18] presented a methodology based entirely on satellite remote sensing data precipitation, land cover, potential evaporation, etc… to set up and calibrate a hydrological model, simulate the spatial extent of flooding, and evaluate the probability of detecting inundated areas. They concluded that satellite-based data sets have the potential to improve simulation and prediction of the spatial extent of floods. A similar conclusion was performed by Stisen et al., 2008 [19] using satellite derived LAI, precipitation and potential evapotranspiration inputs for driving a distributed MIKE SHE model. They demonstrated that the application of remote-sensing information exhibited comparable model performance with aspect to the conventional gauged-measurements. It can provide a better spatial distribution since the conventional model is strongly influenced by the location of the stations and their representativeness of the regional condition. Bitew and Gebremichael, 2011 [20] investigated the performance of different rainfall products among each other for driving distributed SWAT model and found that part of the products showed a highly comparable result with the rain gauged data while the rest of them can only capture the general fluctuation with a low efficiency. Sagar et al., 2014 [21] estimated the flow generated in Brahmaputra river basin in Nepal using several high resolution satellite rainfall products concluded that there is a high potential use of satellite rainfall in data scarce regions.
14
Stisen and Sandholt e al., 2008 [22] highlighted the input specific model calibrations for different remote sensing precipitation products. In another word, one hydrological model cannot be calibrated using one rainfall input and used with another because even experience equal mean areal rainfall, different products may show significant difference in temporal and spatial dynamics.
There have been some efforts to improve the hydrologic simulation by merging different satellite precipitation products or with the gauge observations. In order to enhance the flood forecasting accuracy, Chiang et al., 2007 [23] combined gauge observations and satellite-based precipitation using recurrent neural network model in Wu-Tu watershed in Taiwan. He concluded that the merged method can efficiently combine the satellite and rain gauge data to improve the accuracy of flood forecasting. Blending multiple satellite-derived precipitation products with the purpose to exploit their own merits of capturing rainfall events to improve the hydrologic predictions has been also studied by some researchers Yilmaz et al, 2010 [24] and Gebregiorgis and Hossain, 2011 [25].
One of the weaknesses of the remote-techniques is that different satellite products may display significant differences in temporal and spatial dynamics. All products are affected by more or less uncertainties and biases according to the algorithms used to implement those products. This is especially the case for the rainfall data, since it is considered as the most determining factor in distributed hydrological models (Andersen et al., 2002b [26]). Thus, the absolute accuracy of satellite rainfall products is questionable and remains subject of on-going worldwide assessment (Ebert et al., 2007; Ebert, 2011) [27]). Nevertheless, remote sensing precipitation products provide unique information on spatial and temporal extent of rainfall field quasi global, which greatly benefits the data poor regions.
2.3 REVIEW OF REMOTE SENSING RETRIEVAL PRECIPITATION
2.3.1 INTRODUCTIONS
High accurate time and space estimates of precipitation on global basis have been a major scientific goal for proper agriculture management, hydrological applications, and weather forecast in order to mitigate the disaster hazards worldwide. Despite its crucial importance, the human knowledge of precipitation on a global basis is unsatisfactory due to insufficient coverage of rainfall station which is conventional way to collect the rainfall data.
15
Rainfall station network has the great shortages to grasp the spatial variation of the precipitation field due to inappropriate spatial coverage. It is difficult to obtain dense network of the precipitation stations over remote, mountainous and over oceans due to physical accessibility barriers. Since the year 1970s, there have been great efforts to overcome the issue of spatial coverage by applications of remote sensing techniques to obtain rainfall information. Passive or active sensors operating from space-born platforms are able to capture the spatial variation over the large area and provide the information of rainfall occurrence, rainfall rate, rainfall accumulations, precipitation state (liquid/ solid). Precipitation data, namely products, are obtained at various levels. The term level indicates the processing quantity that data has been through, from the raw instrument counts to precipitation model outputs derived mathematically using raw data input. Insofar, there has been blooming of global and regional remote sensing algorithms to produce satellite-based precipitation estimates. The history and principles and details as well as strengths and weakness of them are given in the following sub section 2.3.4.
Quantitative precipitation information including multiple sensor quantitative precipitation estimation and very short term quantitative precipitation plays an important role in assisting the comprehensive hydrology and ecosystem modeling. The significant multi-dimensional practical applications of remote sensing precipitation are listed as following: 1. Global water circulation model set up.
2. Research on global warming and climate changes.
Remote sensing precipitation data is used for monitoring the variation in rain rates and raining area caused by climate changes.
3. Improvement the accuracy of weather forecast.
Operations of climate system monitoring and Numerical weather prediction require high accuracy, high frequency and short latency of data delivery, especially for weather information for warning and advisories. Therefore, satellite precipitation is critically used to provide initial conditions for global, regional and other forecasts.
4. Management of water resources.
Remote sensing precipitation is helpful for monitoring and warning flood, flash flood, river management, dam bondage management.
16
2.3.2 OBSERVING SATELLITE TYPES FOR PRECIPITATION RETRIEVAL
Satellite estimates of precipitation are derived from a range of observations obtained from many different sensors. These sensors are carried by satellites belong to global satellite observing system (Figure 2.1). Those satellites are generally classified into two categories: Geostationary satellites and low earth orbit satellites.
The geostationary (GEO) satellites
The geostationary satellites or geosynchronous satellites spin around the Earth at the same speed as the Earth rotates with the altitude 35,786 km above the Earth equator. Therefore, their locations appear stable to the Earth, which enables each geostationary satellite to observe a specific constant large region (about one third) of the Earth's surface on a frequent and regular basis. They have some common attributes: they typically carry visible (VIS) and infrared (IR) sensors, acquiring images nominally every 30 min. These satellites provide an unrivalled platform for continual observations but are limited in the Polar Regions by the unfavorable viewing angle at high latitudes.
Low Earth orbiting (LEO) satellites
(http://www.wmo.int/pages/publications/bulletinarchive/archive/59_1_en/59_1_mohr_en.html) Figure 2.1 The WMO Global Satellite Observing System, 2009
17
The low Earth orbit satellites have an elliptical or circular orbit around the Earth with the ranges of altitude from 160 km to 2000 km. The orbit period at these altitudes varies between ninety minutes and two hours. The radius of the footprint of a communications satellite in LEO varies from 3000 to 4000 km. The maximum time during which a satellite in LEO orbit stays above the local horizon for an observer on the earth is up to 20 minutes. Therefore, they pass a particular ground location just several times per day. These satellites carry a range of instruments capable of precipitation retrievals, including multichannel VIS/IR sensors, and passive microwave (PMW) sounders and image.
2.3.3 RESEARCH AND DEVELOPMENT SATELLITE MISSIONS FOR PRECIPITATION ESTIMATIONS
A number of operational and “research and development" satellite missions have been used for precipitation estimation with the great effort to provide global observation of rain and snow for advanced understanding of Earth’s water and energy cycle, enhance forecasting of extreme events and provide accurate and timely information to direct benefit. The Defense Meteorological Satellite Program (DMSP) satellites series of Special Sensor Microwave/Imager (SSM/I) and Special Sensor Microwave Imager Sounder (SSMIS) provide measurements of naturally emitted microwave (MW) radiation from the Earth and its atmosphere. The AQUA satellite includes the PMW Advanced Microwave Scanning Radiometer-Earth Observing System (EOS) (AMSR-E). PMW sensors typically have swath widths in the order of 1,500 km and resolutions, variable with observational frequency, of between 4 km and about 50 km. In addition, the AQUA mission also carries the VIS/IR MODerate resolution Imaging Spectro- radiometer (MODIS), the latter also carried onboard the TERRA satellite. The MODIS instrument, with 36 VIS/IR spectral bands enables information on cloud properties (such as cloud drop nadir and phase) to be retrieved.
The Tropical Rainfall Measuring Mission (TRMM) is a joint space mission between NASA and JAXA (Japan Aerospace Exploration Agency). The satellite was launched in 1997 with the aim to monitor and study tropics and subtropics rainfall, where two thirds of the world’s rainfall occurs. TRMM was the first dedicated precipitation satellite and has been the key in the development and improvement of satellite rainfall estimation techniques. It carries a range of instruments which allow direct comparisons to be made between VIS, IR,
18
PMW and active MW observations. The Precipitation Radar (PR) was the first space borne precipitation radar, capable of sampling precipitation both vertically and horizontally which returned data made into 3-D imagery, enabling scientist to see the internal structure of storms for the first time, although with a limited swath of 210 km. Other instruments include the TRMM Microwave Imager (TMI), the Visible and infrared Scanner (VIRS), and the Lightning Imaging Sensor (LIS). The non sun-synchronous nature of its orbit allows samples across the full diurnal cycle to be made. Other current active MW sensors include the nadir pointing Cloud Profiling Radar (CPR) on the Cloud Sat mission.
Figure 2.2 GPM Constellation of Satellites [28]
TRMM satellite has provided huge volumes of precise precipitation measurements and valuable information for use in climatology such as rainfall distribution, three dimensional structure and stages of development of tropical cyclones. Due to insufficient fuel to maintain orbital altitude, NASA and the JAXA stopped TRMM’s science operations and data
collection on April 8, 2015 after the spacecraft depleted its fuel reserves. Because of obvious
benefits of precipitation estimates from space obtained by TRMM, GPM (Global Precipitation Measurement Mission), which is cooperative international Earth science mission with the prime agencies of NASA and JAXA, has been built on the work of TRMM to expand the mission of TRMM for improving climate, weather and hydrological forecasts across the world. GPM mission is instituted by core observatory satellite and the constellation satellites (Figure 2.2). The Core Observatory satellite was successfully
19
launched from Tanegashima Island, Japan, on February 27th, 2014. It is provided by NASA and JAXA, flying at the distance of about 407 kilometers above the Earth and covering the Earth from 65oS to 65oN. Data collected from the Core satellite serves as a reference standard since it makes accurate rainfall measurements, collects information on cloud dynamics and rainfall process. Those data will unify precipitation measurements from research and operational satellites launched by a consortium of GPM partners in the United States, Japan, France, India, and Europe. Therefore, the GPM satellites can provide quasi entire global observations every 2-3 hours. The GPM Core satellite is an advancement of TRMM with two carrying science instruments: the GPM Microwave Imager (GMI) and the Dual-frequency Precipitation Radar (DPR). The GMI is a conical scanning, polarization-sensitive, multi frequency passive radiometer that captures precipitation intensities and horizontal patterns and the total precipitation within all cloud layers. On the other hand, the active radar DPR provides insights into the three dimensional structure of precipitating particles layer-by-layer and within clouds. Together these two instruments provide a database of measurements against which other partner satellites’ microwave observations can be meaningfully compared and combined to make a global precipitation. Because light rain and falling snow account for a important portion of precipitation occurrence in middle and high latitudes, the GPM instruments enhance the capabilities of the TRMM sensors to detect falling snow, measure light rain, and provide, for the first time, quantitative estimates of microphysical properties of precipitation particles.
2.3.4 REMOTE SENSING PRECIPITATION RETRIEVAL METHODS
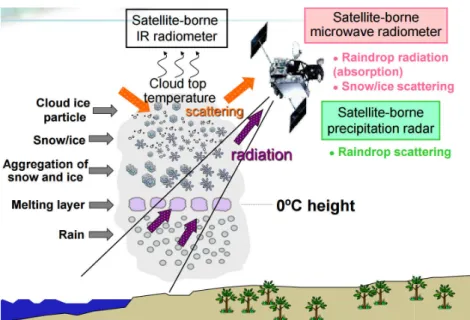
The virtually overview of hydrometeors information can be obtained from different sensors on board of different geostationary satellites and low earth orbit satellites are shown in Figure 2.3. In general, there are three remote sensing radiometers to sense the rainfall cloud: the VIS/IR radiometer, Passive Microwave radiometers and Active Microwave radiometer of precipitation radar. Based on those three satellite delivered data and other data sources such as rain gauge and ground radar, the precipitation retrieval methodologies fall primarily into three main categories based upon type of observation: primarily VIS/IR techniques, PMW techniques and multi source merging techniques. The principles, limitations and development history is describes for each categories in the following paragraphs.
(http://e-learning.connect-sia.o 22_Kubota.pdf)
Figure 2.3 General cloud struc
VIS/IR methods
The principle of VIS/IR m Albedo (the ratio between the clouds leads to the phenome surface in the VIS spectrum. higher probability that the thi rainfall are related with the clo be sensed using the IR data, t and poor. Consequently, VIS information can be derived f stratus is typically smooth, wh near IR (NIR) data can provid reflected/emitted radiances aro the microphysical properties operations. IR imagery that m useful, and is available night taller clouds with colder clou
20
ia.org/pluginfile.php/3353/mod_resource/conte ructures and the observations of instruments on
methods is that clouds are observed in IR and the reflected solar radiation and the incoming
enon that the clouds appear relatively brigh . Because, bright clouds are more likely to thick clouds result in rainfall, the independent
cloud properties measured by VIS images. The , thus the correlation between brightness and S imagery is used in conjunction with other ob
from cloud top texture obtained from VIS while convective clouds tend to be more “lump
ide properties of cloud top particles (size and around 1.6, 2.1 and 3.9 µm have proved very es of clouds, despite some being restricted measures the thermal emissions from objects i ht and day. Heavier rainfall tends to be asso oud tops. By observing cloud top temperature
tent/1/IHP2012-11-onboard satellites
nd visible. The high g solar radiation) of ghter than the Earth o be thick, and it is ent measurements of he rain drops cannot d rainfall is indirect observations. Useful IS imagery such as: mpy". Multi channel d phase). The use of ry useful in studying ted to full daylight s is potentially more sociated with larger, ures (CTT) a simple
21
rainfall estimate can be derived. However, the CTT to rainfall relationship is indirect, with significant variations in the relationship during the lifetime of a rainfall event, between rain systems, and between climatologically regimes. For example, relationship between CTT and rainfall cannot discriminate the convective part of the system producing heavy rainfall from the stratiform part of the system or cirrus clouds with a cold cloud top, which do not produce rain (Jobard, 2001 [29]). Nevertheless, IR-based techniques benefit from a degree of simplicity coupled with the availability of the data for 24 hours. Barret and Martin, 1981 [30] overviewed of early algorithm and methods of VIS and thermal IR techniques, classified the VIS/IR rainfall estimation methods into several groups: cloud indexing, bi-spectral, life history and cloud model-based. All these methods use the VIS/IR data provided by instruments on board of geostationary satellites, thus the providing images are at good temporal and spatial coverage. Despite the indirect physical relation with the rain rate, the VIS/IR techniques are mostly appropriate for large and climatic scales (Jobard, 2001 [29]) due to some reasons. Firstly, the VIS/IR data are sampled at good spatial and temporal resolution, for example, Meteosat provides VIS/IR data every 30 minutes with the spatial resolution of 5 km. Secondly, the good relationship between the cumulated and averaged rainfall over large surface area or consider integration of time with the computed IR index such as GPI (GOES Precipitation Index) index proposed by Arkin, 1979 [31] can be obtained.
Passive microwave methods
The Earth naturally emits low levels of MW radiation which may be passively sensed by radiometers. This upwelling radiation is primarily attenuated by the presence of precipitation sized particles. Rainfall can be identified from passive and active microwave satellite observations based upon two physical processes: emission from rain droplets which lead to an increase in MW radiation and scattering caused by precipitating ice particles which leads to a decrease in MW radiation. The attributes (type and size) of hydrometeors are sensed by the frequency signal of the upwelling radiation. The common range that passive MW signals interact with the water particles or droplets is between 19.3 and 85.5 GHz. At low frequency (below 20 GHz), ice particles which usually present in the upper layer of the clouds are transparent, absorption/ emission from the liquid rain drops is predominant mechanism, relation between MW signal at those frequency and rain rate at those frequency is direct. Since the background radiometric signal over the ocean is low and constant
![Table 1.1 Dynamic of the meteorological stations in Central Asia for the last decades (Merkushkin, 2010 [4])](https://thumb-ap.123doks.com/thumbv2/123deta/7694927.1216862/23.892.124.773.614.791/table-dynamic-meteorological-stations-central-asia-decades-merkushkin.webp)