Abstract
Using the technique of panel orbit analysis, this paper investi-gates the long run dynamic of the driving forces in the structural transformation of 38 African economies from 1970 to 2013. It seeks to understand how factors such as sub-regional context, geographi-cal conditions, institutional settings and the fact of being a donor-supported or less donor-supported country affect this economic dynamic. The paper draws implications for investment policies relative to ag-ricultural development and food security in sub-Saharan Africa.
Keywords:
sub-Saharan Africa, orbit analysis, structural change, driving forces
In the search of the driving forces of
sub-Saharan Africa’s economy:
an approach from orbit analysis
R
AJAONARISON, Haja Michel
*RITSUMEIKAN INTERNATIONAL AFFAIRS Vol.14, pp.23-54 (2016).
* PhD candidate, Graduate School of International Relations, Ritsumeikan University, Kyoto Japan. Email: [email protected]. The Author is grateful to Professor Masahiko Itaki, Professor Hideaki Ohta and Professor Pascale Hatcher for the useful advice and suggestions on an earlier version of this paper (GSIR2015-1 working paper series).
1. I
NTRODUCTIONIn 2007-2008, the world was facing an amalgam of crises deriving from fi-nance, climate and food (Addison & Tarp, 2010). This turnaround sparked a general malaise particularly for food security in sub-Saharan Africa (SSA) where a great proportion of people still live under the poverty line $1.25 a day. Poverty has never experienced a major recrudescence in such short period of time. The estimation of the World Bank (2012) underlines that since 2008, about 40–44 million people in low-income countries were pushed back into poverty due to the price spikes of foodstuffs.
These crises have also engendered new practices motivated by the quest for profit and security. Cotula (2012) explained that Western coun-tries were seeking new opportunities via speculation on agricultural com-modities whereas emerging economies such as China, India and countries in the Gulf were trying to secure their future supply of food.
Agriculture and food security have become hotly debated topics in in-ternational forums in recent years as they constitute a global threat to the world stability. The United Nations (UN) and the G20, with the Global Ag-riculture and Food Security Program (GAFSP) in 2009, the World Econom-ic Forum with the New Vision for AgrEconom-iculture created the same year, the G8 with the New Alliance for Food Security and Nutrition (New Alliance) in 2012, The World Bank Group Agriculture Action Plan in 2013, the Afri-can Union with the Malabo Declaration on Accelerated Agricultural Growth and Transformation for Shared Prosperity and Improved Liveli-hoods in 2014 – are few examples of initiatives that have emerged since 2008. Furthermore, individual states, private companies, civil societies and Non-Governmental Organizations are also harnessing their efforts to work on a comprehensive agenda towards a sustainable food and agricul-tural system to combat poverty and eradicate hunger.
The rush in land also prompted hasty policy decision in which SSA was tagged as a main player. To open-up a new space to deal with food in-security, SSA was classified by the World Bank as an agriculture-based economy owing to the facts that agriculture represents an important share in the Gross Domestic Product (GDP) and that the majority of poor rely upon on agriculture as a source of livelihood, income and food (World Bank, 2007). On the top of these criteria, the importance of growth stem-ming from agriculture has also been used in the discourse of the policy
makers in agricultural development due to the fact that its incidence on poverty reduction is stronger compared to the other sectors of the economy (De Janvry & Sadoulet, 2010). However, the recent changes in policy by various multilateral organisations are sending signals to a particular group of interests, for the most part, the giant corporations that are domi-nating the world food system (Rajaonarison, 2014). This economic classifi-cation matters as it totally ignores the fact that the structure of SSA s economy already experienced substantial transformation within time and space. If not addressed properly, such signals might reverse the path the structural transformation of the region.
Using the technique of panel orbit analysis, this paper investigates what is driving the economy of SSA within the framework of structural transformation. It seeks to understand what is leading the economy from a long run perspective and how factors such as regional location, geo-graphical condition, and the fact of being a donor-supported or less sup-ported country affect this dynamic. It draws policy implications for the re-gion with respect to the recent massive flow of investments in agriculture. This paper argues that SSA has already shifted from being an agriculture-based economy and therefore, agricultural development strategies should seek to embrace the dynamics of the other sectors as they are likely to ex-ert influential policy leverage in decision making.
The organisation of this paper is as follows: the second section pre-sents the perspective of panel orbit analysis. The ensuing section describes the application of the method to the concept of structural transformation. Section four reports the results of the analysis. Discussions relative to the results are presented in section five. The last section concludes.
2. T
HE PERSPECTIVE OFORBIT ANALYSISDevelopment experts, particularly mainstream economists have always been fascinated by the study of the factors that can induce economic growth, which in recent years was central to poverty reduction. As a mat-ter of fact, a wide range of limat-terature is supporting the positive relations of growth on poverty reduction (Nallari & Griffith, 2011, p. 64). The two au-thors presented stylized facts on the development of growth research from the 1990s to 2005, and identified different positive empirical results stem-ming from: education, financial development, low government burden,
in-frastructures, governance, trade openness and macroeconomic stabiliza-tion (Nallari & Griffith, 2011, p. 58-59). However, despite the progresses in the field, changes in political, economic, geographic and institutional fac-tors are also triggering variations of the causes and effects on economic performances.
From the viewpoint of the mainstream economic literature inspired by the modernisation theory, agricultural development can be understood as an early stage of structural transformation (Rostow, 1960, p. 4-16). Accord-ing to the mainstream school, structural transformation is both equally a cause and effect of economic growth (Timmer, 2009, p. 5). Syrquin (2006, p. 602) points out the main changes highlighted in development literature driven by structural transformation: increase of the rate of accumulation, changes in the sectoral composition of the economic activities character-ised by industrialisation, relocation of the economic activities in urban ar-eas, demographic transition and income distribution (Kuznets, 1966; Lin, 2012, p. 3; Syrquin, 2006, p. 602; Timmer, 2009, p. 5).
As explained above, public policy decisions are based on empirical studies that seeks to establish causal relations between growth and fac-tors favouring it. In modern economics, the causal relations between two or multiple variables is often approached from the perspective of the Granger causality . This method pioneered by the Nobel Laureate Grang-er (1969) rests on the assumptions that one a sGrang-eries cause anothGrang-er one if the knowledge of the past of the first series improves the prediction of the second one. Since its publication, the method has been widely used in eco-nomic models. However, little evidence has been presented regarding the role of agriculture in growth and its role in the expansion of other modern sectors postulated by the theory of structural transformation. Tsakok and Gardner (2007) while investigating whether agriculture is a primary en-gine of growth stated that the results of econometric analyses are incon-clusive and even contradictory with one another . Despite the proposal of additional evidences by De Janvry and Sadoulet (2010) or recommenda-tion on methods by Gollin (2010), empirical constraints remain stringent. The method is based on rigorous assumptions that consistently require the transformation of the data and the adjustment of the estimations. Within that process, data might lose their real meaning and validity if too many transformations or too many adjustments are applied without a cau-tious definition of the assumptions. Berk (2010) points out that for both
diagnostics and the remedies, new untestable assumptions are required even before the one gets to a number of thorny technical assumptions . Therefore, to avoid error and biases as a result of data transformation and adjustment of the estimations, orbit analysis is proposed as an alternative method to analyse the structural transformation of 38 countries of SSA.
3. O
RBITANALYSIS:
DESCRIPTION,
APPLICATION ANDASSUMPTIONSOrbit analysis is a statistical technique developed by Itaki (2014) to reveal leading-following relations between two or multiple variables in a consist-ent time series. Several simple applications of the method are used in eco-nomic, financial, political or business analyses. Cairo (2013, p. xix) for in-stance, illustrates the relationship between the GINI index versus the GDP in Brazil in 1980-2011 under different presidential terms. The re-sults indicate that across time, inequality was falling as GDP was increas-ing, particularly under President Lula. Parlapiano and Giratikanon (2013, October) used the same tool to exemplify the US Federal Reserve System s Chairman Janet Yellen s long run analysis of inflation and unemployment in the US.
Adapted to a more sophisticated level, the method assumes that a pulling and being-pulled relationship exists between the analysed varia-bles. That is to say, there is a traction force between two variables x and y which interaction across time puts forth the position of being a leading or a following variable.
Leading in the sense of orbit analysis means leading changes in oth-er variables or hoth-eralding their changes in a kind of chain reactions among variables. Although the power of traction exerted by a leading vari-able might be weak, its cumulative effect (or resultant force effect) would be massive and could tangle large variables one after another.
According to Itaki (2014), in principle, a minimum of three points is needed to calculate the direction of orbit rotation. The calculation is based on the parallel transport of a triangle formed by the three points. The in-verse tangent is then used to calculate the degree of the newly formed an-gle. If the angle is between 0 and π in radians (i.e. between 0 and 180 in degree), the rotation is anticlockwise; if the angle is between 0 and -π in radians (i.e. between 0 and -180 in degrees), the rotation is clockwise (Ita-ki, 2014). Six patterns therefore can be observed from this process:
1) Positive correlation and an anticlockwise rotation (x leading, y fol-lowing);
2) Positive correlation and a clockwise rotation (y leading, x following);
3) Negative correlation and a clockwise rotation (x leading, y following);
4) Negative correlation and an anticlockwise rotation (y leading, x fol-lowing);
5) An anticlockwise circular movement; 6) A clockwise circular movement.
The variables are computed with an Excel spreadsheet designed by Itaki 1). This treatment reports the change in direction, the slope, the rota-tions in radian and in degree as well as the 5, 7 and 9 years moving aver-age of each variable.
The initial form of orbit analysis applies to two or multiple variables if they are time series but not to a panel. Thus, to construct a cross-sec-tional data, first, orbit analysis is replicated individually for each country and then, the results of this process are used to construct new datasets treated with the statistical software STATA. The structure of the data, then takes the following form Xit , i =1, ... , N t =1, ... , T where i is the individual dimension and t is the time dimension. A new series of descrip-tive and graphical analysis are conducted with the new dataset in order to highlight the dynamics of the GDP aggregates, and to draw implications for policy discussions.
3.1. Application of orbit analysis to structural transformation This study explores the GDP aggregates written as follows:
Y= C + G + I + (E-M), (1)
Where Y is GDP, C is household consumption expenditure (including Non-profit institutions serving households), G is general government final con-sumption expenditure, I is gross capital formation, E is exports of goods and services, M imports of goods and services.
GDP = ∑ Value added, (2)
Where Value added is the sum of the value added from sectoral 1) The materials used for the computation of the data are detailed in Itaki (2014). Orbit anal-ysis of leading-following relations among multiple variables. Ritsumeikan Kokusai Kenkyu, 27, 1-34.
sition.
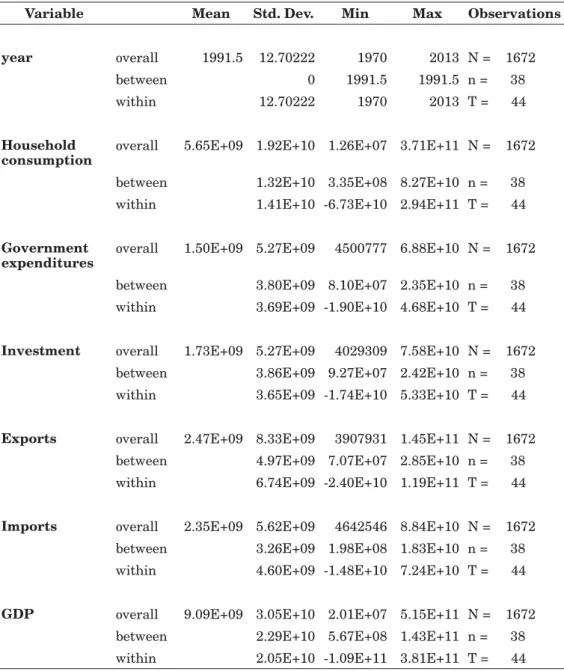
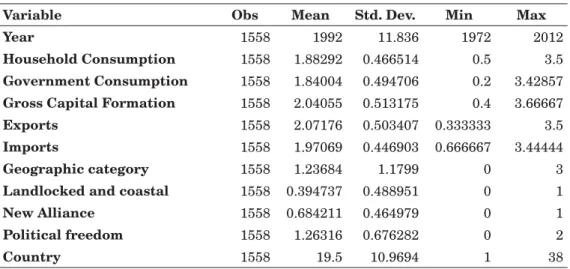
The data were retrieved from the UN database under the section Na-tional Accounts Main aggregates for 38 SSA countries in current $US. The series consist of 1672 observations over the period 1970-2013 for the fol-lowing variables: C, G, I, E, M (defined above for equation (1)); the rest of the variables in equation (2) are based on the definition of the Internation-al Standard IndustriInternation-al Classification (ISIC) : agriculture, hunting, forest-ry, fishing (ISIC A-B), mining, manufacturing, utilities (ISIC C-E), manu-facturing (ISIC-D), construction (ISIC-F), wholesale, retail trade, restaurants and hotels (ISIC G-H), transport, storage and communication (ISIC-I), and other activities (ISIC J-P). Annual change in value is used to reflect the specifications advocated by Itaki (2014) regarding the quantita-tive-pulling and being-pulled relations. After the treatment and calibra-tion, the output of orbit analysis retains 1558 observations of the 5, 7 and 9 years moving average, for the period 1972-2012. The 9 years moving av-erage is selected out of the 5 and 7 years moving avav-erage given the medi-um-term variations of the data (Itaki, 2014).
The countries subject to this study are divided into two main catego-ries: the donor-supported countries receiving assistance from the New Alli-ance and the GAFSP 2) (hereafter G8NA) and the less supported countries (hereafter non-G8NA).
These countries are regrouped into four geographical regions com-posed by Western, Southern, Middle and Southern Africa. Other categori-cal variables are used as a dummy instrument to assess variations across the groups and regions. These factors are the sub-regional location, the ge-ography (landlocked or coastal), and political freedom.
3.2. Assumptions and organisation of the data
The present paper outlines three series of analyses. The first series begins with the consideration of SSA as a single economic bloc, that is to say, no categorical variables are applied to the analysis. The ensuing ap-proach apply the categorical variables related to geographical relations coupled with the conditions of being a landlocked or coastal country. The third analysis considered the geographical and political condition with the
2) Programs supporting investments in agriculture through the public-private partnership approach.
use of the political and civil liberty index retrieved from the Freedom House (2014). The data structures and specifications necessary for these stages are summarised in Table 1 below.
Orbit analysis uses various concepts to describe the changes and vari-ations in a given analysis. The weight of a variable is used to measure its ability to effect change and the frequency across the individual and across time is used to assess the robustness.
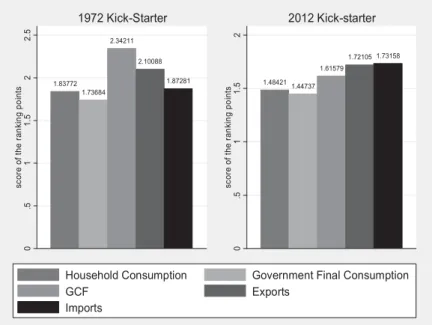
Kick-starter indicates the variable that records the highest ranking points at the beginning of the analysis. It also carries the pulling power to herald changes over other variables. This study points out two types of kick-starter. Type 0 (1972 kick-starter) considers all the time span of the period of analysis; and Type I (2012 kick-starter) is the highest score at a time t within a period of analysis.
Table 1 - List of 38 SSA countries and their distributions G8NA
countries
Non-G8NA countries
Ethiopia, Ghana, Kenya, Liberia, Malawi, Mali, Mozambique, Rwanda, Senegal, Tanzania, Uganda, Zambia
Angola, Benin, Botswana, Burkina Faso, Burundi, Central Africa Republic, Came-roon, Chad, Congo, Cote d Ivoire, Demo-cratic Republic of Congo, Equatorial Guinea, Gabon, Gambia, Guinea, Guinea-Bissau, Lesotho, Madagascar, Maurita-nia, Namibia, Niger, Nigeria, Sierra Leo-ne, Swaziland, Togo, Zimbabwe
Western Africa Southern Africa Eastern Africa Middle Africa
A n g o l a , B e n i n , Burkina Faso, Cote D Ivoire, Gambia, G h a n a , G u i n e a , Guinea-Bissau, Li-beria, Mali, Mauri-tania, Niger, Nige-ria, Senegal, Sierra Leone, Togo Botswana, Lesotho, N a m i b i a , S wa z i -land Burundi, Ethiopia, Kenya, Madagas-car, Malawi, Mo-zambique, Rwanda, Uganda, Tanzania, Zambia
Cameroon, Central A f r i c a R e p u b l i c, Chad, Congo, Dem-ocratic Republic of Congo, Equatorial Guinea, Gabon
Coastal Landlocked
Angola, Benin, Cameroon, Congo, Cote D Ivoire, Democratic Republic of Congo, Equatorial Guinea, Gabon, Gambia, Gha-na, Guinea, Guinea-Bissau, Kenya, Libe-ria, Madagascar, Mauritania, Mozam-bique, Namibia, Nigeria, Senegal, Sierra Leone, Togo, Tanzania
Botswana, Burkina Faso, Burundi, Cen-tral Africa Republic, Chad, Ethiopia, Le-sotho, Malawi, Mali, Niger, Rwanda, Swa-ziland, Uganda, Zambia, Zimbabwe
The degree of variation indicates the intensity of the changes of one variable across time measured by the standard deviation. The degree of variation helps to understand whether major drifts and gap exist among the scores of one variable.
4. R
ESULTSTo begin, we look at the factors that influence the economy of SSA at the beginning and the end of the period of analysis. Figure 1 shows that in-vestments play the role of kick-starter in 1972. Looking at the pattern of the data in 2012, imports and exports are respectively taking the role of leading and following variables in the economy of the region. This pattern gives some indications about the integration of the region in the globaliza-tion system.
After identifying the kick-starters, we assess the weight of each
varia-1.83772 1.73684 2.34211 2.10088 1.87281 0 .5 1 1. 5 2 2.5 sc or e of the r an ki n g po in ts 1972 Kick-Starter 1.484211.44737 1.61579 1.72105 1.73158 0 .5 1 1. 5 2 sc or e of the r an ki n g po in ts 2012 Kick-starter
Household Consumption Government Final Consumption s t r o p x E F C G Imports
Figure 1- Extreme points of the kick-starters of 38 countries SSA in 1972 -and 2012
Source: Author s calculation. Notes: the calculations of the kick-starters takes into
consideration the weight (in average) of the data at t0 here 1972 and at the end of
the time tn here 2012. The pattern of the economic data gives some indications
that in its early stage the SSA economy was driven by investments, and at the end of cycle of analysis, the region is likely to be a trade-driven economy.
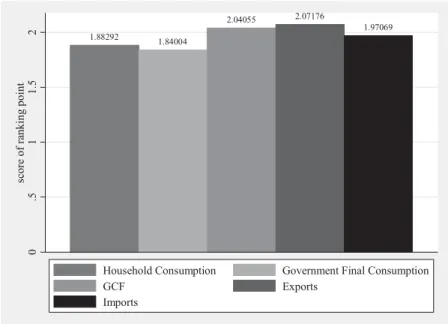
ble depicted in Figure 2. The figure shows that exports and investments have a fairly significant weight in the role of leading and following varia-bles. In other words, exports and investments are mainly heralding the changes among other variables. Paired with the results of Figure 5 (see: appendix) which depicts on a time axis how long a variable lead over other variables – the data show that exports are pointedly robust for the period 1974-1983 with the support of the investments.
Four major important periods can be associated to this long run dy-namics across countries, namely: 1974-1983; 1989-1991; 1993-2000 and fi-nally, 2002-onward.
1974-1983: On the historical timeline, the first period is associated with the oil shock of 1973 and 1979. We can observe the decelera-tion of exports and investments and a slight increase of imports and government spending.
1989-1991 coincides with the structural adjustment policy. One
1.88292 1.84004 2.04055 2.07176 1.97069 0 .5 1 1. 5 2 sc ore o f ra nk in g p oi nt
Household Consumption Government Final Consumption s t r o p x E F C G Imports
Figure 2 – Extreme points of the kick-starters of 38 countries SSA in 1972 and 2012
Source: Author s calculation. Notes: calculation takes into consideration about the weight of the data across individual and time. Over 1972-2012, although exports are leading and investments are following, there is no major difference among the variables.
particularly noted that government spending take a fairly signifi-cant dimension.
1993-2000 is marked by the cycle of globalization in which exports, imports and investments sets the tone of the economy in the region of SSA. One also noticed that by late 1990s, imports gradually in-crease at the expense of exports and investments.
2002-onward: The early 2000s depicts a cycle of reconfiguration in which all the variables are alternatively taking the leading role. On historical timeline, SSA started to record robust growth.
With respect to the degree of variation, across time and countries, gross capital formation, exports, government expenditures, household con-sumption, and finally imports are respectively, recording a variation from a greater to a lesser extent.
4.1. Changes across sub-regional category and geographical conditions The decomposition at a sub-regional level indicates that the leading-following relation is changing across time and countries. Table 2 reports these changes across sub-regions, the kick-starters and the degree of vari-ation across time. The weights of the data are structured by regions as fol-lows: 42.11; 10.53; 28.95 and 18.42 percent respectively for the: Western, Southern, Eastern and Middle Africa.
Table 2 shows that on average, exports lead in Western and Eastern Africa whereas, investments takes the lead in Southern and Middle Africa. In other words, exports and investments were in general the elements that triggered the changes of the four regions across time.
At the beginning of the period of analysis (1972), investments play the role of kick-starters for the four sub-regions. Across time, major changes can be noticed at the last period where the 2012 kick-starters are con-sumption for Western Africa, investments for Southern Africa, exports for Eastern Africa and imports for Middle Africa. The order of the degree of variation indicates which variable is changing more than others among the all set. Table 2 for instance, shows that exports in Western Africa are the most dynamic and rank at the top changing variables within the GDP aggregate. In Southern Africa this deviation is moderate, while in Eastern and Middle Africa the changes of the leading variables rank at the second position.
Ta-Table 2 – Leading-following relations across sub-regional category, 38 SSA countries 1972-2012
Rank Western Africa Southern Africa Eastern Africa Middle Africa
1 E (2.07) I (2.12) E (2.15) I (2.10) 2 I (2.05) E (2.02) M (1.99) M (2.01) 3 M (1.96) C (1.96) I (1.95) E (1.98) 4 C (1.91) M (1.90) G (1.89) C (1.84) 5 G (1.82) G (1.82) C (1.84) G (1.82) 1972 Kick-starters 1 I (2.31) I (2.54) I (2.39) I (2.21) 2 E (2.13) E (2.21) E (2.06) E (2.05) 3 M (1.94) C (2.04) C (1.94) G (1.76) 4 G (1.83) M (1.71) M (1.94) M (1.71) 5 C (1.79) G (1.50) G (1.67) C (1.67) 2012 kick-starters 1 C (1.68) I (2.10) E (2.00) M (1.97) 2 I (1.66) M (1.85) M (1.78) E (1,83) 3 E (1.63) G (1.70) I (1.47) C (1.46) 4 M (1.56) C (1.20) G (1.42) I (1.46) 5 G (1.48) E (1.15) C (1.33) G (1.29) Degree of variations 1 E (0.517)* E (0.519) I (0.542) G (0.542) 2 I (0.499) C (0.450) E (0.497) I (0.518) 3 G (0.483) G (0.447) G (0.495) C (0.482) 4 M (0.450) I (0.446) C (0.495) E (0.453) 5 C (0.439) M (0.442) M (0.473) M (0.394)
Source: Author s calculations. Notes: E: exports, I: gross capital formation, M: imports; C: Household consumption; G: government expenditures.
ble 3. Agriculture has experienced a phase of expansion between 1972-1980. This sector is the most robust among other variables, its position as a leading variable however was surpassed by robust mining between 1980-1990. A phase of reconfiguration is noted between 1990-2000, each sector of the economy successively take the role of leading variable. A ma-jor change is noted after the reconfiguration phase. From 2000-present, manufacturing with the support of agriculture are robust.
• Manufacturing was a leading sector in Western and Middle Africa; agriculture in Southern Africa and finally, mining in Eastern Afri-ca. For the four regions, with the exception of Southern Africa, agri-culture is playing the role of a following variable.
• Among the 1972 kick-starters, the variables recording highest scores at the beginning of the period of analysis across the region are construction in Western, Eastern and Middle Africa, whereas in the Southern region, it was led by transport.
• The variables that are leading at the end of the period of study, or 2011 kick-starter are agriculture in Western Africa, manufacturing in Southern Africa, and mining in Eastern and Middle Africa. • The variables that recorded the great degree of variation or the
sec-tor of activity that has changed actively across time are other activ-ities in Western Africa agriculture in Southern and Eastern Africa and construction in Middle Africa.
In addition to Table 3, Figure 6 indicates that across time, agriculture has been surpassed by other sector of the economy since the 1990s.
4.2. Leading-following relations under coastal and landlocked
Table 3 Leading-following relations across countries, SSA 1972-2011
Rank Western Africa Southern Africa Eastern Africa Middle Africa
1 Manufacturing (3.077) Agriculture (3.336) Mining (3.083) Manufacturing (3.109) 2 Agriculture (3.032) Transport (3.053) Agriculture (3.066) Agriculture (3.012) 3 Wholesale (2.962) Mining (2.989) Transport (3.012) Wholesale (3.010) 4 Mining (2.926) Wholesale (2.934) Manufacturing (2.961) Transport (2.926) 5 Construction (2.916) Construction (2.844) Construction (2.865) Mining (2.825) 6 Transport (2.893) Manufacturing (2.783) Wholesale (2.837) Construction (2.789) 7 Other (2.808) Other (2.675) Other (2.792) Other (2.705)
1972 kick-starters 1 Construction (3.240) Transport (3.750) Construction (3.712) Construction (3.190) 2 Agriculture (3.219) Agriculture (3.625) Agriculture (3.212) Agriculture (2.976) 3 Manufacturing (3.146) Mining (3.167) Mining (2.924) Wholesale (2.929) 4 Transport (3.010) Wholesale (2.792) Manufacturing* (2.833) Transport (2.667) 5 Wholesale (2.958) Manufacturing* (2.708) Wholesale* (2.833) Other (2.548) 6 Mining (2.802) Other* (2.708) Transport (2.803) Manufacturing (2.524) 7 Other (2.625) Construction (2.250) Other (2.682) Mining (2.357) 2011 kick-starters 1 Agriculture (2.000) Manufacturing (2.250) Mining (2.341) Mining (2.339) 2 Construction (1.977) Mining (2.125) Manufacturing (2.045) Agriculture (2.089) 3 Manufacturing (1.969) Other (2.000) Transport (2.034) Transport (2.071) 4 Transport (1.875) Construction (1.938) Other (1.807) Manufacturing (2.054) 5 Mining (1.852) Agriculture (1.844) Agriculture (1.693) Wholesale (1.786) 6 Wholesale (1.742) Transport (1.500) Construction (1.614) Other (1.536) 7 Other (1.703) Wholesale (1.469) Wholesale (1.591) Construction (1.536) Degree of variations 1 Other (0.714) Agriculture (0.857) Agriculture (0.838) Construction (0.774) 2 Transport (0.683) Construction (0.731) Wholesale (0.664) Agriculture (0.762) 3 Mining (0.679) Transport (0.724) Mining (0.648) Mining (0.729) 4 Wholesale (0.669) Mining (0.675) Other (0.642) Other (0.688) continued 5 Agriculture (0.663) Manufacturing (0.666) Construction (0.633) Manufacturing (0.637) 6 Construction (0.650) Wholesale (0.659) Transport (0.614) Transport (0.624) 7 Manufacturing (0.619) Other (0.571) Manufacturing (0.607) Wholesale (0.603)
Source: Author. Notes: score of the ranking points in parentheses.* indicates vari-ables recording the same scores. The result of the orbit analysis of the sectoral de-composition only covers period until 2011.
conditions
The previous section broadly shows which variable was leading the economy of one specific sub-region. On the one hand, exports lead the economy of Western and Eastern Africa, and on the other hand, invest-ments lead in Southern and Central Africa. Adding an instrumental varia-ble, such as the fact of being coastal or landlocked makes it possible to better understand the effects of geographical conditions on SSA economies as well as the stability of the factors that trigger the changes.
Box whisker diagrams depicted in Figure 3 are used to compare the variation of the leading-following relations. The diagram makes it possible to visually compare the variables across the region based on five elements: the lowest and highest value highlighted by the whisker, the lower and up-per quartiles and finally the median. The length the whisker enables to understand the variation of the ranking points for one variable over time. The density of the box gives information on the distribution of one varia-ble vis-à-vis the median and vis-à-vis the other variavaria-bles.
When disaggregated, the leading variable (exports) in Western Africa shows slight differences across the costal and landlocked countries. The distribution of the ranking points in the Western coastal Africa (WCA) is more stable among the other variables. Interpreted from the view point of convergence, this stability suggests that exports carry stronger pulling forces on other variables over time.
Exports are slightly dispersed in Western Landlocked Africa com-pared to other variables. The graphical interpretation indicates that ex-ports and investments are playing an alternate role to herald changes among variables. In other words, over time, exports were not stable enough to exert traction on other variables.
Similar to the case of Western Africa, the pattern of the distribution and the deviation of the leading variable investments show a significant contrast when disaggregated. In Southern Coastal Africa, investments are exerting a stronger traction on government expenditures and exports com-pared to household consumption and imports. In Southern Landlocked Af-rica, the pulling force of the investments is more significant on exports and household consumption compared to its pulling effects on government expenditures and imports.
convergence relative to the pulling force exerted by exports on other varia-bles. The graphical representation of Middle Africa illustrates a significant contrast between coastal and landlocked countries. In Middle Coastal
Afri-0 1 2 3 4 Western coastal 0 1 2 3 4 Western landlocked 1 1.5 2 2. 5 3 Southern coastal 1 2 3 4 Southern landlocked 0 1 2 3 4 Eastern coastal 0 1 2 3 4 Eastern landlocked 0 1 2 3 4 Middle coastal 0 1 2 3 4 Middle landlocked
Household Consumption Government Consumption Gross Capital Formation Exports
Imports
Figure 3 – Leading-following relations by sub-regional decomposition, 38 SSA countries 1972-2012
ca (MCA) the patterns of the whisker box is similar to the ones in ECA and WCA, investments are almost equally exerting traction on the other variables. In Middle landlocked Africa (MLA), investments are concentrat-ed despite some lower outliers. Investments are exerting more significant pulling force on government expenditures than on other aggregate.
4.3. Leading-following relations under G8 New Alliance and
non-New Alliance countries and Political freedom
The previous section gives important information of the leading com-ponent of the GDP, its stability, differences as well as similarities across the region. This section explores the patterns of the convergence among the GDP components while considering political freedom and the fact of being a donor-supported and less supported country.
The weights of the data are distributed as follows: 13.16 percent of the countries subject of this study as free , 47.37 percent partly-free and 39.47 percent not-free .
From the perspective of convergence, significant disparities exist
be-.5 1 1. 5 2 2.5 3
New Alliance free
0
1
2
3
4
New Alliance Partly-free
0
1
2
3
4
New Alliance not-free
0
1
2
3
4
Non New Alliance free
0
1
2
3
4
Non New Alliance partly-free
0
1
2
3
4
Non New Alliance not-free
Household Consumption Government Consumption Gross Capital Formation Exports
Imports
Figure 4 – Leading-following relations among G8 and non-G8 New Alliances
tween the scores of the variables for countries supported by donors. Free countries show that exports are more dynamic while imports are most dy-namic in not-free but donors supported countries (see: Figure 4).
5. D
ISCUSSIONSTo begin, it is necessary to recall the main purpose of this paper which is the analysis of the long run dynamics of the leading-following relations of the driving forces of the African economy. This discussion section wills emphasis on the main leading components of the GDP investments.
Investments are triggering the expansion of the other components of the aggregate GDP, particularly in Southern and Middle Africa. The re-gional breakdown shows that investments play the role as a kick-starter in the four regions. However, differences are noticed in the decomposition across the region when it comes to applying categorical variables. Invest-ments mainly robust in the middle 1970s, its robustness was slightly spo-radic in the late 2000s.
Albeit the reluctance about African environment, return on invest-ments in the continent is today one of the highest in the world as stated by Cooke and Downie (2014), making the region one of the most attractive place for investment. Such dynamic force implies a potential for an invest-ment-driven growth. However, there is a little information about the com-position of these investments, whether they are formed by domestic or for-eign sources.
In macroeconomic theory, historically, domestic investment has been understood as a function of saving, nevertheless over time, it policies stressed more on the importance of FDI to create positive linkages to the host countries. Indeed, early development theories underline the impor-tance of saving as a mean for private companies to invest, create jobs and enhance their productivity. Nonetheless, when most of African countries gained their independence, the saving was missing and was replaced by foreign aid to spur economic growth (Moyo, 2009, p.30). However, this poli-cy did not yield into the expected results as many countries saw their do-mestic saving declining as aid was increasing (Moyo, 2009, p.71). As poli-cies were seeking to replace foreign aid, in the late 1980s, theories highlighting the importance of FDI were burgeoning, giving account to its effect on growth. From 2000-2010, the FDI inflows going to Africa
ac-counted for $40 billion, and are expected to reach the $ 150 billion by 2015 (The McKinsey Global Institute, 2010). A wide range of literature high-light that the FDI inflows depend on: market size, price level, trade barri-ers, production cost, cost of capital, the indicator of stability and so on. Also, there is an important debate with regards to the effects of FDI on de-velopment in the host countries. The nature and type of the investments might have positive, negative or mixed effects on the host countries devel-opment (see: Moran, Graham, & Blomstrom, 2005; Alfaro et al., 2010). Re-cent studies of the World Bank on FDI, combining theoretical and field re-search concluded that: the spillover effects of FDI in developing countries are not necessarily positive in the short term, but can be beneficial to local participants and suppliers in the medium to long term (Farole & Winkler, 2014). Yet, as mentioned earlier, the mixed effect can be misleading. Not only are the FDI effects different from time and space, but its type also plays a key determinant in the positive development in the host countries.
The destination of the FDI going into Africa, both for greenfield and mergers and acquisition (M&A), is primarily in the secondary and tertiary sector, however, in the recent years, international institutions led by the World Bank is persistently fostering investment in agribusiness. These in-vestments can be directed to the different sector of the economy, such as agriculture, manufacturing, telecommunication and new technology, ser-vices and so on. Studies conducted by Moran et al. (2005) explain that these mixed results are due to the differences at the level of the host coun-tries in terms of human resources, the sophistication of the private sector (related to the existence of supply chain linkages) and the politics of the host governments towards investments and trade. The World Investment Report of 2014 indicates that in Africa, Greenfield investments are con-stantly growing. The announced value of these FDI of $281 billion distrib-uted across the region for 2009-2013. Furthermore, the report stated that 3 percent in primary sector, 48 and 49 percent, respectively in the second-ary and tertisecond-ary sectors (UNCTAD, 2014).
Mining is an important industry of which share in percentage of GDP represents about 25.31 percent for the period 2000-2013. Given the impor-tance of this sector, this section turns to the political economy of natural resource management to enrich the element of discussion of the perspec-tive of SSA as mined based economy. According to the UNSD (2008, p. 79), mining activities are defined as follows:
Extraction of minerals occurring naturally as solids (coal and ores), liquids (petroleum) or gases (natural gas). Extraction can be achieved by different methods such as underground or surface mining, well operation, seabed mining etc.
African countries are renowned for the abundance of their under-ground resources, including oil, gas, uranium, diamond, rare earth, as well as the various gemstones to name a few – which are strongly demanded in the industrialised economies (Moyo, 2013, p.10-20). Based on the represen-tation in percentage share of GDP, mining is also generating economic growth and constitute a large share of value added in the SSA economic aggregate. Hence, the importance of mining activities is also having a sig-nificant influence on policy making.
Similar to agriculture, mining contributes to economic growth as an economic activity through several linkages namely: exports, which gener-ate foreign currencies. It also attracts FDI and to some extent source of job creation, but more importantly, taxes and royalties from mining is a major source of government revenue. According to the International Council of Mining and Minerals (ICMM, 2012) which compiled a database on the Mining Contribution Index from a panel of 212 countries, for low and Mid-dle income economies, mining represents about 60-90 percent of the total FDI and 30-60 percent of the total exports. Furthermore, its contributions to the host countries are estimated about 3-20 percent as part of the gov-ernment revenues, 3-10 percent of the total national income, and 1-2 per-cent of the total employment (ICMM, 2012).
Nevertheless, being a resource-rich country can cause various social, economic, political and institutional issues such as corruption, bad govern-ance or rent-seeking behaviour and to some extent, it could be a trap for the low-income countries. For developing economies endowed with abun-dant natural resources, access, use and the control can turn into a thorny issue that can create instability. Collier (2000), for instance, argued that for any period of years, the risk of civil war in an African country rich in natural resource is 23 percent against only one percent for resource-poor countries. Because the natural resources are concentrated in a few places, access and the distribution of the revenue resulting from mining exploita-tion are sources of potential conflicts (UNEP, 2009, p. 15). The UNEP
em-phasised that this exploitation might affect the degradation of the natural environments and land needed for agriculture as a direct impact (UNEP, 2009, p. 15). Furthermore, several case studies show that corruption is caused by the abundance of natural resources. As a matter of fact, Askari, Rehman and Arfaa (2010, p. 59) suggest that corruption is determined by a number of factors, including: the size of government and the calibre of its bureaucracy, the extent of the distortion in the economy, low government capacity to manage privatisation process, low rule of law and enforcement mechanism, low government salaries and the abundance of natural re-sources (see also: Campbell, 2009; Mbaku, 2007; Petermann et al., 2007).
The second knotty elements that need to be discussed here is the rela-tions between agriculture and mining. Both are still considered as primary sectors in which a large proportion of people could be engaged in albeit the two activities are not compatible. Indeed, both industries are using the land on which underground and above ground resource are overlapping. Also, mining and agriculture are using water, which might cause environ-mental depletion. Usher and Vermeulen (2006), for instance, highlight the case of water surface pollution due to the extent of mining in South Africa. Such kind of situation is not an isolated case, but could happen in many countries where agriculture is still playing a key role in the economy.
The third element of discussion in this section is about the relations of these two sectors and the market forces/externalities. In the past decades, agricultural markets have been stable until 2008, after which food com-modity prices skyrocketed and futures contracts related to agricultural sectors became speculative instruments for banks and financial institu-tions. In addition, mining products are also subject to the same law of vol-atility which could be a curse or a blessing for the mining exports depend-ent economies. Those two types of commodities are therefore subject to market signals which might affect decision making to opt either for a min-ing-led or agriculture-led growth strategies. Under this perspective, policy orientation would be directed towards the sector that has the strongest market signal and the lowest negative externalities.
Agriculture and mining are falling respectively into the designated category of soft and hard commodities. The former includes agricultural commodities such as: corn, wheat, coffee, sugar, cotton, cocoa, soybean, rice, etc. The subcategory of hard commodities includes: precious metals (gold, silver, platinum, etc.), industrial metals (aluminium, copper, nickel, zinc,
etc.), and energy (crude oil, gasoil, natural gas, heating oil, etc.). Both sec-tors are sensitive to market signals and to a greater extent, to economic information.) Chevallier and Ielpo (2013, p. 117-143 used an EGARCH 3) model to build a sensitivity score to study the reactions of commodity markets to economic news in 2008-2009 using 16 Bloomberg database comprising times series of 1999-2011, derived from three geographic re-gions: US, European Monetary Union and China. One of the empirical findings of the study concluded that agricultural commodities and pre-cious metals are the most sensitive to economic news (Chevallier & Ielpo, 2013, p. 128). This sensitivity to economic information for the two sectors implies that policies towards agriculture and mining industries in the coming years are likely to be subject to stronger influences of market forc-es. On the other hand, the emergence of these new changes could be a cat-alyst of foreign investment for the region especially for countries endowed with a vast territory.
The last discussion point in this section concerns the manufacturing sector. To understand these interactions, it is important to capture the role of manufacturing in economic development. Such a step would make it possible to bridge some linkages towards agriculture. Manufacturing is de-fined by the UNSD (2008) as:
The physical or chemical transformation of materi-als of components into new products, whether the work is performed by power-driven machines or by hand, wheth-er it is done in a factory or in the workwheth-er s home, and whether the products are sold at wholesale or retail. In-cluded are assembly of component parts of manufactured products and recycling of waste materials. (p. 85) .
Similar to the previous sections, a variety of studies show that manu-facturing sector is the activity that offers the greatest opportunity in terms of sustainable growth, a source of employment and catalyst for pov-erty reduction in Africa (UNCTAD, 2011). Similarly, studies conducted by Ciarli and Di Miao (2014) underlining the importance of manufacturing in the modern economy, show that industrialisation is the pathway to 3) Exponential generalized autoregressive conditional heteroscedastic
tained economic growth and modernisation via the following linkages: technology diffusion and innovation, synergy and spillover effects towards other sectors of the economy, source of demand, backwards and forwards linkages that induce investments, employment and productivity as well as trade.
Despite the disparity of the manufacturing sector at the individual level, the results of the long run analysis of the driving force of the SSA economy are firm. The power of the manufacturing sector to herald chang-es on the other sectors is clearly indicating that the expansion of manufac-turing can lead to the change among other variables, particularly for agri-culture which immediately follows manufacturing in Western, Eastern and Central Africa. A dualism between manufacturing and agriculture can be noticed from the leading-following relations analysis given the impor-tance of the agriculture in SSA s economy. Discussion on the factors that matter in the development of manufacturing is therefore necessary to draw policy implication for the region.
Technology diffusion and innovation do matter in SSA. Innovation is essential for developing economies insofar it can improve well-being and promotes the access to business opportunities. In this regards, the OECD reports on innovation and development highlighted that in the early stage of development, these two elements can improve efficiency of business and public services which in turn lead to the improvement of the well-being but more importantly induces economic growth (OECD, 2012).
Manufacturing is correspondingly inducing synergy and the spillover effect towards the other sectors of the economy. To this regards, UNCTAD (2011) illustrates that this sector is a key source of demand for other ser-vices industries such as banking, transport, insurance and communication but more importantly, it also boosts growth in the agricultural sectors, a key linkage highlighted in the early literature of economic development (Lewis, 1954; Johnston & Mellor 1961). As there are linkages between manufacturing sector and other sectors of the economy, such a process, in turn, gives a momentum to the demand. With such impetus, Engel s law is likely to apply in this case, taking into consideration that with an increase of per capita income the share of expenditure in food falls while demand for manufactured goods would rise (UNCTAD, 2011; Ciarli & Di Maio, 2014).
extent supports the transition of an economy during the process of struc-tural transformation. The theories of strucstruc-tural transformation suggest that the excess of labour in the agricultural sector would shift towards the modern sectors. In this regards, during the process of urbanisation, manu-facturing also would help to absorb the surplus labour from the rural area.
In the context of sustainable development strategy, agriculture and manufacturing are and should be closely interrelated and interdependent. De Janvry and Sadoulet (2010) in this regards, argue that agriculture can foster competitive advantage in the manufacturing sector. In the present days, agriculture and manufacturing offers opportunities for African trade, particularly, for countries endowed with a great agricultural potential. Ex-port derived from agriculture and manufactured goods would also provide an important source of foreign currencies that enable to purchase capital goods and services to enhance productivity. UNCTAD (2013) for instance, is promoting a new concept that links the two sectors across the short and long run via the developmental regionalism . Under this approach, agri-culture would create trade opportunities in the short run due to the rising global and regional demand of food and arable land. And, in the long run, the industry would take the lead to boost the intra-African exports, which accounts for only 11 percent of its total exports (UNCTAD, 2013). Further-more, the result of orbit analysis is also confirming such pathway, where manufacturing has been supporting the economy on the average since the 1990s. The results of our findings suggest SSA is not an agriculture-based economy and the difference and ambiguity of economic classification con-trovert such assumption.
6. C
ONCLUSIONThis paper investigated the long run driving forces of the SSA econo-my using the technique of panel orbit analysis to construct a dynamic hi-erarchy of leading-following relations across 38 countries in SSA. While pursuing such endeavour, the method reveals that over the long run, man-ufacturing, agriculture, exports and investments are on average leading in the sense of orbit analysis across time and countries. In other words, the transformation of the African economy are strongly influenced by the pow-er of these variables to lead changes.
vari-ables (investments and exports) exert an equally stable pulling forces on the other components of the GDP, in other words, the leading variable has a pulling power that is dragging all other variables at the same time.
The fact of being supported or less supported country reveals mixed effect. Regardless to the institutional settings, leading variables in non-G8 countries are exerting equally stable pulling forces on the other variables compared to the countries supported by the G8.
The comparison of the different ways to represent the prevailing eco-nomic sectors demonstrated that there is a multiple pathway for the re-gion based upon three plausible assumptions of being an agriculture-based, mine-based or manufacturing-based economy. This amalgam of assumptions brings forth another critical question about policy making, particularly for resource allocation and the arrangement of development strategies for the continent.
The results of the orbit analysis revealed that SSA region s economy is led by hybrid dualism characterised by and leading-following relations between manufacturing and agriculture. A central point that unites these elements of discussion is the quest for growth . Agriculture, mining and manufacturing show potentials for job creation, opportunities for invest-ments and trade, as well as a potential source of foreign currencies. The differences probably lie in the policy arrangement and choices. As each sector has its own pros and cons, the context across time and space is like-ly to influence decision making for individual countries in SSA and in this regards, key issues such as the land management, human capital develop-ment, business environment among other elements would play an essen-tial role to spur sustainable development.
The editional board accepted this article with reviews by referees on February 16,2016.
R
EFERENCESAddison, T. & Tarp, F. (2010). The Triple Crisis: Finance, Food and Climate Change (Rep. No. angle 05/2010). World Institute for Development Economic Research (UNU-WIDER).
Alfaro, L., Chanda, A., Kalemli-Ozcan, S., & Sayek, S. (2010). Does foreign direct in-vestment promote growth? Exploring the role of financial markets on linkages.
Berk, R. (2010). What You Can and Can t Properly Do with Regression. Journal of
Quantitative Criminology, 26, 481-487.
Cairo, A. (2013). The functional art : an introduction to information graphics and
visu-alization. Berkeley: New Riders.
Ciarli, T. & Di Maio, M. (2014). Theoretical Arguments for Industrialization-Driven Growth and Economic Development. In F.A.S.T.Matambalya (Ed.), African
indus-trial development and European Union co-operation: prospects for a reengineered partnership (pp. 30-68). Abingdon, Oxon; New York, NY: Routledge.
Collier, P. (2000). Economic causes of civil conflict and their implications for policy. Washington, DC: World Bank. Retrieved 10-08-2011 from, http://go.worldbank.org/ HBOXCW5CZ0
Cooke, J. G. & Downie, R. D. (2014). Africa at a crossroads : overcoming the obstacles to
sustained growth and economic transformation. Washington, DC; Lanham, MD:
Center for Strategic and International Studies: Rowman & Littlefield.
Cotula, L. (2012). The international political economy of the global land rush: A critical appraisal of trends, scale, geography and drivers. Journal of Peasant Studies, 39, 649-680.
De Janvry, A. & Sadoulet, E. (2010). Agricultural Growth and Poverty Reduction: Addi-tional Evidence. The World Bank Research Observer, 25(1), 1-20.
Farole, T. & Winkler, D. (2014). Making foreign direct investment work for
Sub-Saha-ran Africa: local spillovers and competitiveness in global value chains.
Washing-ton, DC: The World Bank.
Freedom House.(2014). Freedom in the World 2014: The Annual Survey of Political Rights and Civil Liberties. Retrieved March,23, 2014 from https://freedomhouse. org/report/freedom-world/freedom-world-2014
Gollin, D. (2010). Chapter 73 Agricultural Productivity and Economic Growth. In Prabhu Pingali and Robert Evenson (Ed.), Handbook of Agricultural Economics (Volume 4 ed., pp. 3825-3866). Amsterdam ; London: Elsevier.
Granger, C. W. (1969). Investigating causal relations by econometric models and cross-spectral methods. Econometrica: Journal of the Econometric Society, 424-438. Itaki, M. (2014). Orbit Analysis of Leading-Following Relations among Multiple
Varia-bles. Ritsumeikan Kokusai Kenkyu (Ritsumeikan Journal of International
Stud-ies), 27, 1-33.
Kuznets, S. (1966). Modern economic growth: Rate, structure, and spread. New Haven: Yale University Press.
Matambalya, F. A. S. T. (2015). African industrial development and European Union
co-operation: prospects for a reengineered partnership.
Matondi, P. B. H. K. (2011). Biofuels, land grabbing and food security in Africa. Zed Books ; Distributed in the USA exclusively by Palgrave Macmillan.
McKinsey Global Institute (2010). Lions on the move: the progress and potential of
Af-rican economies. Washington, D.C.: McKinsey Global Institute.
rise of the African consumer. Washington, D.C.: McKinsey Global Institute.
McKinsey Global Institute (The) (2010). Lions on the move: The progress and potential of African economies. Retrieved 19-7-2013, from http://www.mckinsey.com/in-sights/africa/lions_on_the_move
Moran, T. H., Graham, E. M., & Blomstrom, M. (2005). Does foreign direct investment
promote development? Washington, DC: Institute for International Economics:
Center for Global Development.
Moyo, D. (2009). Dead aid: why aid is not working and how there is a better way for
Af-rica. New York: Farrar, Straus and Giroux.
Moyo, D. F. (2013). Winner Take All: China s Race for Resources and what it Means for
the World. New York: Basic Books.
Nallari, R. & Griffith, B. (2011). Understanding growth and poverty: theory, policy, and
empirics. Washington D.C.: World Bank.
Organisation for Economic Co-operation and Development (2006). Promoting pro-poor
growth agriculture. Paris: Organisation for Economic Co-operation and
Develop-ment (OECD).
Parlapiano, A., & Giratikanon, T. (2013, October 9). Janet L. Yellen, on the Economy s Twists and Turns. Retrieved April 29, 2015, from http://www.nytimes.com/interac-tive/2013/10/09/us/yellen-fed-chart.html
Population Reference Bureau. (2013). 2013 World Population Data Sheet. Retrieved April 29, 2015, from http://www.prb.org/pdf13/2013-population-data-sheet_eng.pdf Rajaonarison, H. M. (2014). Food and human security in Sub-Saharan Africa. Procedia
Environmental Sciences, 20, 377-385.
Rostow, W. W. (1960). The stages of economic growth : a non-Communist manifesto. Cambridge [England]: University Press.
Syrquin, M. (2006). Structural transformation. In D.Clark (Ed.), The Elgar Companion
to Development Studies (pp. 601-607). Cheltenham, UK: Edward Elgar Publishing.
Timmer, C. P. (2009). A world without agriculture: The structural transformation in
historical perspective. Washington, D.C., Aei Press.
UNCTAD. (2014). World investment report. 2014, 2014. New York; Geneva: United Na-tions.
United Nations (n.d.). United Nations Database All countries and regions/subregions. Retrieved October 18, 2014, from http://unstats.un.org/unsd/snaama/dnltransfer. asp?fID=4..
United Nations Conference on Trade and Development & United Nations Industrial Development Organization. (2011). Economic development in Africa report 2011
fostering industrial development in Africa in the new global environment. United
Nations Conference on Trade and Development [Electronic version]. Retrieved 1-07-2014, from:
United Nations Conference on Trade and Development. (2009). World investment
re-port 2009: Transnational corporations, agricultural production and development.
United Nations Conference on Trade and Development. (2013). Economic development in Africa: report 2013 - intra-African trade, unlocking private sector dynamism.
Retrieved 08-06-2014, from http://unctad.org/en/PublicationsLibrary/aldcafri-ca2013_en.pdf
United Nations Conference on Trade and Development. (2014). World investment
re-port. 2014, 2014. New York; Geneva: United Nations.
United Nations. & Statistical Division. (2008). International Standard industrial
clas-sification of all economic activities (ISIC). (4 ed.) New York: United Nations.
Vucevic, D. (2012). Testing the data warehouse practicum: Assuring data content, data
structures and quality. S.l.: Trafford on Demand Pub.
World Bank (2007). World development report 2008 agriculture and development. Washington, D.C.: World Bank.
World Bank (2012). Responding to higher and more volatile world food prices (Rep. No. 68420-GLB). Washington, DC: The World Bank.
World Bank. (2007). World development report 2008: Agriculture for development. Washington, D.C.: World Bank.
World Bank. (2010). World development indicators 2010. Retrieved. July 18, 2011, from http://data.worldbank.org/sites/default/files/wdi-final.pdf
World Bank. (2013). The World Bank Group Agriculture Action Plan. Washington, DC: World Bank.
Table 4 – Summary statistics raw data, correlation raw data, summary statistics Orbit Analysis
Variable Mean Std. Dev. Min Max Observations
year overall 1991.5 12.70222 1970 2013 N = 1672 between 0 1991.5 1991.5 n = 38 within 12.70222 1970 2013 T = 44
Household consumption
overall 5.65E+09 1.92E+10 1.26E+07 3.71E+11 N = 1672
between 1.32E+10 3.35E+08 8.27E+10 n = 38 within 1.41E+10 -6.73E+10 2.94E+11 T = 44
Government expenditures
overall 1.50E+09 5.27E+09 4500777 6.88E+10 N = 1672
between 3.80E+09 8.10E+07 2.35E+10 n = 38 within 3.69E+09 -1.90E+10 4.68E+10 T = 44
Investment overall 1.73E+09 5.27E+09 4029309 7.58E+10 N = 1672 between 3.86E+09 9.27E+07 2.42E+10 n = 38 within 3.65E+09 -1.74E+10 5.33E+10 T = 44
Exports overall 2.47E+09 8.33E+09 3907931 1.45E+11 N = 1672
between 4.97E+09 7.07E+07 2.85E+10 n = 38 within 6.74E+09 -2.40E+10 1.19E+11 T = 44
Imports overall 2.35E+09 5.62E+09 4642546 8.84E+10 N = 1672
between 3.26E+09 1.98E+08 1.83E+10 n = 38 within 4.60E+09 -1.48E+10 7.24E+10 T = 44
GDP overall 9.09E+09 3.05E+10 2.01E+07 5.15E+11 N = 1672 between 2.29E+10 5.67E+08 1.43E+11 n = 38 within 2.05E+10 -1.09E+11 3.81E+11 T = 44
Table 5 - Correlation table, Raw Data 38 SSA countries, 1972-2013 Y C G I E M Variable Y 1 C 0.974 1 G 0.7801 0.6402 1 I 0.9516 0.884 0.8544 1 E 0.8823 0.8487 0.6086 0.8092 1 M 0.8612 0.8463 0.6177 0.8223 0.9489 1
Table 6 - Summary Statistics of the 9 years moving average
Variable Obs Mean Std. Dev. Min Max
Year 1558 1992 11.836 1972 2012
Household Consumption 1558 1.88292 0.466514 0.5 3.5
Government Consumption 1558 1.84004 0.494706 0.2 3.42857
Gross Capital Formation 1558 2.04055 0.513175 0.4 3.66667
Exports 1558 2.07176 0.503407 0.333333 3.5
Imports 1558 1.97069 0.446903 0.666667 3.44444
Geographic category 1558 1.23684 1.1799 0 3
Landlocked and coastal 1558 0.394737 0.488951 0 1
New Alliance 1558 0.684211 0.464979 0 1
Political freedom 1558 1.26316 0.676282 0 2
0 4 8 12 16 20 72 74 76 78 80 82 84 86 88 90 92 94 96 98 00 02 04 06 08 10 12 Consumption Government Investment Exports Imports SAP cycle First cycle globalization cycle reconfiguration cycle
Figure 5 Leading-following relations among the GDP aggregate of SSA countries
0 2 4 6 8 10 12 14 72 74 76 78 80 82 84 86 88 90 92 94 96 98 00 02 04 06 08 10 12 agriculture mining manufacturing construction wholesale transport other agriculture-led phase mine-led phase reconfiguration phase manufacturing phase