1
Aromatic aldehydes as selective fluorogenic derivatizing agents for α- dicarbonyl compounds. Application to HPLC analysis of some advanced glycation end products and oxidative stress biomarkers in
human serum
Mahmoud H. El-Maghrabey
a,b, Taro Nakatani
c, Naoya Kishikawa
a, Naotaka Kuroda
a,*
aCourse of Pharmaceutical Sciences, Graduate School of Biomedical Sciences, Nagasaki University, 1-14 Bunkyo-machi, Nagasaki 852-8521, Japan
bPharmaceuticalAnalytical Chemistry Department, Faculty of Pharmacy, Mansoura University, Mansoura 35516, Egypt
cSchool of Pharmaceutical Sciences, Nagasaki University, 1-14 Bunkyo-machi, Nagasaki 852- 8521, Japan
* Corresponding author. Tel.: +81 95 819 2894, fax: +81 95 819 2444,
E-mail address: [email protected] (N. Kuroda).
2
Abstract
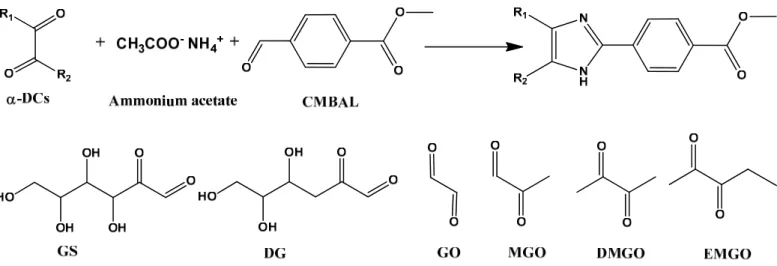
α-Dicarbonyl compounds (α-DCs) are very clinically important as they are considered as advanced glycation end products (AGEs) precursors and biomarkers for many chronic diseases such as diabetes and vascular diseases, in addition to their major role in progression of complications of such diseases. Aromatic aldehydes and ammonium acetate were productively used as a one-pot co-reagents for fluorogenic derivatization of α-DCs yielding fluorescent imidazole derivatives. Among the tried aromatic aldehydes, 4-carbomethoxybenzaldehyde yielded the products with best fluorescent characters. This approach for fluorogenic derivatization of α-DCs overcome the selectivity problem of the most commonly used derivatization reagent for α-DCs, α-diamino compounds, that can react unselectively with α- DCs and aldehydes. Separation of five α-DCs including glucosone, 3-deoxyglucosone, glyoxal, methyl glyoxal and dimethyl glyoxal together with ethylmethylglyoxal as an internal standard was carried out on an octyl column using a mobile phase consisted of methanol-water (15:85, v/v %) containing 0.2 % formic acid with time programed flow, followed by fluorescence detection at excitation/emission wavelengths of 310/410 nm. The method showed excellent sensitivity for the targeted α-DCs with limits of detections ranging from 0.4-5.0 nM in human serum. Simple protein precipitation procedure was used for human serum treatment yielding very good recovery (91-105%) for the targeted α-DCs. The developed method was fully validated, then applied to the analysis of the five above mentioned clinically important α-DCs in serum samples of healthy, diabetic, rheumatic and cardiac disorders human volunteers. Due to the excellent analytical features of the developed method, including high selectivity and sensitivity, it was able to detect the pattern of the targeted α-DCs serum levels under the investigated different clinical conditions.
Keywords: Aromatic aldehydes; α-Dicarbonyls; AGEs; Fluorogenic derivatization;
Human serum; Diabetic patients
3
1. Introduction
Among keto compounds, aliphatic α-dicarbonyl compounds (α-DCs) such as α- dialdehydes, α-diketones and α-oxoaldehydes, have been receiving a great consideration by virtue of their high clinical importance. α-DCs have a significant role in the progress of complications associated with many chronic diseases such as diabetes, Alzheimer's disease, nephropathy, macrovascular disease and cataract. In this perspective, reactive α-dialdehydes such as glyoxal (GO) and α-oxoaldehydes including: methylglyoxal (MGO), glucosone (GS) and 3-deoxyglucosone (DG) are reactive intermediates in protein glycation. Thus glycation occurs via the Maillard reaction between the aldehyde group of reducing sugar and the primary amino group of protein, nucleic acid or lipid giving a Schiff base which produces Amadori products by rearrangement. Amadori products then degrade through oxidation and dehydration reactions to yield mainly GO, MGO, GS and DG. Since these α-oxoaldehydes are more reactive than the reducing sugar from which they are formed, they propagate the reaction through reacting with the amino group of protein and they act as precursors for advanced glycation end products (AGEs) [1,2]. AGEs cause damage to tissues by three main ways: formation of cross-links, interaction with cellular receptors, and intracellular glycation [1]. In addition, GO, MGO, GS and DG are produced by non- enzymatic degradation of glucose, so their levels are increased in diabetes patients [2].
Also, it was reported that the level of these α-DCs in biological fluids could be used as an indicator for the risk of diabetic complications progression [3].
GO is also a main product of lipid peroxidation as a result of oxidative stress and
increased level of intracellular oxidants. It originates from ω-6 polyunsaturated fatty
acids [4,5]. It is also a key product of carbohydrate autoxidation. For example, it is
produced by DNA oxidation at deoxyribose C
4ʹ/C
5ʹcarbons leading to breakage of DNA
4
strands, as well, it is produced by autoxidation of ene-diol tautomer of glycolaldehyde [6]. MGO, which is also considered as a lipid peroxidation product but to much less extent than GO [4], is produced enzymatically from glycolic metabolism of glucose or ketone bodies metabolism [7]. Also, MGO is produced from aminoacetone through the enzymatic activity of serum semicarbazide sensitive amine oxidase (SSAO) [5].
Regarding GS and DG endogenous sources other than Amadori products, they could be produced from glucose autoxidation and hydrolysis of fructose 3-phosphate, respectively [5].
Also, it is noteworthy that another α-DC, dimethylglyoxal (DMGO), was also detected in biological materials and it was considered as a lipid peroxidation product [4]. DMGO was also detected in students after alcohol ingestion and was considered as a minor metabolite for the acetaldehyde produced from metabolic oxidation of ethanol [8]. It was considered as one of the causes of the alcohol toxicity via its favorable redox potential which is able to induce electron transfer in-vivo. Also, mutations and cancer initiation are among the possible toxic responses to DMGO [9].
The determination of the above mentioned α-DCs in human serum has a great significance due to their close correlation with AGEs, tissue modifications, lipid peroxidation and other possible serious toxic responses. In 2006, a summary for the reported analytical methods for the determination of α-DCs in different matrices was reported by Shibamoto [4]. In the last ten years, many methods were reported for determination of α-DCs in biological fluids including: Gas chromatographic methods with flame ionization detection (GC-FID) [10,11] or with mass spectrometric detection (GC-MS) [12,13] and liquid chromatography with tandem MS (LC-MS/MS) [14–16].
However, these methods require the use of expensive and sophisticated instruments and
need experienced analyst to perform the analysis. On the other hand, simpler methods
5
such as capillary electrophoretic methods with UV (CE-UV) [17] or amperometric detection (CE-AD) [18], and high-performance LC methods with fluorescence detection (HPLC-FL) were also reported [19–21]. However, these methods suffered from several drawbacks including long derivatization reaction time, need for relatively large sample volume, and need for time consuming and multistep sample preparation.
Moreover, most of these methods depended on using α-diamino compounds as derivatizing reagents [10–17,19–21] which are not selective for α-DCs as they can react with any compound having aldehyde group in their structure forming imidazole derivatives [22] instead of the pyrazine derivative formed with the α-DCs. Also, CE- AD method depends on using the non-selective reagent, thiobarbituric acid, which is reactive towards many other compounds including malondialdehyde (MDA), reducing sugars, and pyrimidine [23].
Now it is clear that there is a strong need for a new approach for the determination of α-DCs to overcome the previously mentioned problems of the reported literature.
Our research group has previously utilized benzaldehyde or its derivatives for the derivatization of ortho-quinones in the presence of ammonium acetate [24–26]. In this paper we aim to use this reaction for the first time for the fluorogenic derivatization of clinically important aliphatic α-DCs including: GS, DG, GO, MGO and DMGO using ethylmethylglyoxal (EMGO) as internal standard an (IS) (Fig. 1) followed by their HPCL-FL analysis in human serum. The most important advantage of using this approach for determination of α-DCs is the expected selectivity. Benzaldehyde or its derivatives in the presence of ammonium acetate can react only with α-DCs to yield fluorescent imidazole derivative and the reagents cannot react with aldehydes or any compound does not have the α-dicarbonyl group.
6
2. Materials and methods 2.1. Materials and reagents
The utilized reagents were of analytical grade and used without any prior treatment. GO, MGO, DMGO, EMGO were obtained from Sigma-Aldrich (St. Louis, MO, USA). GS and DG were purchased from Carbosynth Ltd (Berkshire, UK). Acetic acid and methanol were from Wako Pure Chemical Industries (Osaka, Japan). The tested aromatic aldehydes are shown in Fig. S1 (supplementary materials). Most of the aromatic aldehydes including 4-carbomethoxybenzaldehyde (CMBAL) were obtained from Tokyo Chemical Industry (Tokyo). Sigma-Aldrich was the supplier for ammonium acetate, 4-diethylaminobenzaldehyde, 4-formylphenylboronic acid and 4- acetoxybenzaldehyde, while benzaldehyde, 1-naphthaldehyde and 4- methoxybenzaldehyde were from Wako Pure Chemical Industries. 4- Dimehthylaminobenzaldehyde was obtained from Kishida Chemicals (Tokyo). Purified water was obtained using Autostill WG 203 (Yamato Scientific Co., Ltd., Tokyo).
Stock solutions of GS, DG, GO, MGO, DMGO, EMGO (5.0 mM) were prepared in acetonitrile. A mixed standard solution containing the six analytes was prepared by diluting the stock solutions with acetonitrile to obtain the required concentrations.
CMBAL (0.2 M) and ammonium acetate (1.0 M) were prepared in methanol and glacial acetic acid, respectively. The analytes solution were kept in -30°C while other reagents kept in the refrigerator at 4 °C.
2.2. Apparatus and chromatographic condition
A Shimadzu LC-20AT pump (Kyoto, Japan), a Rheodyne injector (Cotati, CA,
USA) with a 20-µL sample loop combined with a Shimadzu RF-20AXS fluorescence
detector and an EZ Chrom Elite chromatography data acquisition system (Scientific
7
software, Pleasanton, CA, USA) were used to construct the HPLC system. The separation was performed on a Cosmosil 5C8-MS column (150 mm × 4.6 mm i.d., 5µm particle size) from Nacalai Tesque INC. The mobile phase consisted of methanol-water (15:85, v/v%) containing 0.2 % formic acid. The flow rate was time programed as follow; in the first 30 min, the flow rate was kept at 0.6 mL/min then increased to 2.0 mL/min in one minute then was kept constant till 60 min. The λ
Ex/ λ
Emwavelengths were set at 310/410 nm, respectively.
Shimadzu RF-1500 spectrofluorophotometer was used for recording fluorescence spectra. Himac CR 15 refrigerated centrifuge (Hitachi Koki Co., Ltd., Tokyo) was used during serum samples extraction.
Quattro micro TM triple-quadruple mass spectrometer (Waters Co., Milford, MA,USA) was used for recording the mass spectrum (MS) of GO and MGO derivatives of CMBAL after positive electro spray ionization (ESI+).For the derivatization of the target analytes, a Yamato HF-41 heating block (Tokyo) was used.
2.3. Study of different aromatic aldehydes as fluorogenic reagent for α-DCs One hundred μL of GO or MGO (40 μM each), as representatives for the DCs, was transferred to a screw-capped vial followed by addition of 50 μL of 1.0 M ammonium acetate and 50 μL of the tested reagents (0.2 M) (Fig. S1, supplementary materials). The reactants were mixed and heated at 90 °C for 30 min, followed by cooling and dilution to 4.0 mL with methanol. Then the fluorescence spectra was recorded.
2.4. Derivatization of the α-DCs in standard solution using CMBAL
One hundred µL of the standard mixture of the α-DCs with EMGO (IS) was
mixed with 50 μL of 1.0 M ammonium acetate and 50 μL of 0.2 M CMBAL, then the
reaction was carried out for 30 min at 90°C followed by cooling and dilution through
8
mixing with 200 µL of water. Aliquots of 20 µL were injected into the HPLC-FL system.
A reagent blank was carried out simultaneously.
2.5. Assay procedure for α-DCs in human serum
To 25 µL of human serum, spiked with the α-DCs, 10 µL of EMGO (IS) and 965 µL of acetonitrile were added followed by vortex mixing then 20 min/4°C centrifugation at 2200×g. Aliquot of 100 µL of the supernatant was used for the derivatization process as mentioned above. Aliquots of 20 µL were injected into the HPLC-FL system. Same procedure was adopted for the determination of the α-DCs in healthy and disease human samples using non-spiked serum samples.
2.6. Clinical samples
All experiments conducted with human subjects were approved by the Ethics Committee of the Graduate School of Biomedical Sciences, Nagasaki University.
Sasebo Chuo Hospital kindly supplied us with 30 human serum samples including 11 healthy control (8 males and 3 females; mean age 50.2±8.4), 9 rheumatic patients (2 males and 7 females; mean age 64.9±11.4), 6 diabetic patients (4 males and 2 females;
mean age 60.3±7.0) and 4 cardiac disorder patients (one male and 3 females; mean age 75.0±5.5). All serum samples were kept at -80 °C until analysis.
2.7. Validation procedure
For validation of the developed method, we followed the Guidance for Industry
on Bioanalytical Method Validation [27]. The validation studies of biological fluid were
carried out using pooled serum sample pre-analyzed for aldehyde contents before
spiking with standard aliphatic aldehyde solutions and the peak areas of the target
aldehydes in blank samples were subtracted from the peak areas after spiking.
9
Calibration curves were conducted for α-DCs using serum samples spiked at six concentration levels, including the limit of quantification (LOQ), for each aldehyde.
Then the spiked serum samples were extracted and derivatized as mentioned previously.
The average relative peak areas ratio of the α-DCs to the IS were plotted versus their concentrations (nM). The LOQ was calculated as the lowest concentration in the calibration curve that was determined with accuracy of 80-120% and precision (%
RSD) of ≤20% and with S/N ≥ 5. While the limit of detection (LOD) was calculated at S/N = 3.
Accuracy and precision of the method were examined by analysis of serum samples spiked with the studied analytes at three concentration levels for five determinations per each concentration. The accuracy was calculated as the variation of the mean calculated value from the true value. As well, the intra-day precision was determined as the % RSD for five determinations, at each concentration, in the same day. The inter-day precision was also determined as the %RSD for five determinations, at each concentration, on five consecutive days.
The stability of aldehydes solutions was studied at -80°C up to 2 months and at room temperature up to 6 h. In addition, the stability of CMBAL and ammonium acetate solutions was examined over 2 weeks. We also checked the stability of the derivatized α-DC at room temperature for 24 h. The response in every condition was compared to that of freshly prepared solution.
2.8. Statistical analysis
The α-DCs levels are presented as mean ± SE for the number of experiments. In
order to compare the levels of the α-DCs in the four studied groups (healthy (H) subjects,
diabetes mellitus (DM), rheumatoid arthritis (RA), and cardiac disorders (CD) patients),
Anova test was used to compare means of different groups. In all cases, the four groups
10
have different means from each other, thus the post hoc Dunnett's test was used for comparing the three diseased group with the control one [28]. Bartlett's test for the equality of k variances was not used as some of the groups sizes were less than ten [29].
All the statistical tests were two-sided at a significant level of α=0.05.
3. Results and discussion
α-DCs, that are biomarkers for AGEs and lipid peroxidation, do not possess in their structure any intrinsic chromophore or fluorophore. Thus, there is a need for their derivatization into UV absorbing or fluorescent products. As mentioned earlier, most of the previously reported methods for their analysis depend on using α-diamino compounds which are not selective for α-DCs and can react with any compound possessing aldehyde group [22]. This encouraged us to search for a new approach for derivatization of α-DCs that could overcome this major problem. Aromatic aldehydes could react with ortho-quinones in presence of ammonium acetate to yield fluorescent imidazole derivatives [24–26]. Aromatic aldehydes are supposed to be incapable of reacting with aldehydes that does not have α-keto group. Thus, in this work we focused on studying the use of aromatic aldehydes as a new selective fluorogenic reagent for aliphatic α-DCs.
3.1. Screening of different aromatic aldehydes as a potential fluorogenic reagents for α-DCs and ESI-MS identification of the formed imidazole products
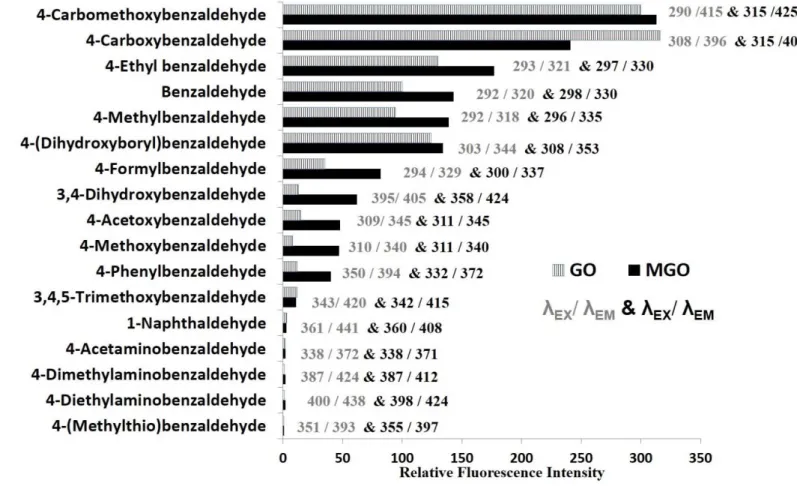
A total of 17 aromatic aldehydes (Fig. S1) have been thoroughly screened as
fluorogenic derivatizing reagents for the studied α-DCs using two representative
compounds, GO and MGO, as substrates in the course of the study. Fig. 2 depicts a
summary for the optimum λ
excitation/λ
emmisionand relative fluorescence intensity (RFI) for
11
each GO and MGO-derivative of the tested reagents. Both of CMBAL and 4- carboxybenzaldehyde gave rise to promising results. CMBAL was selected as the best fluorogenic derivatizing reagent among all tested reagents by virtue of yielding high RFI for both derivatives. Also, we avoided the use of 4-carboxybenzaldehyde as the 4- carboxy group may be a site for reaction with biological amines which will give rise to many side products. To confirm the structure of the formed imidazole derivative from the reaction between α-DCs and CMBAL, the reaction mixture product of GO and MGO with CMBAL and ammonium acetate was analyzed by ESI-MS and the recorded mass spectra are shown in Fig. S2. The masses at 203.2 in Fig. S2A and 217.2 in Fig.
S2B resembled the [M+H]
+for GO and MGO imidazole derivatives of CMBAL. While the two masses appearing at 164.3 and 179.3 aroused from the reagent itself [M+H]
+and its insource aldolization reaction product with methanol [M+15]
+[30], respectively.
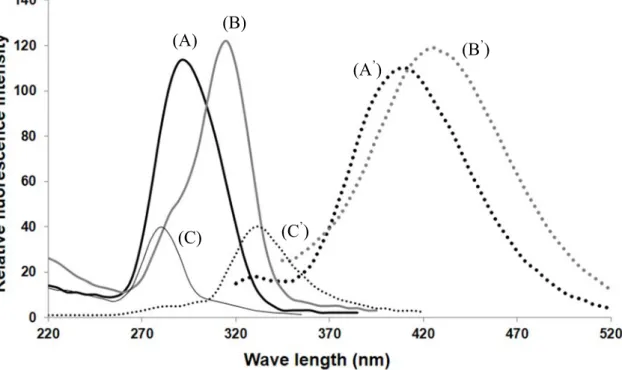
3.2. Study of the selectivity of the proposed method towards α-DCs and the fluorescence properties of the formed CMBAL derivatives of α-DCs
To investigate the selectivity of our newly proposed approach for fluorogenic
derivatization towards α-DCs, the reactions of CMBAL and ammonium acetate with α-
DCs and different types of aldehydes were carried out and the fluorescence intensity
was measured every time. The tested α- DCs included GS, DG, GO, MGO, DMGO,
EMGO, while the tested aldehydes included a saturated aldehyde; heptanal, α,β-
unsaturated aldehydes; acrolein and hexenal, a 4-hydroxy-α,β-unsaturated aldehyde; 4-
hydroxy-2-nonenal, and the β-ketoaldehyde; MDA. Only α- DCs could react with
CMBAL and ammonium acetate to yield fluorescent imidazole derivatives (the
fluorescence spectra of GO and MGO vs. blank reagent are illustrated in Fig. 3), while
none of the tested aldehydes could produce any fluorescence after carrying out the
derivatization reaction. The fluorescence excitation and emission wavelengths of the
12
tested α- DCs are summarized in Table S1 (supplementary materials). From these results we can conclude that the newly developed approach is highly selective for α- DCs and this is the first method that showed this high selectivity even against the structurally related β-ketoaldehyde (MDA).
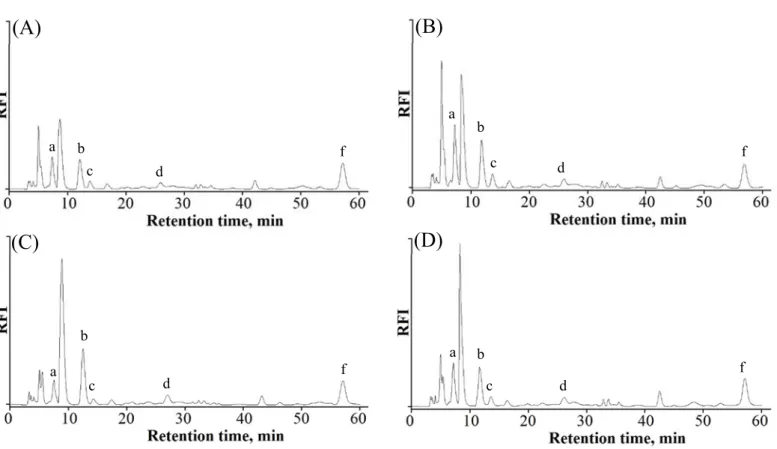
3.3. HPLC separation of the targeted α-DCs
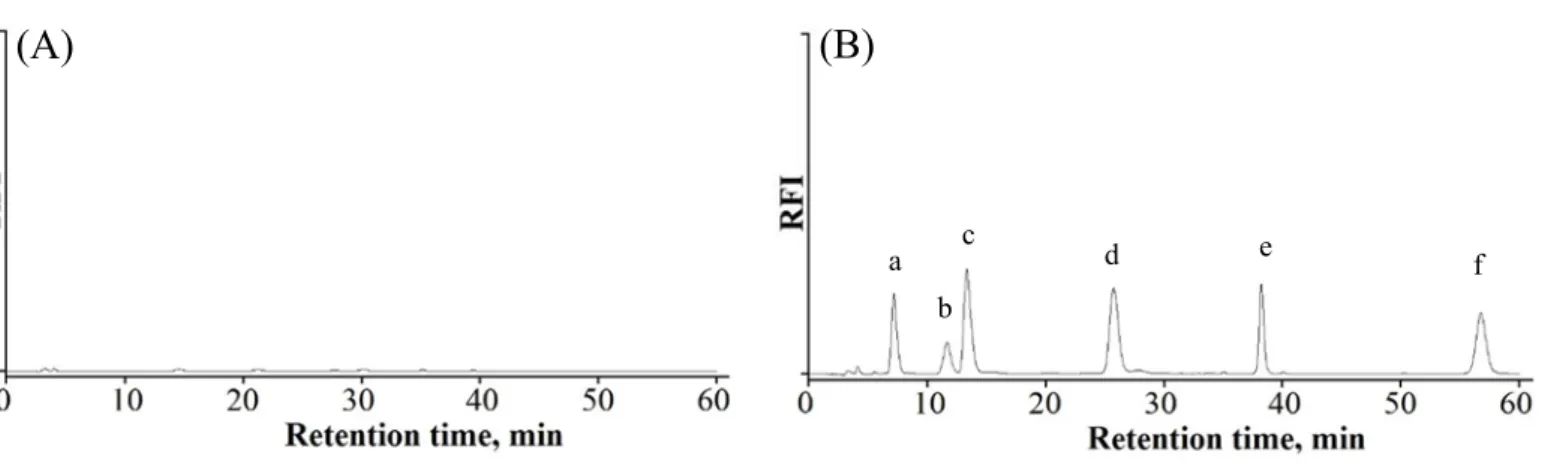
The HPLC separation conditions were carefully examined for best separation of the analytes in a reasonable run time. Different % of methanol was studied covering the range of 10-25% v/v. At percentage volumes greater than 15% v/v, separation of DG and GO was not achieved, while at percentage volumes less than 15% v/v broad peaks with very long retention times were obtained. Hence, 15% v/v methanol was considered as optimum for the best separation. Besides, the concentration of formic acid was optimized using solutions within the concentration range of 0.05 to 0.2 % and the best peaks shapes were obtained using 0.2% formic acid. The use of a gradient flow rate (described in Section 2.2.) was advantageous so as to decrease the run time with no need for re-equilibration times that is used in case of gradient elution. In addition, simple instrumentation with one pump and one mobile phase offers expediency and practicality. As mentioned previously, the fluorescence wavelengths of the tested α- DCs are summarized in table S1 (supplementary materials) and the chosen compromised excitation and emission wavelengths for the fluorescence detection were 310 and 410 nm, respectively.
After this study, the optimum mobile phase consisted of methanol-water (15:85,
v/v %) containing 0.2 % formic acid with a time programed flow rate and fluorescence
detection at 410 nm upon excitation at 310 nm allowed efficient separation of the target
analytes as illustrated in Fig 4. There were no detected peaks in reagent blank
chromatogram (Fig 4A) and also in Fig. 3 the reagent blank show no fluorescence at
13
the emission wavelengths of the formed imidazole derivatives. These results demonstrate the fluorogenic nature of the reaction which is an added advantage for the developed method.
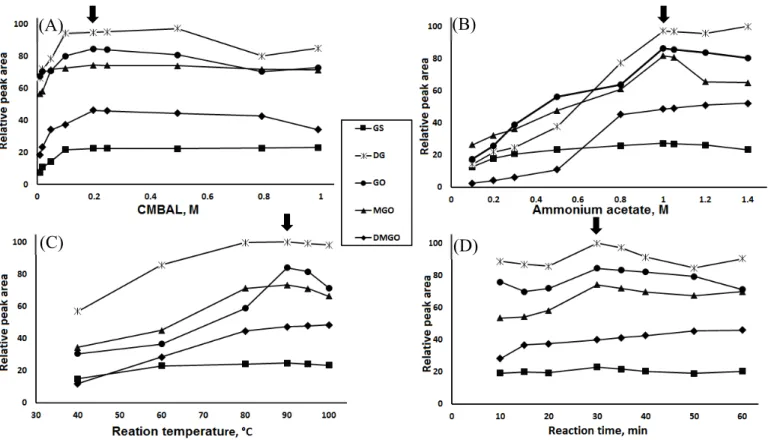
3.4. Optimization of the derivatization conditions
The concentrations of CMBAL and ammonium acetate as well as the reaction temperature and time were examined as important elements that affect the derivatization reaction progress (Fig. 5). Inspection of CMBAL with concentrations of 0.01 to 1.0 M showed that the relative peak area increased with increasing CMBAL concentration and reached maximum with 0.2 M CMBAL and then was nearly constant.
Thus, 0.2 M CMBAL was chosen as the optimum reagent concentration (Fig. 5A). In addition, ammonium acetate with a concentration of 1.0 M was selected as optimum for this study yielding the highest relative peak area (Fig. 5B).
Investigation of the reaction temperature was accomplished over a temperature ranged from 40 to 100 ºC and a reaction time extended from 10 to 60 min. We found that increasing the temperature resulted in corresponding increase in the relative peak area for all of the studied α-DCs up to 90 ºC, where some decrease in the relative peak areas occurred by increasing the temperature above 90 ºC. On the other hand, the study of the influence of the time on the reaction progress and relative peak areas showed that 30 min was optimum for most of the target analytes except for GS which needed only 10 min to give high and stable relative peak area. After the study of these two factors, the reaction of the tested analytes was carried out at 90 ºC for 30 min (Fig. 5C and D).
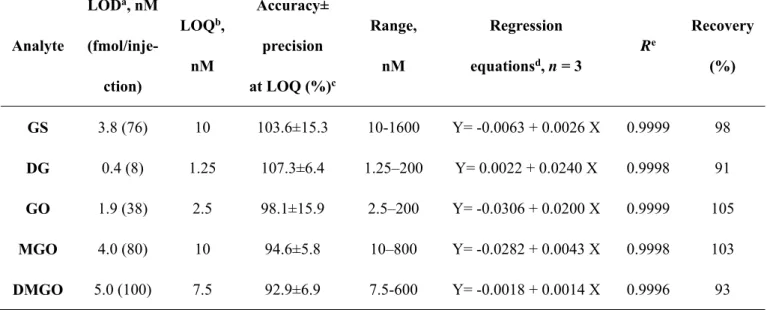
3.5. Validation study
Procedures for validation were conducted following FDA Guidance for Industry
on Bioanalytical Method Validation [27] as integral part of analytical method
14
development. The method linearity was ascertained over wide dynamic ranges for the five investigated analytes with excellent correlation coefficients (≥
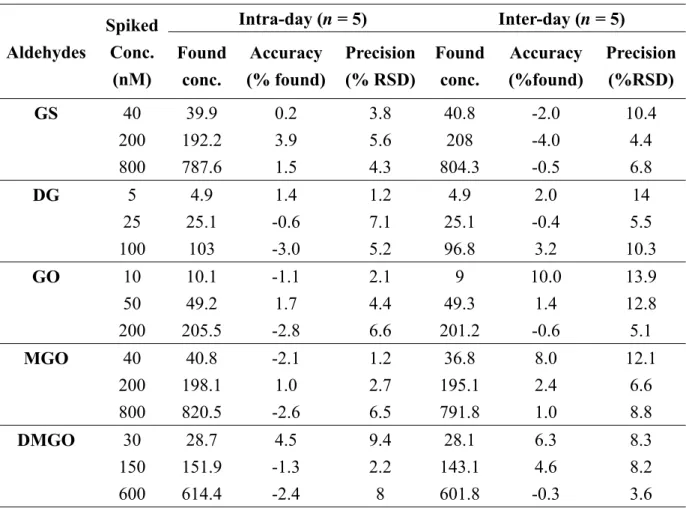
0.9996). Additionally, the LOD and LOQ were calculated for eachα-DCs. The accuracy at LOQ was calculated and found to be ranged from -7.1 to 7.3 and the precision was ≤ 15.9% which is compatible with FDA validation guidelines. Table 1 shows a summary of the obtained data. The accuracy of the proposed method was established over the linearity range, where the deviation from the true value was in the range of −4% to +10% (Table 2). A study of the precision was also carried out and the %RSD for the intra-day measurements was ≤ 9.4% and that of the inter-day measurements was ≤ 14% (Table 2). These values agreed well with the acceptance criteria of FDA Guidance [27].
The method robustness is a measure of the steadiness of the peak areas of the formed derivatives with minor changes in the experimental parameters. As shown in Fig. 5, when we made small deliberate changes in the reagents concentrations: CMBAL (0.2–0.25 M) and ammonium acetate (1.0–1.05 M) and reaction conditions, reaction temperature (90–95 °C) and reaction time (30–35 min), the deviation of the results from those of the optimum condition did not exceed 3% for all analytes. From that we can conclude that these slight changes that may occur in the course of the analysis will not affect the accuracy and the precision of the results, which prove the robustness of the method.
The stability of aldehydes solutions and reagents solutions (CMBAL and ammonium acetate) as well as the stability of the derivatized α-DC were checked. The solutions of aldehydes showed good stability at -80°C up to two months and at room temperature up to 6 h, in the same time, reagents solutions were stable over 2 weeks.
The derivatized α-DC exhibited good stability at room temperature for 24 h.
15
3.6. Application of the proposed method for the analysis of α-DCs in serum of healthy and diseased human subjects
The excellent sensitivity and selectivity of the proposed HPLC-FL method encouraged us to use it for the determination of the level of the studied α-DCs in human serum. Different approaches were tried for the extraction of the targeted α-DCs from human serum including protein precipitation (PPT) using methanol and acetonitrile [31], salting out liquid-liquid extraction (LLE) [32], subzero-temperature LLE [22], and solid phase extraction (SPE) [20] using different types of cartridges including; Oasis HLB, Strata-X polymeric sorbent, amine-bond elute and the hyper cross-linked copolymer Isolute Enve+. A summary of the % recovery ranges for all analytes using the previously mentioned extraction methods is presented in Table S2 (supplementary files).
As can be seen from this table, excellent % recoveries in the range of 91-105% were obtained for the targeted α-DCs using PPT with acetonitrile, thus the extraction of target analytes from human serum was performed as mentioned in the experimental section adopting simple PPT procedure. The proposed method was applied for the determination of the targeted α-DCs in healthy subjects and patients serum samples.
The chromatograms of the targeted α-DCs in serum of healthy, diabetic, rheumatic and
cardiac disorders human subjects are illustrated in Fig. 6. All the targeted α-DCs were
detected in all serum samples except for DMGO which was not detected in any of them
neither those of healthy nor diseased subjects. This is due to the in-vivo reduction of
DMGO to acetoin and 2,3-butanediol; therefore, it has not always been detected in
biological samples[10,11,17] unless ethanol ingestion occurs prior to sample
withdrawal [8] which is not the case in all collected serum samples in our study. Some
peaks other than the targeted α-DCs were detected in the serum samples (Fig. 6), which
could be attributed to further α-DCs that could be present in human serum such as 1-
16
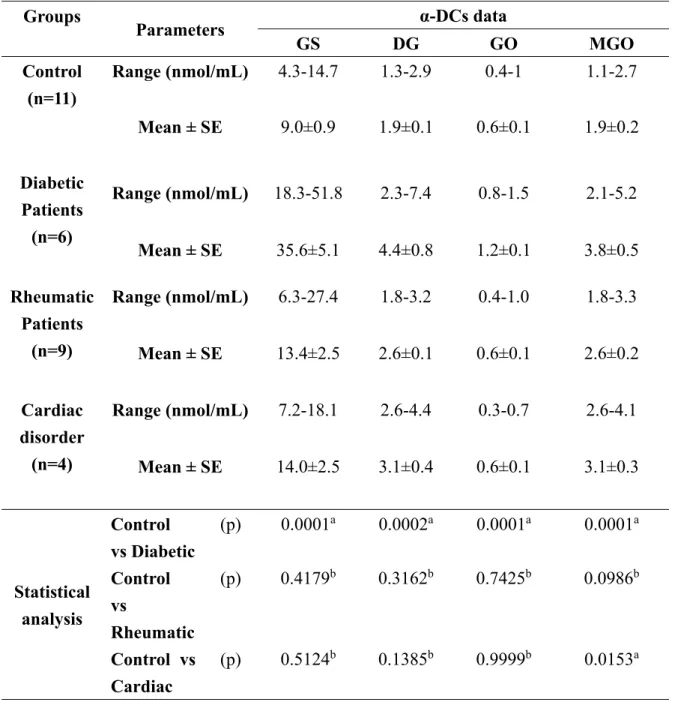
deoxyglucosone, Lederer’s glucosone, pentosone and its deoxy derivatives, threosone and its deoxy derivatives, dehydroascorbic acid and 2,3-diketogulonic acid [15]. The concentrations of the targeted α-DCs in healthy and diseased human subjects in addition to statistical analysis of the difference in their levels among the examined diseased groups vs control one are summarized in Table 3. The levels of GS, DG, GO and MGO are significantly elevated in diabetic patients compared to control group due to the process of glycol-oxidation (oxidation of glycation products) and non-enzymatic degradation of excess glucose, which agreed well with previous reports [2,10,11,14,17,31,33]. The levels of GS, DG, GO, and MGO were not statistically difference among control and rheumatic patient group which is also in accordance with our previous studies [31,34]. Comparing the levels of the detected α-DCs in control group vs the cardiac disorders one revealed that only MGO concentration was found to be significantly higher in cardiac disorder group than the control one. This could be attributed to the increase in the activity of semicarbazide sensitive amine oxidase enzyme, an enzyme that convert aminoacetone to MGO via oxidative deamination, in cardiac disorders patients [5]. Based on these results, our newly developed derivatization approach enabled determination of α-DCs in human serum samples and allowed characterization of patterns of their levels in different clinical conditions.
3.7. Comparison of the newly developed approach for determination of α-DCs in biological fluids and its analogues in literature
When we made comparison between the analytical performances of the
developed HPLC-FL method and these of the published literature for analysis α-DCs,
many advantages and superiority in many aspects were in the favor of our novel
developed fluorogenic approach. The developed method could make selective
fluorogenic derivatization for α-DCs using aromatic aldehydes which is in contrast to
17
most of the reported literature that used α-diamino reagents that lack selectivity. This point conveys a great significance and promising applications to the proposed method.
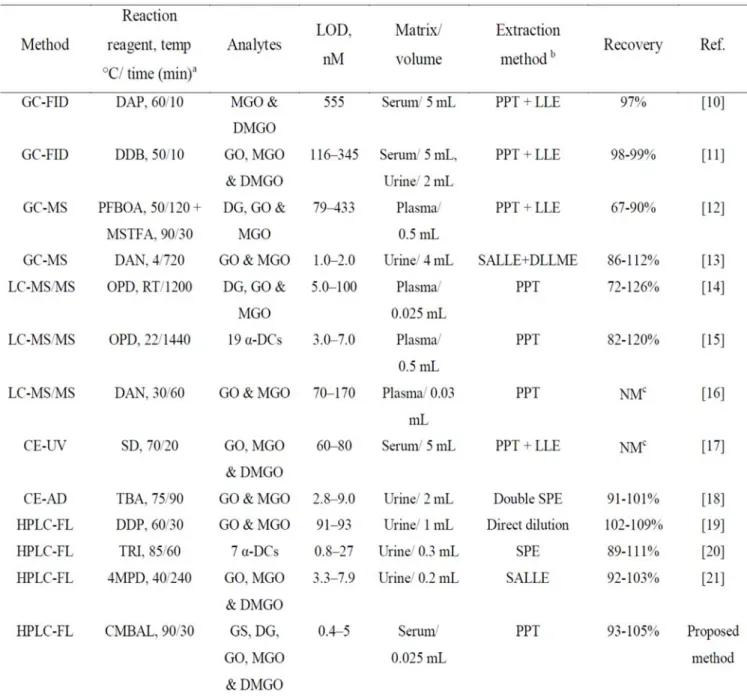
Table 4 summarize the analytical aspects of the proposed and the previously reported methods for analysis of α-DCs in biological fluids. In addition to the selectivity problem that was discussed previously, the reported methods suffered from several drawbacks including; long derivatization time (120-1440 min) [12–15,21], relatively large sample volumes (0.2-5 mL) [10–13,17,19–21] and the use of complicated multistep extraction procedures [10–13,17,18]. On the other hand, the developed method needs only 30 min for completion of the derivatization reaction, used very small sample volume (0.025 mL) which compares only to the previously reported LC-MS/MS methods [14,16]
which used expensive instrumentations that are not available in many laboratories, as well, the extraction of α-DCs from human serum was carried out using simple PPT procedure with very good recovery (91-105%). In addition, the proposed method exhibited superior sensitivity to most of the previously reported methods [10–12,15–
19,21] (Table 4). Despite the fact that a GC-MS [13] and a HPLC-FL [20] method showed similar sensitivity to our developed method, the GC-MS [13] method necessitate the use of expensive and complicated instrumentation while the HPLC-FL [20] depended on fluorogenic derivatization of the α-DCs into pteridine derivatives which could be easily interfered by endogenous pteridines, thus it needed laborious procedure for their removal prior to analysis.
4. Conclusion
A new fluorogenic derivatization approach for clinically important α-DCs (AGEs
precursors) was developed and validated based on their reaction with the aromatic
aldehyde, CMBAL, and ammonium acetate yielding highly fluorescent imidazole
18
derivatives. The method showed excellent sensitivity (LOD ranging from 0.4-5.0 nM) and exceptional selectivity for α-DCs even in presence of reactive aldehydes and β-DCs (MDA). Thus, the developed method was successfully applied for analysis of α-DCs in human serum of healthy and diseased human subjects. The method could differentiate the levels of α-DCs between healthy subjects and AGEs related diseases like diabetes.
Some peaks other than the targeted α-DCs appeared in the chromatograms of the studied serum samples which could be attributed to other α-DCs that could be used as biomarkers for certain diseases. Currently, there is an ongoing research in our laboratory to use the same technique for the development of a LC-MS/MS method for α-DCs that could reveal new diseases biomarkers.
5. Acknowledgement
The authors would like to greatly thank Dr. Yukitaka Ueki and Dr. Takahiro Imazato from Sasebo Chuo Hospital for supplying the plasma samples used in this study.
In addition, M. H. El-Maghrabey would like to express his truthful appreciation to the
Takeda Science Foundation for the provided fellowship.
19
6. References
[1] A. Lapolla, P. Traldi, D. Fedele, Importance of measuring products of non- enzymatic glycation of proteins., Clin. Biochem. 38 (2005) 103–115.
[2] P.J. Thornalley, A. Langborg, H.S. Minhas, Formation of glyoxal, methylglyoxal and 3-deoxyglucosone in the glycation of proteins by glucose., Biochem. J. 344 Pt 1 (1999) 109–116.
[3] Z. Turk, Glycotoxines, carbonyl stress and relevance to diabetes and its complications., Physiol. Res. 59 (2010) 147–156.
[4] T. Shibamoto, Analytical methods for trace levels of reactive carbonyl compounds formed in lipid peroxidation systems., J. Pharm. Biomed. Anal. 41 (2006) 12–25.
[5] P.J. O’Brien, A.G. Siraki, N. Shangari, Aldehyde sources, metabolism, molecular toxicity mechanisms, and possible effects on human health., Crit. Rev. Toxicol.
35 (2005) 609–62.
[6] N. Murata-Kamiya, H. Kamiya, H. Kaji, H. Kasai, Glyoxal, a major product of DNA oxidation, induces mutations at G:C sites on a shuttle vector plasmid replicated in mammalian cells., Nucleic Acids Res. 25 (1997) 1897–1902.
[7] P.J. Thornalley, Pharmacology of methylglyoxal: formation, modification of proteins and nucleic acids, and enzymatic detoxification--a role in pathogenesis and antiproliferative chemotherapy., Gen. Pharmacol. 27 (1996) 565–573.
[8] M. Otsuka, N. Harada, T. Itabashi, S. Ohmori, Blood and urinary levels of ethanol, acetaldehyde, and C4 compounds such as diacetyl, acetoin, and 2,3- butanediol in normal male students after ethanol ingestion., Alcohol. 17 (1999) 119–124.
[9] P. Kovacic, A.L. Cooksy, Role of diacetyl metabolite in alcohol toxicity and
20
addiction via electron transfer and oxidative stress., Arch. Toxicol. 79 (2005) 123–128.
[10] M.Y. Khuhawar, L.A. Zardari, A.J. Laghari, Capillary gas chromatographic determination of methylglyoxal from serum of diabetic patients by precolumn derivatization with 1,2-diamonopropane., J. Chromatogr. B, Anal. Technol.
Biomed. Life Sci. 873 (2008) 15–19.
[11] L.A. Zardari, M.Y. Khuhawar, A.J. Laghari, Capillary GC analysis of glyoxal and methylglyoxal in the serum and urine of diabetic patients after use of 2,3- diamino-2,3-dimethylbutane as derivatizing reagent, Chromatographia. 70 (2009) 891–897.
[12] M.-Y. Wu, B.-G. Chen, C.D. Chang, M.-H. Huang, T.-G. Wu, D.-M. Chang, Y.- J. Lee, H.C. Wang, C.-I. Lee, C.-L. Chern, R.H. Liu, A novel derivatization approach for simultaneous determination of glyoxal, methylglyoxal, and 3- deoxyglucosone in plasma by gas chromatography-mass spectrometry., J.
Chromatogr. A. 1204 (2008) 81–86.
[13] M. Pastor-Belda, A.J. Fernandez-Garcia, N. Campillo, M.D. Perez-Carceles, M.
Motas, M. Hernandez-Cordoba, P. Vinas, Glyoxal and methylglyoxal as urinary markers of diabetes. Determination using a dispersive liquid-liquid microextraction procedure combined with gas chromatography-mass spectrometry., J. Chromatogr. A. 1509 (2017) 43–49.
[14] J.L.J.M. Scheijen, C.G. Schalkwijk, Quantification of glyoxal, methylglyoxal and 3-deoxyglucosone in blood and plasma by ultra performance liquid chromatography tandem mass spectrometry: evaluation of blood specimen., Clin.
Chem. Lab. Med. 52 (2014) 85–91.
[15] C. Henning, K. Liehr, M. Girndt, C. Ulrich, M.A. Glomb, Extending the
21
spectrum of alpha-dicarbonyl compounds in vivo., J. Biol. Chem. 289 (2014) 28676–28688.
[16] S.J. Chen, C. Aikawa, T. Matsui, Quantitative analysis of methylglyoxal, glyoxal and free advanced glycation end-products in the plasma of Wistar rats during the oral glucose tolerance test., Biol. Pharm. Bull. 38 (2015) 336–339.
[17] M.A. Mirza, A.J. Kandhro, S.Q. Memon, M.Y. Khuhawar, R. Arain, Determination of glyoxal and methylglyoxal in the serum of diabetic patients by MEKC using stilbenediamine as derivatizing reagent., Electrophoresis. 28 (2007) 3940–3947.
[18] J. Zhang, H. Zhang, M. Li, D. Zhang, Q. Chu, J. Ye, A novel capillary electrophoretic method for determining methylglyoxal and glyoxal in urine and water samples., J. Chromatogr. A. 1217 (2010) 5124–5129.
[19] A. Espinosa-Mansilla, I. Duran-Meras, F.C. Canada, M.P. Marquez, High- performance liquid chromatographic determination of glyoxal and methylglyoxal in urine by prederivatization to lumazinic rings using in serial fast scan fluorimetric and diode array detectors., Anal. Biochem. 371 (2007) 82–91.
[20] M. del C. Hurtado-Sanchez, A. Espinosa-Mansilla, M.I. Rodriguez-Caceres, E.
Martin-Tornero, I. Duran-Meras, Development of a method for the determination of advanced glycation end products precursors by liquid chromatography and its application in human urine samples., J. Sep. Sci. 35 (2012) 2575–2584.
[21] A.G. Ojeda, K. Wrobel, A.R.C. Escobosa, M.E. Garay-Sevilla, K. Wrobel, High- performance liquid chromatography determination of glyoxal, methylglyoxal, and diacetyl in urine using 4-methoxy-o-phenylenediamine as derivatizing reagent., Anal. Biochem. 449 (2014) 52–58.
[22] M.H. El-Maghrabey, N. Kishikawa, K. Ohyama, T. Imazato, Y. Ueki, N. Kuroda,
22
Determination of human serum semicarbazide-sensitive amine oxidase activity via flow injection analysis with fluorescence detection after online derivatization of the enzymatically produced benzaldehyde with 1,2-diaminoanthraquinone, Anal. Chim. Acta. 881 (2014) 139–147.
[23] D. Zhang, R. Haputhanthri, S.M. Ansar, K. Vangala, H.I. De Silva, A. Sygula, S.
Saebo, C.U.J. Pittman, Ultrasensitive detection of malondialdehyde with surface-enhanced Raman spectroscopy., Anal. Bioanal. Chem. 398 (2010) 3193–
3201.
[24] N. Kishikawa, M. Wada, Y. Ohba, K. Nakashima, N. Kuroda, Highly sensitive and selective determination of 9, 10-phenanthrenequinone in airborne particulates using high-performance liquid chromatography with pre-column derivatization and fluorescence detection., J. Chromatogr. A. 1057 (2004) 83–88.
[25] N. Kishikawa, M. Nakao, M.S. Elgawish, K. Ohyama, K. Nakashima, N. Kuroda, 4-Carbomethoxybenzaldehyde as a highly sensitive pre-column fluorescence derivatization reagent for 9,10-phenanthrenequinone., Talanta. 85 (2011) 809–
812.
[26] N. Kishikawa, A. Yamanouchi, M.H. El-Maghrabey, K. Ohyama, N. Kuroda, Determination of tanshinones in danshen (Salvia miltiorrhiza) by high- performance liquid chromatography with fluorescence detection after pre- column derivatisation., Phytochem. Anal. (2017).
[27] Food and Drug Administration, Guidance for industry. Bioanalytical method
validation., (2013).
http://www.fda.gov/downloads/drugs/guidancecomplianceregulatoryinformatio n/guidances/ucm368107.pdf.
[28] J.N. Miller, J.C. Miller, Statistics and chemometrics for analytical chemistry,
23
Fifth Ed, Prentice Hall, England, 2005.
[29] K. Kobayashi, K.S. Pillai, Y. Sakuratani, T. Abe, E. Kamata, M. Hayashi, Evaluation of statistical tools used in short-term repeated dose administration toxicity studies with rodents., J. Toxicol. Sci. 33 (2008) 97–104.
[30] L. Wang, Y. Chai, P. Tu, C. Sun, Y. Pan, Formation of [M+15]+ ions from aromatic aldehydes by use of methanol: In-source aldolization reaction in electrospray ionization mass spectrometry, J. Mass Spectrom. 46 (2011) 1203–
1210.
[31] M.H. El-Maghrabey, N. Kishikawa, K. Ohyama, N. Kuroda, Analytical method for lipoperoxidation relevant reactive aldehydes in human sera by high- performance liquid chromatography-fluorescence detection, Anal. Biochem. 464 (2014) 36–42.
[32] J. Zhang, H. Wu, E. Kim, T.A. El-Shourbagy, Salting-out assisted liquid/liquid extraction with acetonitrile: a new high throughput sample preparation technique for good laboratory practice bioanalysis using liquid chromatography-mass spectrometry., Biomed. Chromatogr. 23 (2009) 419–425.
[33] N. Shangari, P.J. O’Brien, The cytotoxic mechanism of glyoxal involves oxidative stress., Biochem. Pharmacol. 68 (2004) 1433–1442.
[34] M.F.B. Ali, N. Kishikawa, K. Ohyama, H.A.-M. Mohamed, H.M. Abdel-Wadood, A.M. Mahmoud, T. Imazato, Y. Ueki, M. Wada, N. Kuroda, Chromatographic determination of low-molecular mass unsaturated aliphatic aldehydes with peroxyoxalate chemiluminescence detection after fluorescence labeling with 4- (N,N-dimethylaminosulfonyl)-7-hydrazino-2,1,3-benzoxadiazole., J.
Chromatogr. B, Anal. Technol. Biomed. Life Sci. 953–954 (2014) 147–152.
24
Fig. 1. Reaction between α-DCs, aromatic aldehydes and ammonium acetate yielding
imidazole derivatives.
25
Fig. 2. Fluorescence properties of GO (grey) and MGO (black) imidazole derivatives
of the tested aromatic aldehydes reagents.
26
Fig. 3. Excitation and emission spectra of CMBAL derivatives of GO (A and A’) and MGO (B and B
’) vs. that of reagent blank (C and C
’), respectively.
(A)
(A
’) (B)
(B
’)
(C) (C
’)
27
Fig. 4. Chromatograms of (A) reagent blank and (B) α-DCs standard mixture and IS where (a) GS (50 nM), (b) DG (25 nM), (c) GO (25 nM), (d) MGO (100 nM), (e)
DMGO (150 nM) and (f) EMGO (IS, 150 nM).
a c
b
d e f
(A) (B)
28
Fig. 5. Factor affecting the derivatization reaction of α-DCs with CMBAL and ammonium acetate; (A) CMBAL concentration, (B) ammonium acetate concentration,
(C), derivatization temperature, and (D) derivatization time.
(A) (B)
(C) (D)
29
Fig. 6. Chromatograms of serum samples of (A) healthy volunteer, (B) diabetic patient, (C) cardiac disorder patient, and (D) rheumatic patient, where peaks (a, b, c,
d, and f) are same like those in Fig. 4.
a c b
d
f
a c b
d f
a c b
d f
a c b
d
f
(A) (B)
(C) (D)
30
Table 1: Sensitivity, linearity and recovery data for the studied α-DCs in serum
Analyte
LODa, nM (fmol/inje-
ction)
LOQb, nM
Accuracy±
precision at LOQ (%)c
Range, nM
Regression equationsd, n = 3
Re
Recovery (%)
GS 3.8 (76) 10 103.6±15.3 10-1600 Y= -0.0063 + 0.0026 X 0.9999 98 DG 0.4 (8) 1.25 107.3±6.4 1.25–200 Y= 0.0022 + 0.0240 X 0.9998 91 GO 1.9 (38) 2.5 98.1±15.9 2.5–200 Y= -0.0306 + 0.0200 X 0.9999 105 MGO 4.0 (80) 10 94.6±5.8 10–800 Y= -0.0282 + 0.0043 X 0.9998 103 DMGO 5.0 (100) 7.5 92.9±6.9 7.5-600 Y= -0.0018 + 0.0014 X 0.9996 93
a S/N= 3.
b S/N≥ 5.
c Accuracy expressed as %found and precision expressed as %RSD
d Y= ratio of the peak area of the studied compound to that of the IS, X= α-DC concentration (nM).
e Correlation coefficient.
31
Table 2: Accuracy and precision data for the studied α-DCs in serum
Aldehydes
Spiked Conc.
(nM)
Intra-day (n = 5) Inter-day (n = 5) Found
conc.
Accuracy (% found)
Precision (% RSD)
Found conc.
Accuracy (%found)
Precision (%RSD)
GS 40 39.9 0.2 3.8 40.8 -2.0 10.4
200 192.2 3.9 5.6 208 -4.0 4.4
800 787.6 1.5 4.3 804.3 -0.5 6.8
DG 5 4.9 1.4 1.2 4.9 2.0 14
25 25.1 -0.6 7.1 25.1 -0.4 5.5
100 103 -3.0 5.2 96.8 3.2 10.3
GO 10 10.1 -1.1 2.1 9 10.0 13.9
50 49.2 1.7 4.4 49.3 1.4 12.8
200 205.5 -2.8 6.6 201.2 -0.6 5.1
MGO 40 40.8 -2.1 1.2 36.8 8.0 12.1
200 198.1 1.0 2.7 195.1 2.4 6.6
800 820.5 -2.6 6.5 791.8 1.0 8.8
DMGO 30 28.7 4.5 9.4 28.1 6.3 8.3
150 151.9 -1.3 2.2 143.1 4.6 8.2
600 614.4 -2.4 8 601.8 -0.3 3.6
32
Table 3: Data of the levels of α-DCs in serum of healthy and diseased subjects and their statistical analysis
Groups
Parameters α-DCs data
GS DG GO MGO
Control (n=11)
Range (nmol/mL) 4.3-14.7 1.3-2.9 0.4-1 1.1-2.7
Mean ± SE 9.0±0.9 1.9±0.1 0.6±0.1 1.9±0.2 Diabetic
Patients (n=6)
Range (nmol/mL) 18.3-51.8 2.3-7.4 0.8-1.5 2.1-5.2
Mean ± SE 35.6±5.1 4.4±0.8 1.2±0.1 3.8±0.5 Rheumatic
Patients (n=9)
Range (nmol/mL) 6.3-27.4 1.8-3.2 0.4-1.0 1.8-3.3
Mean ± SE 13.4±2.5 2.6±0.1 0.6±0.1 2.6±0.2
Cardiac disorder (n=4)
Range (nmol/mL) 7.2-18.1 2.6-4.4 0.3-0.7 2.6-4.1
Mean ± SE 14.0±2.5 3.1±0.4 0.6±0.1 3.1±0.3
Statistical analysis
Control vs Diabetic
(p) 0.0001
a0.0002
a0.0001
a0.0001
aControl
vs
Rheumatic
(p) 0.4179
b0.3162
b0.7425
b0.0986
bControl vs Cardiac
(p) 0.5124
b0.1385
b0.9999
b0.0153
aa There is significant difference at P < 0.05
b There is no significant difference at P < 0.05
33
Table 4. Comparison of the newly developed approach for determination of α-DCs in biological fluids and its analogues in literature
a DAP: 1,2-diaminopropane, DDP: 2,3-Diamino-2,3-dimethylbutane, PFBOA: O(2,3,4,5,6-pentafluorobenzyl) hydroxylamine, MSTFA: N-methyl-N-trimethylsilyl-trifluoroacetamide, DAN: 2,3-diaminonaphthalene, O- phenylenediamine (OPD), SD: stilbenediamine, TBA: thiobarbituric acid, DDP: 5,6-diamino-2,4- hydroxypyrimidine, TRI: 6-hydroxy-2,4,5-triaminepyrimidine, 4MPD: 4-methoxy-O-phenylenediamine, RT:
room temperature
b PPT: protein precipitation, LLE: liquid-liquid extraction, SALLE: salting-out assisted LLE, DLLME: dispersive liquid–liquid micro-extraction, SPE: solid phase extraction
c NM: Not mentioned
34
Graphical abstract
35
Journal of Pharmaceutical and Biomedical Analysis Supplementary materials
Aromatic aldehydes as a selective fluorogenic derivatizing agents for α-dicarbonyl compounds. Application to HPLC analysis of some advanced glycation end products and oxidative stress biomarkers in
human serum
Mahmoud H. El-Maghrabey
a,b, Taro Nakatani
c, Naoya Kishikawa
a, Naotaka Kuroda
a,*
aCourse of Pharmaceutical Sciences, Graduate School of Biomedical Sciences, Nagasaki
University, 1-14 Bunkyo-machi, Nagasaki 852-8521, Japan
b Department of PharmaceuticalAnalytical Chemistry, Faculty of Pharmacy, Mansoura University,
Mansoura 35516, Egypt
cSchool of Pharmaceutical Sciences, Nagasaki University, 1-14 Bunkyo-machi, Nagasaki 852-
8521, Japan
* Corresponding author. Tel.: +81 95 819 2894, fax: +81 95 819 2444,
E-mail address: [email protected] (N. Kuroda).
36
Fig. S1: Structure of the tested aromatic aldehydes as fluorogenic reagents for α-DCs
37
Fig. S2: ESI-MS of GO (A) and MGO (B) derivatives of CMBAL
(A)
(B)
38
Table S1: Excitation and emission wavelengths of the CMBAL fluorescence derivatives of targeted α-DCs and compromised used detection wavelengths for HPLC analysis
α-DCs Excitation (nm) Emission (nm) RFI
aGS 315 420 135
DG 315 420 138
GO 290 415 100
MGO 315 425 107
DMGO 320 395 120
EMGO 320 390 128
Compromised wavelengths
310 410
a RFI of GO was considered as 100.
39