Highway Transportation Efficiency Evaluation for Beijing‑Tianjin‑Hebei Region Based on Advanced DEA Model
著者 Zhihong Li, Li Zhao, Zhenzhou Yuan journal or
publication title
International Review for Spatial Planning and Sustainable Development
volume 4
number 3
page range 36‑44
year 2016‑07‑15
URL http://hdl.handle.net/2297/45838
doi: 10.14246/irspsd.4.3_36
36
DOI: http://dx.doi.org/10.14246/irspsd.4.3_36
Copyright@ by authors, SPSD Press from 2010, Kanazawa
Highway Transportation Efficiency Evaluation for Beijing-Tianjin-Hebei Region Based on Advanced DEA Model
Zhihong Li
1,2Li Zhao
3*and Zhenzhou Yuan
11 MOE Key Laboratory for Urban Transportation Complex Systems Theory and Technology, Beijing Jiaotong University
2 Beijing Engineering Research Center of Urban Transport Infrastructure Construction, Beijing University of Civil Engineering and Architecture
3 China Academy of Urban Planning and Design
* Corresponding Author, Email: [email protected] Received: 08 November, 2015; Accepted: 01 March, 2016
Key words: Highway transportation, Efficiency evaluation, Advanced DEA model, Beijing-Tianjin-Hebei Region
Abstract: Regional traffic efficiency plays a key role in the development of a regional economy and its social development. How to accurately explain inherent associations and mechanisms is very significant for regional transport development and investment benefits. This paper analyses the road transport and economic development data for Beijing-Tianjin and Hebei, the Yangtze River Delta and Pearl River Delta city populations, identifies an investment and yield indicator system to effectively reflect road transport efficiency and economic development, and establishes a hybrid data envelopment analysis model based on investment indicator preferences. This model is used to compare and analyze the highway transportation efficiency of the whole Beijing-Tianjin- Hebei region and all cities in this region. The conclusion is that the highway transportation efficiency of the Beijing-Tianjin-Hebei region is less than it is in the Yangtze River Delta and Pearl River Delta urban agglomeration, and the highway transportation efficiency of cities in the Beijing-Tianjin-Hebei region are also very different, so different investment strategies should be made for the highway transportation efficiency of different cities. The research results also indicate that improvement of the regional transportation service capability not only depends on expansion of the regional transportation scale, but also depends on improvement of the regional transportation operation efficiency, and maintains support for intensified and sustainable development routes.
1. INTRODUCTION
The state pays much attention to the long-term development of the Beijing- Tianjin-Hebei region and regards the collaborative development of the Beijing-Tianjin-Hebei region as a key state strategy. Transportation is the foundation for economic development. The chairman, Xi Jinping, proposes
“transportation integration as the leading field” for collaborative development
of the Beijing-Tianjin-Hebei region. As an advance project, the integration of
Li, Zhao, & Yuan 37 transportation may become the first breakthrough field in collaborative development within the Beijing-Tianjin-Hebei region. As the key capital area, the total population of the Beijing-Tianjin-Hebei region is over 100 million.
The Beijing-Tianjin-Hebei region is expected to drive and connect the south and north areas and become a new area of economic growth area China.
However, development of the three regions has been very unbalanced for a long period and highlighted issues such as continuous, deteriorated ecological environments and unbalanced urban and town system development are faced.
With an increase of the investment to transportation infrastructures from 2016, transportation infrastructure is currently under construction in these regions.
How to balance the relation between investment and economic development of the transportation infrastructure is still a difficult subject. Mutual relations between regional transportation and economic development should be further evaluated in a quantitative manner.
This paper focuses on the highway transportation and economic development data of the urban agglomeration in the Beijing-Tianjin-Hebei region and the Yangtze River Delta and Pearl River Delta region, studies mutual relations between regional highway transportation and the economy, identifies the weight of the impact of the investment indices to the regional economy by using the analytic hierarchy process (AHP), establishes a highway transportation efficiency evaluation index system, and applies the data envelopment analysis (DEA) model to comprehensively evaluate the highway transportation efficiency of the whole urban agglomeration and of different cities. By analyzing the transportation highway indices in Beijing- Tianjin-Hebei and the Yangtze River Delta and Pearl River Delta regions and its development trend, this paper reasonably evaluates highway transportation operation efficiency and scale adaptation of the Beijing-Tianjin-Hebei region from the view of the investment and yield of the city’s highway transportation, and provides reference for regional transportation decisions.
On the one hand, many scholars have studied the coordinated development of transportation, economy, society and the natural environment. Wang, C.-X.
(2004) constructed a gray coordination model and coordination coefficient to show coordination degree of the economy and traffic by constructing an
“Economy-Transportation System” and applying the system theory idea.
Wang, W. et al. (2014) determined the coordination degree between the regional economy and transportation at different times, coordination relationships between different modes within regional transportation, and analyze the coordination degree between the regional economy and transportation and within the transportation system by analyzing the elastic relations of the related indices between regional transportation and the regional economy, and between different modes within the regional transportation. Wang, D. et al. (2003) simulated the future development trends of transportation and technology by using the production function method based on time sequences. They obtain comprehensive evaluation indices such as comprehensive transportation indices and resource configuration performance indices by using the indices method based on the comprehensive performance, supply and demand balance and resource configuration idea, and evaluate the degree of adaptation and coordination between transportation and economic development by using the transportation balance factor, factor analysis method and the DEA model based on the comprehensive evaluation indices.
On the other hand, the data envelopment analysis (DEA) method is mainly
used to evaluate whether using multi-investment and multi-yield decision
units of same type is an effective non-parametric statistics method in
technology, as it is extensively applied for efficiency evaluation in different fields and industries of the social economy. Correa (2012) analyzed current completion and efficiency conditions of the Columbian highway and railway system by using the DEA model. The research results indicate that the total average efficiency of the railway is 74.4%, and the general average efficiency of the highway is 20.56%, thereby the railway has higher efficiency in the resource configuration. Karlaftis (2004) surveyed the efficiency and benefits of the urban transportation system by using the DEA, the global efficient production function and the data from 256 transportation systems in North America over five years. The empirical data proves that the efficiency is positively correlated with the benefits. Chiu, Huang, and Ting (2011) evaluated the efficiency of transportation and the economy in China by using the value chain DEA model. Xiong, Ning, and Pan (2006) analyzed the operation efficiency of the constructed “Transportation-Economy” hybrid system by selecting multiple investment and yield indices and applying the DEA method to transportation and economy data over a 15 year period in China. Correa (2012), Jiang (2009) analyzed and evaluated the transportation system efficiency, and built the evaluation index system.
On the whole, regional traffic efficiency embodies the development of regional economies and society. With economic transformation and continuous promotion of social reforms, the relationships between the existing traffic and economy will continuously change. It is difficult to describe clearly the inherent active mechanisms between traffic efficiency and economic development based on existing research. The traditional DEA method has remarkable strengths in evaluation and research of traffic efficiency, but it is difficult to embody differences among input and output indices due to restrictions of the model. The traditional model cannot describe the maximum demand benefits under different conditions.
2. PROBLEM DESCRIPTION and modeling
2.1 Construction of investment and yield index system
Generally, factors such as investment capital, human power, material resources and functional yields of transportation services should be considered in research on highway transportation efficiency of urban agglomerations (Wang, W. et al., 2014). The mileage of the backbone highway network (km), average highway network density per persons (km/person) and highway network area density (km/km
2) represents the human power, labor and invested funds, and reflects the invested resources to the highway transportation system’s efficiency within the urban agglomeration. In addition, the average GDP per person, unit area GDP (10,000 yuan/ km
2) and highway network yield of unit length (100 million yuan/km) reflect the economic benefit yields of the highway transportation efficiency system of the urban agglomeration and are key parts of highway transportation efficiency.
The highway passenger transportation capacity (10,000 persons) and cargo capacity (10,000 tons) represent the functional yield of the transportation services. The urbanization rate (%) reflects the development and optimization degree of cities and also determines if the highway transportation is efficient within the urban agglomeration.
By combining the current conditions and features of highway
transportation in the Beijing-Tianjin-Hebei, Yangtze River Delta and Pearl
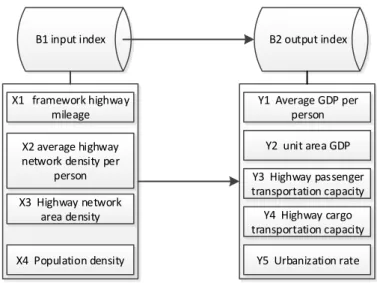
Li, Zhao, & Yuan 39 River Delta urban agglomerations, scientific evaluation indices, and obtainability and quantification of the indices values, the above indices are selected as the input and output indices of the model. These input and output indices can correctly reflect the contents and inherent associations of the regional highway transportation efficiency from a particular perspective. The wholly associated input and output indices compose the highway transportation efficiency evaluation system of the urban agglomeration. The input and output evaluation index system of the highway transportation efficiency of the urban agglomeration is shown in Figure 1.
X1 framework highway mileage X2 average highway network density per
person X3 Highway network
area density
X4 Population density
Y1 Average GDP per person Y2 unit area GDP Y3 Highway passenger transportation capacity
Y4 Highway cargo transportation capacity
Y5 Urbanization rate
B1 input index B2 output index
Figure 1. Evaluation index system of inputs and outputs for highway efficiency
2.2 AHP-DEA combination model based on indices reference
The DEA model mainly compares relative efficiency between evaluated organizations via mathematical programming and computing. The basic function of the DEA model is “evaluation”, especially when evaluation of
“relative good or bad” of multiple similar samples is studied. Parameters need not be estimated in advance, so this model is very advantageous in subjective factor avoidance, computing simplification and error reduction. The DEA model uses the actual indices value in this scheme, which avoids the standard cost of each service. This model can transform multiple investments and multiple yields to the numerator and denominator of the efficiency ratio without need of transforming them to the same money unit, so it can avoid the errors in transformation of many evaluation methods. The DEA model can clearly measure the highway transportation efficiency of the urban agglomeration and enhance objectivity and implement ability of evaluation.
However, the indices are regarded equally in terms of the evaluation of a traditional DEA model (C
2R). The differences of evaluation decisions to different indices are not considered. Based on the subjective factors of the indices preference degree, the AHP method is used to analyze the importance of the investment indices, identify the weight of the indices and establish an AHP-DEA combination model. The AHP-DEA model is used to evaluate and analyze the highway transportation efficiency of the urban agglomeration.
Assuming that each of n decision units (DMU) has m inputs (namely m
input indices) and s outputs (namely s output indices), the input and output
vector of j
thdecision unit DMU
jare represented with X
jand Y
j, and V and U are the weight coefficients, we can get:
1 2
( , , , )
Tj j j mj
X X X L X (1)
1 2
( , , , )
Tj j j sj
Y Y Y L Y (2)
1 2
( , , ,
m)
TV V V L V (3)
1 2
( , , ,
s)
TU U U L U (4)
0, 0, 0, 0
ij rj i r
X Y V U , j 1, 2, L , m , i 1, 2, L , m ,
1, 2, ,
L
r s
.X
ijindicates the i
thinput indices of j
thdecision unit. Y
rjindicates r
thoutput indices of j
thdecision unit, each decision unit has corresponding efficiency evaluation indices as follows:
1
1
s r rj r
j m
i ij i
U Y h
V X
(5)
The DEA model identifies the weight by optimization to make the evaluation of a group of decision units more objective. The weight optimization aims to maximize efficiency, so the qualitative differences of the vector weights are not considered in actual problems. The system evaluation has specific requirements for input and output in some cases and certain preference is required for the weight indices, namely the expert interference.
At this time, the pure DEA model cannot implement this feature well, so the APH-DEA analysis model is proposed. The input and output weight indices are ranked by certain order. Assuming that final m input components and s output components have a certain sequence, namely the preference sequence, the weight vector of the investment variant is computed by using the AHP method:
1 2
1
( , , , ), 1
L
m
m m i
i
(6) The relative efficiency optimization evaluation mode of the DMU
0decision unit is described as follows:
0 1 0
0 1
max
s r rj r
j m
i ij i
U Y h
V X
(7)
0 1
0 1
1, 1, 2, ,
. .
0, 1, 2, ,
0, 1, 2, ,
( , ) 0
L
L L
s r rj r
m i ij i
i r
U Y
j n
V X s t
V i m
U r s
m s
(8)
0
h
jare the efficiency evaluation indices of the decision unit, ( , ) m s is
the investment and yield weight matrix. Assuming that m 3 , the final
preference weight vector computed by AHP is (
1,
2,
3) . If they are ranked
as (
2,
1,
3) by descending order, it can be decomposed as
2 a
1,
Li, Zhao, & Yuan 41
1 3
b . a and b depend on the final computed weights. The ( , ) m s matrix is expressed as follows:
1 0 0 0
( , )=
1 0 0 0
m s a
b
L
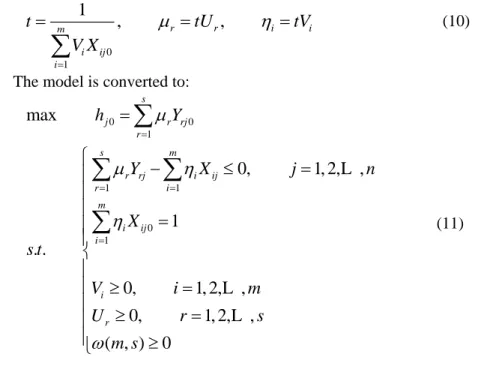
L (9) The equation (2) is a fraction programming model and is difficult to solve, so it is converted to a linear programming model for the solution:
0 1
1 ,
r r,
i im i ij i
t tU tV
V X
(10)
The model is converted to:
0 0
1
1 1
0 1
max
0, 1, 2, ,
1 . .
0, 1, 2, ,
0, 1, 2, ,
( , ) 0
s
j r rj
r
s m
r rj i ij
r i
m i ij i
i r
h Y
Y X j n
X s t
V i m
U r s
m s
L
L L
(11)
3. SIMULATION COMPUTING AND RESULT ANALYSIS
3.1 Quantification of evaluation indices
With the urban agglomerations in Beijing-Tianjin-Hebei, Yangtze River Delta and Pearl River Delta regions as the analysis samples, based on the input and output index system in Figure 1 and the annual statistical data of the national economy and social development in different provinces, the input and output indices data are obtained as shown in Table 1:
Table 1 Data of input and output indices for urban agglomeration
DM U
Urban agglomeratio n
Input indices Output indices
X1 X2 X3 X4 Y1 Y2 Y3 Y4 Y5
104k m
km/10
4 p
km/km
2
p /km
2
100 millio
n yuan /104 p
100 millio
n yuan /km2
104 p 104 tons --
1
Beijing- Tianjin- Hebei
14.84 16.82 0.79 0.0
5 6.62 0.31 13864 6
18587 6
0.5 6
2 Yangtze River Delta
17.17 15.44 1.52 0.1
0 9.38 0.93 40524 0
54238 0
0.6 7 3 Pearl River
Delta
7.51 11.58 1.34 0.1
2 7.69 0.89 28573 3
19905 6
0.6 3
Note: Until the end of 2014, p = person
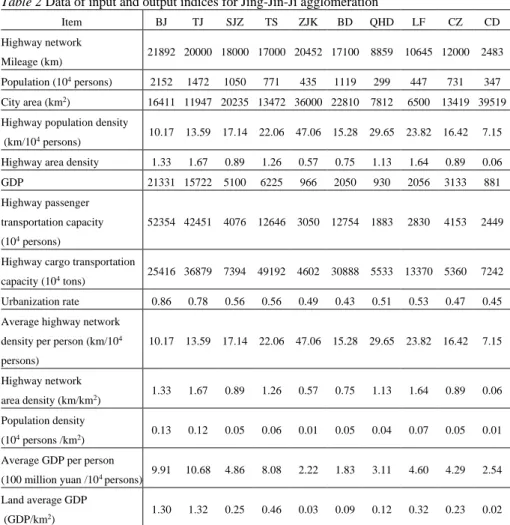
Table 2 Data of input and output indices for Jing-Jin-Ji agglomeration
Item BJ TJ SJZ TS ZJK BD QHD LF CZ CD
Highway network
Mileage (km) 21892 20000 18000 17000 20452 17100 8859 10645 12000 2483 Population (104 persons) 2152 1472 1050 771 435 1119 299 447 731 347 City area (km2) 16411 11947 20235 13472 36000 22810 7812 6500 13419 39519 Highway population density
(km/104 persons) 10.17 13.59 17.14 22.06 47.06 15.28 29.65 23.82 16.42 7.15 Highway area density 1.33 1.67 0.89 1.26 0.57 0.75 1.13 1.64 0.89 0.06
GDP 21331 15722 5100 6225 966 2050 930 2056 3133 881
Highway passenger transportation capacity (104 persons)
52354 42451 4076 12646 3050 12754 1883 2830 4153 2449
Highway cargo transportation
capacity (104 tons) 25416 36879 7394 49192 4602 30888 5533 13370 5360 7242 Urbanization rate 0.86 0.78 0.56 0.56 0.49 0.43 0.51 0.53 0.47 0.45 Average highway network
density per person (km/104 persons)
10.17 13.59 17.14 22.06 47.06 15.28 29.65 23.82 16.42 7.15
Highway network
area density (km/km2) 1.33 1.67 0.89 1.26 0.57 0.75 1.13 1.64 0.89 0.06 Population density
(104 persons /km2) 0.13 0.12 0.05 0.06 0.01 0.05 0.04 0.07 0.05 0.01 Average GDP per person
(100 million yuan /104 persons) 9.91 10.68 4.86 8.08 2.22 1.83 3.11 4.60 4.29 2.54 Land average GDP
(GDP/km2) 1.30 1.32 0.25 0.46 0.03 0.09 0.12 0.32 0.23 0.02 Note1: BJ: Beijing, TJ: Tianjin, SJZ: Shijiazhuang, TS: Tangshan, ZJK: Zhangjiakou, BD:
Baoding, QHD: Qinhuangdao, LF: Langfang, CZ: Cangzhou, CD: Chengdu Note2: Until the end of 2014
3.2 Model computing and analysis
3.2.1 Data pre-processing and hot spot analysis
Based on the equation (6), Lingo software is used for computing. Based on
the efficiency of Beijing-Tianjin-Hebei, Yangtze River Delta and Pearl River
Delta for the optimal solution, three group models are established. The final
results are shown in Table 3. The final results are described as follows: h 1
and S
and S
are 0 for the urban agglomeration in the Yangtze River Delta
region, so the DEA is effective. h 1 and S
0 or S
0 for the urban
agglomeration in Beijing-Tianjin-Hebei and Pearl River Delta regions, so the
DEA is weakly effective. Based on the results, the highway transportation
efficiency of the urban agglomeration in the Yangtze River Delta is
maximized, followed by the Pearl River Delta. The efficiency of Beijing-
Tianjin-Hebei is minimal. The difference between the Yangtze River Delta
and Pearl River Delta regions is smaller. The data indicate that the highway
network area density of the Beijing-Tianjin-Hebei region is significantly
lower than that of the urban agglomeration in the Yangtze River Delta and
Pearl River Delta regions, and its population density is also slightly less, so
the highway network has certain construction growth space.
Li, Zhao, & Yuan 43
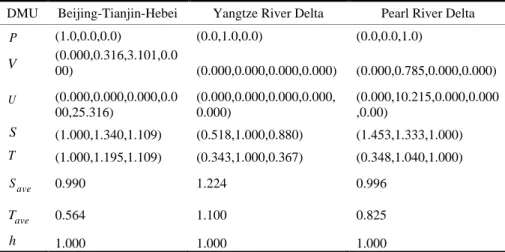
Table 3 Total result of three urban agglomerations based on AHP-DEA model
DMU Beijing-Tianjin-Hebei Yangtze River Delta Pearl River Delta
P (1.0,0.0,0.0) (0.0,1.0,0.0) (0.0,0.0,1.0)
V (0.000,0.316,3.101,0.0
00) (0.000,0.000,0.000,0.000) (0.000,0.785,0.000,0.000)
U (0.000,0.000,0.000,0.0 00,25.316)
(0.000,0.000,0.000,0.000, 0.000)
(0.000,10.215,0.000,0.000 ,0.00)
S (1.000,1.340,1.109) (0.518,1.000,0.880) (1.453,1.333,1.000) T (1.000,1.195,1.109) (0.343,1.000,0.367) (0.348,1.040,1.000)
Save 0.990 1.224 0.996
Tave 0.564 1.100 0.825
h 1.000 1.000 1.000
Similarly, to analyze the highway transportation and economy data in the Beijing-Tianjin-Hebei region, the final computed highway transportation efficiencies are shown in Table 4. The computing results are described as follows: h 1 and S
0 or S
0 for the final highway transportation efficiency of Beijing, Tianjin, Tangshan, Baoding and Chengde, so the DEA is weakly effective for highway transportation efficiency in Beijing, Tianjin, Tangshan, Baoding and Chengde, but the production efficiency in these cities is maximized compared to other cities. The high transportation investment is effective and the highway transportation efficiency has huge development potential in the future. h 1 for the highway transportation efficiency in Shijiazhuang, Zhangjiakou, Qinhuangdao, Langfang and Cangzhou.
Compared to the first-class cities in Beijing-Tianjin-Hebei, the highway transportation efficiency in these cities can be further improved.
Table 4 Data of inner cities in Jing-Jin-Ji agglomeration based on AHP-DEA model
City
V U
h Rank Highway
network mileage
Highway population
density
Highway area density
Population density
Average GDP
per person
Land average
GDP
Highway passenger transportation
capacity
Highway cargo transportation
capacity
Urbanization rate
BJ 0.0000 0.0000 4.409171 0.0000 0.0000 0.0000 0.0001 0.0000 0.0000 1.0000 1 TJ 0.0000 0.0000 0.9791 146.2115 0.0000 6.9061 0.0000 0.0000 0.0000 1.0000 1 SJZ 0.0000 0.3253 0.0000 184.0479 1.2996 0.0000 0.0000 0.0000 0.0000 0.6312 4 TS 0.0000 0.1463 3.0076 0.0000 0.0000 0.0000 0.0000 0.0001 0.0000 1.0000 1 ZJK 0.0000 0.0000 0.0000 2000.0000 0.0000 0.0000 0.0010 0.0000 11.0472 0.9459 2 BD 0.0000 0.2329 4.7778 0.0000 0.0000 0.0000 0.0002 0.0003 0.0000 1.0000 1 QHD 0.0000 0.0000 0.0000 666.6667 0.0000 19.9296 0.0000 0.0000 6.9501 0.5085 6 LF 0.0016 0.0000 0.0000 0.0000 0.8543 6.6740 0.0000 0.0000 0.0000 0.6253 3 CZ 0.0000 0.3278 0.0000 185.4552 1.3096 0.0000 0.0000 0.0000 0.0000 0.5614 5 CD 0.0000 1.2153 0.0000 110.7177 0.0000 0.0000 0.0000 0.0000 32.0513 1.0000 1 Note1: BJ: Beijing, TJ: Tianjin, SJZ: Shijiazhuang, TS: Tangshan, ZJK: Zhangjiakou, BD:
Baoding, QHD: Qinhuangdao, LF: Langfang, CZ: Cangzhou, CD: Chengdu
4. DISCUSSIONS AND CONCLUSIONS
This paper analyzes the weakness of the traditional DEA(C
2R) model,
establishes an AHP-DEA model, computes, and analyzes and evaluates the
highway transportation efficiencies of the urban agglomerations in Beijing-
Tianjin-Hebei, Yangtze River Delta and Pearl River Delta regions. The
differences of the weight indices are not considered in the traditional DEA(C
2R) model. The evaluation results indicate that the DEA model is effective for the highway transportation efficiency of the Yangtze River Delta and Pearl River Delta regions and is weakly effective for the highway transportation efficiency of the Beijing-Tianjin-Hebei region. Based on the AHP-DEA model, the computing results indicate that the DEA is effective for urban agglomerations in the Yangtze River Delta region and is weakly effective for urban agglomerations in the Pearl River Delta and Beijing- Tianjin-Hebei region, so it is necessary to further perfect the highway transportation system and increase highway transportation development in the Beijing-Tianjin-Hebei and Pearl River Delta regions in future. The highway transportation efficiency of three urban agglomerations are ranked as Yangtze River Delta region, Pearl River Delta region and Beijing-Tianjin-Hebei region by descending order. To analyze the cities in the Beijing-Tianjin-Hebei region, the DEA is weakly effective for the cities in the Beijing-Tianjin-Hebei region (Beijing, Tianjin, Tangshan, Baoding and Chengde), so the development potential is huge. It is necessary to further perfect the highway transportation system and improve the highway transportation efficiency. The highway transportation efficiency of Shijiazhuang, Zhangjiakou, Qinhuangdao, Langfang and Cangzhou is less. The highway transportation efficiency is less than 0.7, except in Zhangjiakou. It indicates that the investment in the highway transportation infrastructure is insufficient; it is necessary to promptly improve the highway transportation facilities and improve highway transportation efficiency.
REFERENCES
Chiu, Y.-H., Huang, C.-W., & Ting, C.-T. (2011). "Measuring the Repair Performance for Stricken Cultivated Land and Agricultural Efficiency in China with a Modified Two-Stage Dea Model". Asia-Pacific Journal of Operational Research, 28(5), 633-649.
Correa, C. A. V. (2012). "Economic Evaluation of Current Conditions of Competition and Efficiency of Automotive and Rail Systems in Colombia". Energy Policy, 46, 78-87.
Jiang, C. (2009, May, 22-24). "A Model of Evaluating Transportation System Efficiency Based on Data Envelopment Analysis Approach". Paper presented at the Electronic Commerce and Security 2009, Nanchang.
Karlaftis, M. G. (2004). "A Dea Approach for Evaluating the Efficiency and Effectiveness of Urban Transit Systems". European Journal of Operational Research, 152(2), 354-364.
Wang, C.-X. (2004). "Quantitative Study of Transportation's Contribution to National Economy Growth". China Journal of Highway and Transport, 1(7), 94-98.
Wang, D., Li, H., Wang, J., & Ji, J. (2003). "Research and Application of Contribution Rate Calculation for Highway Transportation Development on National Economic Growth".
China Civil Engineering Journal, 36(7), 100-104.
Wang, W., Wang, J., Wu, J., Wang, Q., & Liu, C. (2014). "Highway Traffic Efficiency Evaluation of Chang-Zhu-Tan Urban Agglomeration Based on a-Prefer-Dea Model".
Journal of Beijing University of Technology, 12(12), 1848-1854.
Xiong, C., Ning, X., & Pan, Y. (2006). "Evaluation Coordinated Development between Chinese Comprehensive Transportation Modes". Systems Engineering, 24(6), 1-7.