Local Spatial Impacts of Globalization in
Developing Countries: The Case of Sohar, Oman
著者 Talal Al‑Awadhi
journal or
publication title
International Review for Spatial Planning and Sustainable Development
volume 5
number 3
page range 25‑38
year 2017‑07‑15
URL http://hdl.handle.net/2297/48389
doi: 10.14246/irspsd.5.3_25
25
DOI: http://dx.doi.org/10.14246/irspsd.5.3_25
Copyright@SPSD Press from 2010, SPSD Press, Kanazawa
Local Spatial Impacts of Globalization in Developing Countries:
The Case of Sohar, Oman
Talal Al-Awadhi
1*1 Department of Geography, College of Arts and Social Sciences, Sultan Qaboos University
* Corresponding Author, Email: [email protected]
keywords: Globalization, Economic Change, Spatial Impact, Remote Sensing, Sohar, Urbanization Pattern,
Abstract: In the last few decades, economic development and urban expansion have become a feature of modern society, especially with fast-growing economies in both developed and developing countries. Economic activities play a major role in most urban activities in all countries, controlling urban growth and its trends, which then could lead to affecting the land use change over time.
Globalization in general terms refer to the expansion of global linkages and implies the opening of local and national outlooks to a broader perspective of an interconnected and interdependent world with free transfer of capital, goods, and services. The Sultanate of Oman has undergone rapid globalization in the last three decades, and Sohar city is an example of globalization in action. The city has grown from discrete isolated settlements with fewer than 35,000 inhabitants in the late 1970s to a medium size urban center with a total population of almost 197,000 inhabitants in fewer than 35 years. In the last fifteen years alone, the city has received more than $10 billion investment value from both government and international investors. This money has been invested mainly in the Sohar port, industrial area and free zone area as the focus of domestic and international investment in the city. This study aims at displaying and measuring the spatial impact of globalization on urban growth of Sohar city. The methodology employed in the study is based on a combination of Geographical Information Systems (GIS) and Remote Sensing (RS) to investigate the spatial changes of land use in addition to other supporting socio-economic and demographic data. The study traced the historical development of the city growth, and the results have revealed the substantial change particularly in the growth and expansion of built-up area into open space and green areas.
1. INTRODUCTION
There is no standard definition of globalization. In the literature, the term globalization is widely used to describe the processes of interaction and integration among the capital, people, information, media, investment, politics, labour, technology,...etc. between different nations (Leaf, 2002).
Other scholars like Janelle and Beuthe (1997) define globalization as the increasing geographical scale of economic, social, and political interactions.
Defined thus, globalization is not a new practice. The practice of the
exchange of goods between people and countries has existed since antiquity,
with goods often crossing thousands of kilometres; for example, goods were
transferred to China and Europe throughout the silk road in the Middle Ages.
The term “globalization” began to be used broadly in the early 1960s by social scientists; while economists have used the term since the 1980s (Guillén, 2001; Yeung, 2002)
In the last few decades, there have been huge concerns by scientists about the impact of globalization (Giddens, 1990; Janelle & Beuthe, 1997; Ezcurra
& Rodrí guez-Pose, 2013; Liao & Wei, 2015; Leaf, 2002; Lessmann, 2014;
Mahgoub, 2004; Mahutga & Smith, 2011; Mazrui, 2001; Held & McGrew, 2007; Pani, 2009; Vongpraseuth & Choi, 2015). According to many scientists (Leaf, 2002; Held & McGrew, 2007; Vongpraseuth & Choi, 2015), globalization has led not only to the expansion of the boundaries of markets and communications but also to the spread of cultural awareness among consumers all over the world. There are no limitations on capital transfer, goods, people, technology and information between countries, and globalization started crossing international boundaries by finding new opportunities to share goods or investments.
These processes of globalization could have positive or negative effects on the environment, culture, society, and economic and political systems.
According to Held and McGrew (2007), globalization activities have consequences in distant regions. The greatest impact of globalization is a foreign direct investment (FDI) (Vongpraseuth & Choi, 2015), which, in most countries, create opportunities for bettering the lives of the citizens.
The priority in most countries around the world, therefore, is to attract direct foreign investment which, in turn, increases the national Gross Domestic Product (GDP) (Tuan & Ng, 2007). On the other hand, there are some negative effects of globalization, which come in different forms, such as sociocultural changes due to the movement of people from developed areas to developing regions (Mazrui, 2001). Perhaps the strongest impact of globalization in the city environment is the localization clash (Mahgoub, 2004) which means some locality characteristics may lose or change with time. The effects of globalization on cities are complex, multifaceted and geographically diverse (Leaf, 2002). All developed and developing countries have encouraged foreign investors to invest more capital in their economies.
Furthermore, some developing countries have looked at foreign direct investment (FDI) as the main solution to most of their development issues.
However, these countries need to pay special attention to the following consequences of globalization:
The impact of globalization on environmental changes, specifically on how environmental degradation may result from intensive industrial development and urban growth. This includes the implications for agricultural land loss and pollution.
How the capital investment will be directed; the lost control on the foreign direct investment may have also negative consequences on the economy of the country. An example of losing control, investment will be directed to fast return economic fields rather than strategic economic sectors.
The impact on the structure of planned land use and uncontrolled urban growth.
There are always debates about the benefits and shortcomings of globalization at the global level, creating such dichotomies as north vs.
south, integrated centers vs. marginalized peripheries or littoral fringes vs.
continental areas. However, the issues of the relationship between
globalization and territories are multifaceted and complex. The literature
shows that, at different spatial scales, local, regional, national or continental,
the territorial dimension has become an essential component of urban
development and spatial organization analysis. Empirical studies have shown that globalization induces major structural changes in national economies and spatial configuration (Leaf, 2002; Mahgoub, 2004; Mazrui, 2001; Pani, 2009; Vongpraseuth & Choi, 2015; Zhu, Qian, & Gao, 2011). Cities play a major role in the redistribution of populations, the activities and the consequent socio-spatial disparities. The socio-spatial impacts of integration into the global economy appear more clearly in national and regional scales, particularly in the countries of the integrated periphery. Globalization impinges on the national territories, mainly by redirecting national resources, and local and foreign investments alike towards economic gateways. The hasty development of these gateways or globalized metropolises is one of the most obvious effects of globalization. Globalization; hence, transforms the city into an internationalized space whose limits and aspects are rather related to an exogenous network. It is a selective system which inevitably creates differences among the components of the national urban system because globalized cities "are connected to physical and virtual international networks that promote movement of wealth and extend areas of influence"
(Dlala. H, 2002). Thus, the spatial development of globalised cities is reinforced by exogenous factors that hasten the spread of infrastructures, services, and the development of housing, in addition to adequate amenities.
This phenomenon affects all dynamic urban centers of developing countries.
This trend was already visible before 1980 (Dlala. H, 2002).
In the last few decades, several scientists have tried to investigate the relationships between globalization, urban growth, and regional development, and how globalization affects land use change in urban areas (Logan & Molotch, 1987; Feagin & Parker, 1990; Chitrakar, Baker, &
Guaralda, 2016; Leaf, 2002; Vongpraseuth & Choi, 2015; Wei & Liefner, 2012). In this context, the present article highlights the issue of how globalisation could change the structure of urban growth in the city of Sohar in the Sultanate of Oman. The main aim of the paper is to quantify the spatial impact of development and the connection of the city to the globalized space and measure the direct impact of such development on the urban dynamic and expansion. In this paper, I investigated how Sohar city has developed and grown from 2003 to 2015, and how some land, with special emphasis on agriculture, has been lost. This change in the urban setting of Sohar is closely related to dense global investments received by the city as the study assumes.
2. CONTEXT
The Sultanate of Oman is part of the integrated periphery, thanks to its
strategic location between the Strait of Hormuz and the maritime routes in
the Indian Ocean. The proximity of the dynamic metropolis of Dubai and the
big consumer markets of the Arab Gulf countries are additional assets that
reinforce this trend towards the integration of Oman into regional and global
economies. Indicators of globalisation such as the degree of economic
openness, the importance of foreign trade in the national economy, and KOF
index, which measures the dimensions of globalisation traits, including
economic, social, and political aspects all indicate the steady integration of
Oman in the global economy. The KOF index of the country in 2013 was
61.38 and ranked 66th out of 207 listed countries, while it was only 51.67 in
2007 and ranked 78th out of 122 countries. In 2015, the KOF index of the
country was 61.58 and ranked 67th out of 207 listed in the index (KOF,
2016). This integration is mainly due to the economic component of KOF
index, which rose to 75.33 with the 38th position in the world ranking. In fact, the foreign trade of the Sultanate has developed, and its growth rate has increased faster than the GDP. This evolution is mainly due to exports that have progressed faster than imports Figure 1.
Figure 1.Evolution of foreign trade in Oman. (1 Million Rial = 2.59 US $ Million) (Source: (MoNE (Ministry of National Economy), 2001; NCSI (National Center for Statistics and
Information), 2015a))
The improvement of Omani foreign trade is due not just to oil exports; the share of non-oil products has also significantly increased from 5% of total export value in 1988 to 17.4 % in 2010 and to 20.2% in 2015. The amount of re-exports had also substantially increased from 235.8 million to 2247.6 million in 2010, while in 2015 it had reached 2944.1 million OMR. (MoNE (Ministry of National Economy), 2001; NCSI (National Center for Statistics and Information), 2015b).
Foreign Direct Investments (FDI), as an important indicator of globalisation, grew at an accelerated pace of 19.36% per year during the period 2005 –2013, but between 2009 – 2013, the growth was only 7.24%.
On the other hand, Total Foreign Investment (TFI) developed at a rate of 16.51% per year between 2005 and 20013, but between 2009 – 2013 the growth was only 4.77% as shown in Table 1.
Table 1.Development of Foreign Investments in the Sultanate of Oman in R.O. Million (Source. (NCSI (National Center for Statistics and Information), 2012, 2015b)
Item 2002 2005 2007 2009 2013
Growth rate (%annually) 2005 –
2013
2009 - 2013 Total Foreign
Investment - 4007 9913 11295 13610.2 16.51 4.77
Foreign Direct
Investment (FDI) 721 1623 3519 5057 6688.4 19.36 7.24
To fulfil the requirements of globalisation, three great maritime hubs have been developed during the last two decades, the Salalah port in the south, the Sohar industrial area in the north, and Al-Doqum industrial area in the middle of Oman. Sohar project is the largest in terms of invested capital, the number of domestic and foreign companies and mobilized space. The Sohar project includes an industrial area (21 Km
2), a free zone (45 km
2), an industrial port (21 km
2) and an airport (under construction, 20 km
2). The size of investments for approximately 184 industrial plants amounted to US$ 10 billion.
0 5000 10000 15000 20000 25000 30000 35000
Million Rial
GDP Foreign Trade Exports Imports
1988 2000 2010 2014
Figure 2.GeoEye Images for Sohar Port (January 2012) (Image Source: MoNE)
3. STUDY AREA
The Sultanate of Oman is administratively divided into 11 governorates
that are subdivided into 61 Wilayats. Wilayats is the plural of Wilaya, which
means province in Arabic. Sohar is both the center of the Governorate and at
the same time the center of the Wilaya. It is the center of the governorate of
Al-Batinah North, which includes six Wilayats. The city is also the center of
its Wilaya, which is in the north-east of the country, and it directly overlooks
the Sea of Oman. Sohar has 40 km of coastline. Its total area is about 2143
km
2and its population is approximately 147,000, according to the 2010
census, and it reached almost 197,500 in 2014. 1 In addition to the city of
Sohar, the Province of Sohar includes several rural settlements of different
sizes scattered in the area between the gas pipeline in the east and the
mountains in the west. The study area extends between latitudes 23
O47' 16''
and 24
O28' 7'' in the north and longitudes 56
O15' 48'' – 56
O50' 30'' in the east, as shown in Figure 3. While Figure 2 shows the Sohar port with the industrial area.
Figure 3.The location of the Wilayat and City of Sohar
4. MATERIAL AND METHODS
The study is based on fieldwork; GIS and RS technologies which were
used to measure urban change in the city. To detect and map the
demographic and spatial changes, the study used several data sets, including
the general censuses of 1993, 2003 and 2010, in addition to statistical
surveys, available satellite imageries, and vector data. To measure the extent
of the spatial impact of development in the context of globalisation in Sohar,
the study traced the evolution of the built up area through a comparison
between urban change maps of 2000, 2010 and 2015. Data analysis revealed
changes in spatial patterns and key factors of variations. For the study, the
researcher attempted to distinguish between the requirements of endogenous
urban development (housing, services, infrastructure, etc.) related to the
overall development of the Omani society and the specific implications of
new globalized urban functions within the city of Sohar.
Remote sensing techniques were used to detect and measure urban change, while GIS were used to manage and understand the urban expansion in the city in the last 15 years. Landsat (ETM) image has the capability to extract urban information in medium scale area like the Sohar area. It also has several bands to complete the analysis smoothly. Three Landsat (ETM) images (for 2003, 2010 and 2015) with 30-meter spatial resolution were used, as summarised in Table 2. The three Landsat images were downloaded
from the US Geological Department (USGS)
(http://earthexplorer.usgs.gov/). Landsat image for 2015 was geo-referenced using a WGS84 Zone 40N (UTM) coordinate system by using 10 ground control points with 20 cm accuracy. The image of 2015 was then utilised to geo-reference the other two Landsat images through image-to-image techniques. All images were also enhanced to improve their quality.
Table 2. The satellite images description used for tracking changes in the study area Satellite Date Row Path Bands Spatial
Resolution Format Landsat-7 (ETM) 21st March 2003 159 43 8 30 m GeoTIFF
Landsat-7 (ETM) 25th Feb 2010 159 43 8 30 m GeoTIFF
Landsat-8 (OLI) 14th May 2015 159 43 11 30 m GeoTIFF
The three images cover large areas of Sohar; however, the study area covers are restricted to only the center of the Wilayat, defined here as the urban built-up area along the coast of the Sea of Oman from the Sohar industrial port in the north near Majis to Majiuz Al-Sojrah in the south. It also extends from the coastal line in the east to 10 km to the west. All images were subset to the same map extent as shown in Figures 4 & 5.
Figure 4. Image subset for Landsat 2010
(source: US Geological Department (USGS) (http://earthexplorer.usgs.gov/))
Figure 5. The City of Sohar from GeoEye December 2010 (Source: NCSI)
Supervised classification techniques with a maximum likelihood algorithm were used for all three ETM images. The accuracy of the classification was verified by field checking and by comparing them with high-resolution images (Geo-Eye images for 2012). In order to measure the urban expansion of the city, several classification systems have been reviewed, such as USGS and Anderson classification (Anderson et al., 1976), Corine Classification (Bossard, Feranec, & Otahel, 2000) and Land Based Classification Standards (LBCS) (Sanjay, 2002). However, to simplify the results only three land use classes were used, which includes built up area, vegetation, and unused (open land) area. To keep results consistent for the built-up area between the three images, twenty training samples were used to achieve maximum accuracy with the supervised technique. The same training samples in the same locations were spread into the two images. This method ensured that all classes had the same value for all images. ERDAS 8.7 and ArcGIS 10.3 software were used to process the digital data, while the final outputs were manipulated and managed in ArcGIS software.
5. RESULTS AND DISCUSSIONS
It is clear that Sohar has been transformed from a medium-size urban center for a large regional metropolitan city, according to Omani city sizes;
thanks to globalization. The study shows that Sohar has witnessed some indications of globalisation in many aspects. The number of foreign companies and the amount of Foreign Direct Investments (FDI) have increased dramatically within a relatively short time. The manpower employed in the Sohar Industrial Estate, for example, rose to more than 6,200 including 2,750 Omanis and 3,450 expatriates (44.5 %) in 2012.
Figure 1 summarises the evolution of foreign trade in Oman between 2002
and 2013. Table 1 presents a huge increase in both the Total Foreign
Investment (TFI) and Foreign Direct Investment (FDI). The annual growth
rate of TFI is much higher than FDI in both 2005 – 2013 or 2009 – 2013.
The annual growth of TFI between 2005 – 2013 was 16.51%, but was only 4.77% between 2009 – 2013. On the other hand, the annual growth rate of FDI was 19.36% and 7.24% for the same periods, respectively. The decrease in growth rates in the subsequent period does not indicate a decline in the investment volume. Instead, it points to the establishment phase with a small amount of investment when compared with the later rate of investment.
In the last 10 years, Oman has received more and more foreign investments. These investments concentrate mainly on oil, gas and related industries. Sohar industrial area, Sohar Port and Sohar free zone are examples of foreign investments directed by the government. These investments played major roles in increasing the population of Sohar which has risen dramatically in the last 10 years as shown in Table 3, while Figure 5 reveals land use change that resulted from the demographic transition.
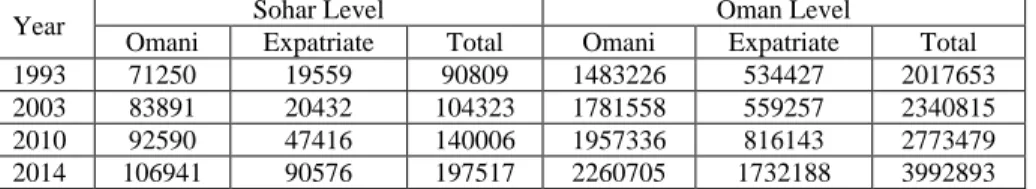
Table 3. The total population of Sohar and Oman (1993 - 2014)
(Source: (NCSI (National Center for Statistics and Information), 2013b, 2015b))
Year Sohar Level Oman Level
Omani Expatriate Total Omani Expatriate Total
1993 71250 19559 90809 1483226 534427 2017653
2003 83891 20432 104323 1781558 559257 2340815
2010 92590 47416 140006 1957336 816143 2773479
2014 106941 90576 197517 2260705 1732188 3992893
Table 4. The total urban population of Sohar (1993 - 2014)
(Source: (NCSI (National Center for Statistics and Information), 2013a, 2015b)) Year Number of population
1993 88918
2003 102150
2010 137090
2014 193403
Table 3 and Figure 6 summarises the trends of the population increase in the city between 1993 and 2014. Almost 98% of Sohar population are concentrated in urban areas as shown in Table 4. The population increased from 140,006 inhabitants in 2010 to 197,517 inhabitants in 2014, with an annual increase rate of 3.8% of the population, with the national rate of population increase being 3.3%. This shows that Sohar appears to record a faster demographic dynamism at the national scale. Also, between 1993 and 2010, the population of Sohar city increased by an annual growth rate of 2.63% compared with 1.9% at the national level. This is mainly due to the spectacular annual growth rate of expatriates (5.35% annually), who used to represent less than 20% of the total population in 2003, but the percentage increased to almost 34% in 2010, and again increased to more than 45% in 2015. The biggest population increase in Sohar occurred between 2003 and 2010 when the annual growth rate was 4.3%, while it was only 2.5% at the national level. This increase is explained by more expatriates moving to Sohar at an annual rate of 12.8%, while at the national level, the annual rate of expatriates was just 5.5%.
For comparison, there are recognised correlation between the total
population growths in the city of Sohar between 2003 – 2014, and the total
growth of FDI in Oman between 2005 – 2013. The growth was obvious
between the total growth of expatriate (between 2003 – 2014, which was
343.3%) and the growth of FDI (between 2005 – 2013, which was 312%).
This means that more foreign investment has caused greater population growth, especially of expatriates in Sohar city.
Figure 6. The trend of population growth in the city of Sohar between 1993 – 2014 (Source: former (MoNE (Ministry of National Economy), 2001; NCSI (National Center for Statistics and
Information), 2015b)
Table 5 illustrates the total area for each of the three investigated classes:
built-up areas, vegetation areas, and open land in the city, which are presented in both meter
2and km
2. The total built-up area increased from around 60 km
2in 2003 to more than 90 km
2. Simultaneously, however, the vegetation decreased from around 90 km
2in 2003 to just over 60 km
2.
Table 6 presents the difference in each class across different periods. The rate of change of the study period 2003 - 2015 is divided into three stages:
2003 – 2010, 2010 – 2015 and 2003 - 2015. Finding are almost consistent with several studies, which use either low resolution image like Landsat or high resolution images like Ikonos (Al-Awadhi, 2007, 2008; Alphan, Doygun, & Unlukaplan, 2009).
Table 5. The total area of each class at three different periods in meter2 & km2
Classes 2003 2010 2015
M2 Km2 M2 Km2 M2 Km2
Built up area 60249600 60.25 72060300 72.06 91461600 91.46 Vegetation 90483300 90.48 69840900 69.84 61850700 61.85 Open land 236979000 236.98 245810700 245.81 234399600 234.40 Total 387711900 387.71 387711900 387.71 387711900 387.71
Table 6. The difference and rate of change in each class at three different periods Classes
2003 – 2010 2010 – 2015 2003 – 2015
Differences
in Km2 Rate% Differences
in Km2 Rate% Differences
in Km2 Rate%
Built up area 11.81 9.6 19.4 26.9 31.21 51.8
Vegetation -20.64 -22.8 -7.99 -11.4 -28.63 -31.6
Open land 8.83 3.7 -11.41 -4.6 -2.58 -1.1
The annual rate of the increase in population occurred in the planned space where there is more demand for housing and services. Modern activities have also expanded at the expense of traditional activities. During the densification and the expansion of the urbanised area, large agricultural parcels were converted into urban spaces, and about 10 km
2of coastline formerly devoted to traditional fisheries was assigned to port activities. The total built-up areas (residential areas, commercial areas, roads, and industrial facilities) increased to 11.81 Km
2between 2003 – 2010, which represents an increase of about 10%. The main increase in the built-up area, however, occurred between 2010 – 2015, when it increased to 19.4 km
2, an increase of
1993 2003 2010 2014
Omani 71250 83891 92590 106941
Expatriate 19559 20432 47416 90576
Total 90809 104323 140006 197517
0 20000 40000 60000 80000 100000 120000 140000 160000 180000 200000
Population
almost 27%. On the other hand, the vegetation areas lost more than 20 km
2, a reduction of 23% during the period of 2003 – 2010. The vegetation area again lost 7.99 km2 between 2010 and 2015, this time, a loss of 11.4%. This shrinkage of vegetation could be a result of weakness in land regulation to protect agricultural land as well as salinization of soil and water. It is obvious that the built up area encroached upon vegetation along the coastal area. This happened due to the natural structure of the city. Also, between 2010 and 2015, the city built-up area also started spreading into vacant spaces and new areas were developed, especially in the north-west of the city.
Urban expansion began, in the first stage, with the intensification of the pre-existing space by integrating previously separate traditional villages (22 villages in 1986) into a continuous and compact urbanized area. In this process, a portion of the arable land had disappeared, while on the second stage, numerous residential, commercial and public plots appeared in the suburbs of the city.
Figure 7 shows that the urban area has expanded tremendously in two areas: (i) the north of the city where the industrial area was built in 2001, and (ii) in the city center of Sohar. These two patterns of growth were completely different. In the center of the city, the growth was based on converting the vegetation into built-up areas, while in the north of the city, the growth was based mainly on utilising vacant space or open land.
Figure 7. the urban expansion for different period times in Sohar (1988 - 2015)
6. CONCLUSION
It is obvious that international investment has played a major role in
improving the economic and social lifestyle of people in many countries,
especially in the developing countries such as the Far East in the Asian
continent. It has also affected the demographic conditions in these countries
which appeared in different types of migration either internationally or
locally. This paper has attempted to investigate how the foreign direct
investment has affected demographic and land use pattern in the city of
Sohar. The study results revealed some harmony in growth rate trends of
investment, total urban growth rates and changes in land use in the study
area. The increase of population and built-up area has been very obvious in
the last 10 years, especially in two areas in Sohar that are namely the north
part of the city as well as in the city center.
The spatial transformations induced by a globalised action of development in Sohar have had several implications on people's lifestyle and on the traditional land use patterns, thereby significantly affecting the metropolitan space organization. The trend of population concentration on the coastal zone is one of the larger implications of the globalisation in less developed countries. It often induces a spatial reconfiguration incompatible with the notion of sustainability. It is true that social and economic policies, in a context of globalisation, have improved the standard of life and the employment opportunities in the region; however, both the natural beauty of Sohar and its architectural heritage face serious challenges because of the hasty and unplanned urban development. However, although these changes have increased the pressure on the environment, they have also created a modern, well-equipped and very dynamic metropolis.
The results of this research, including image classification, have shown that the built up areas are mainly located in the city center and north-east of Sohar. Certainly, any more investments in the port and industrial areas in the future will create more pressure on agricultural areas, which is expected to be converted to other uses, especially residential or industrial. The urban sprawl will affect long-term reliance on these spaces as an important producer of local and regional crops. Therefore, this study offers the following recommendations:
– That urban expansion should be targeted through a systematic and well thought plan. The urban pattern should fill the gaps between scattered communities and then continue in the direction of systematic planning in open areas.
– Good urban planning should be extended towards the west, keeping a distance from the city center in order to reduce pressure on the urban heart of the city, while at the same time preventing the expansion of urban sprawl into agricultural areas.
– Regulating of license granted for the conversion of an agricultural property to residential, or commercial or industrial use.
– Further studies should address the issue of scattered urban settlements along the coastline, where most properties lack basic services. Furthermore, studies should consider a detail land use change in the city. More investigation should address the current and future condition of the agricultural area in Sohar.
ACKNOWLEDGEMENTS
The author is deeply grateful to the National Center for Statistics &
Information (NCSI) in Muscat, Sultanate of Oman for providing the datasets.
My sincere thanks also goes to my colleagues at the Geography Department at Sultan Qaboos University who made a valuable reflection on this manuscript.
REFERENCES
Al-Awadhi, T. (2007, April 11-13, 2007). "Monitoring and Modeling Urban Expansion Using Gis & Rs: Case Study from Muscat, Oman". Proceedings of Urban Remote Sensing Joint Event, 2007, Paris, France, pp. 1-5.
Al-Awadhi, T. (2008). "Analysis, Assessment and Modeling of the Urban Growth in Greater Muscat, Sultanate of Oman, Using Geographical Information Systems and Remote Sensing". Egyptian Journal of Remote Sensing and Space Sciences, 11, 93-108.
Alphan, H., Doygun, H., & Unlukaplan, Y. I. (2009). "Post-Classification Comparison of Land Cover Using Multitemporal Landsat and Aster Imagery: The Case of Kahramanmaraş, Turkey". Environmental monitoring and assessment, 151(1), 327-336.
Anderson, J. F., Hardy, E. E., Roach, J. T., & Witmer, R. E. (1976). A Land Use and Land Cover Classification System for Use with Remote Sensor Data: U.S. Geological Survey Professional Paper 964. Washington: US Government Printing Office.
Bossard, M., Feranec, J., & Otahel, J. (2000). "Corine Land Cover Technical Guide:
Addendum 2000". Technical Report, European Environment Agency. Retrieved from http://www.eea.europa.eu/publications/tech40add on 12/10/2016.
Chitrakar, R. M., Baker, D. C., & Guaralda, M. (2016). "Urban Growth and Development of Contemporary Neighbourhood Public Space in Kathmandu Valley, Nepal". Habitat International, 53, 30-38.
Dlala. H. (2002). Problematic Issues of Geography of Development. Tunis: CPU.
Ezcurra, R., & Rodríguez-Pose, A. (2013). "Does Economic Globalization Affect Regional Inequality? A Cross-Country Analysis". World Development, 52, 92-103.
Feagin, J. R., & Parker, R. (1990). Building American Cities: The Urban Real Estate Game.
Englewood Cliffs, NJ: Prentice Hall.
Giddens, A. (1990). The Consequences of Modernity. Stanford: Stanford University Press.
Guillén, M. F. (2001). "Is Globalization Civilizing, Destructive or Feeble? A Critique of Five Key Debates in the Social Science Literature". Annual review of sociology, 27(1), 235- 260.
Held, D., & McGrew, A. G. (2007). Globalization Theory: Approaches and Controversies.
Cambridge: Polity Press.
Janelle, D. G., & Beuthe, M. (1997). "Globalization and Research Issues in Transportation".
Journal of Transport Geography, 5(3), 199-206.
KOF. (2016). "Kof Globalization Index". Retrieved from http://globalization.kof.ethz.ch/ on 12/05/2016.
Leaf, M. (2002). "A Tale of Two Villages: Globalization and Peri-Urban Change in China and Vietnam". Cities, 19(1), 23-31.
Lessmann, C. (2014). "Spatial Inequality and Development - Is There an Inverted-U Relationship?". Journal of Development Economics, 106, 35-51.
Liao, F. H., & Wei, Y. D. (2015). "Space, Scale, and Regional Inequality in Provincial China:
A Spatial Filtering Approach". Applied Geography, 61, 94-104.
Logan, J. R., & Molotch, H. (1987). Urban Fortunes. Berkeley, CA: University of California Press.
Mahgoub, Y. (2004). "Globalization and the Built Environment in Kuwait". Habitat International, 28(4), 505-519.
Mahutga, M. C., & Smith, D. A. (2011). "Globalization, the Structure of the World Economy and Economic Development". Social Science Research, 40(1), 257-272.
Mazrui, A. (2001). "Pan Africanism and the Origins of Globalization: Lecture Delivered at Web Du Bois Centre for Pan-African Culture".
MoNE (Ministry of National Economy). (2001). Statistical Year Book: Muscat.
NCSI (National Center for Statistics and Information). (2012). "2010 Census Data by Localities". Muscat. Sultanate of Oman.
NCSI (National Center for Statistics and Information). (2013a). "Facts and Figures 2013".
Retrieved from
https://www.ncsi.gov.om/Elibrary/LibraryContentDoc/ben_Facts%20and%20Figures%20 2013_8cc6ee7b-f9bb-42ce-8d4b-d7f4f36b03f6.pdf on 12/05, 2016.
NCSI (National Center for Statistics and Information). (2013b). "Human Development Report 2012". Muscat. Sultanate of Oman.
NCSI (National Center for Statistics and Information). (2015a). "Foreign Investment 2009 -
2013". Muscat. Sultanate of Oman. Retrieved from
https://www.ncsi.gov.om/Elibrary/LibraryContentDoc/ben_FOREIGN%20INVESTMEN T6-5-%202015_1b5aa0b1-4513-420a-a932-989ca33d5207.pdf.
NCSI (National Center for Statistics and Information). (2015b). "Statistical Year Book".
Muscat. Sultanate of Oman. Retrieved from
https://www.ncsi.gov.om/Elibrary/LibraryContentDoc/ben_Statistical_Year_Book_2015_
740d0da1-01d2-4f42-a159-6102a49ecf59.pdf.
Pani, N. (2009). "Resource Cities across Phases of Globalization: Evidence from Bangalore".
Habitat International, 33(1), 114-119.
Sanjay, J. (2002). "Land-Based Classification Standards (Lbcs): Executive Summary".
Assessment Journal, 9(2), 49.
Tuan, C., & Ng, L. F.-Y. (2007). "The Place of Fdi in China's Regional Economic Development: Emergence of the Globalized Delta Economies". Journal of Asian Economics, 18(2), 348-364.
Vongpraseuth, T., & Choi, C. G. (2015). "Globalization, Foreign Direct Investment, and Urban Growth Management: Policies and Conflicts in Vientiane, Laos". Land Use Policy, 42, 790-799.
Wei, Y. D., & Liefner, I. (2012). "Globalization, Industrial Restructuring, and Regional Development in China". Applied geography, 32(1), 102-105.
Yeung, H. W.-c. (2002). "The Limits to Globalization Theory: A Geographic Perspective on Global Economic Change". Economic Geography, 78(3), 285-305.
Zhu, H., Qian, J., & Gao, Y. (2011). "Globalization and the Production of City Image in Guangzhou’s Metro Station Advertisements". Cities, 28(3), 221-229.