Japanese Companies
Tom Kuczynski*
(Received on October 4, 2005)
1. INTRODUCTION
The purpose of this paper is to present the results of the study of the patterns and directions of company finance in Japanese manufacturing industry in years 1988 – 2003;
quantify these tendencies, and where possible, to explain the variables which determine capital structure in these companies. It is empirical study on the relationship between capital structure determinants and models of debt-equity capital structure of Japanese manufacturing industry.
In the literature the costs and benefits of debt versus equity financing are usually well identified. The issue of what firms ought to borrow has been adequately researched in the related literature
1).
The firm markets its real assets and operating income to investors by issuing a package of financial assets. A firm makes capital structure choices to possibly minimize costs of capital and to evaluate the impact that capital financing may have on various areas of firm’s activity:
the capital structure’s impact on firm’s profitability (internal or external; fixed or floated;
secured or unsecured; short-term, mid-term or long-term financing and also the best mix of currencies), its competitive power (i.e. share of sales), and export (which of financing decisions are export stimulating; increase competitive power on domestic and international markets).
There is also a significant, but hard to measure, impact of financial structure on the two other decisions in corporate finance i.e. dividend policy and investments. Much more complex problem and much less measurable is the impact of financing decisions on the
* Graduate student; Hiroshima Shudo University, Faculty of Economic Sciences.
1) For example: Stiglitz, J. P ‘A Re-Examination of the Modigliani-Miller Theorem’ American Economic Review, vol 59, p. 784–93, 1969, Cohen, R. D. ‘An Implication of Modigliani -Miller Capital Structuring Theorems on the Relation between Equity and Debt’, Sheridan T. ‘The Modigliani and Miller Theorem and Market Efficiency’ National Bureau of Economic Research, Working paper 8641, 2001.
company’s global strategies: financial, marketing, production and human resources. It is still impossible to state which one of them is a key strategy and also fully understand the relationship between dividend policy, investments and capital structure.
A number of correlation analyses were used to investigate the determinants of Japanese companies’ capital structure and to test hypotheses based on the theory of capital structure
2). The variables have been considered regarding Tradeoff Theory, Pecking Order Hypothesis, Agency Theory and other established capital structure models. The choice of determinants that may affect capital structure (profitability, size, expected growth, uniqueness, tangibility, non-debt tax shield, dividend and market to book ratio) is based on the capital structure theories presented in section 3 below.
Data description
The materials used in this study are derived from four volumes of Japan Company Hand- book: Summer 1989 First section, Autumn 1994 First Section, Winter 1999 First Section, and Summer 2003 First Section published by Toyo Keizai Inc. Although there exist other reliable sources of data, such as Ministry of Finance I used Toyo Keizai Japan Company Handbook because it offered the most comprehensive data in terms of Japanese industry structure
3).
Thirteen manufacturing industries have been chosen for this study. The data, such as
“Sales”, “Earnings per Share — (EPS)” and “Dividend per Share — (DPS)” were extracted from the company’s financial statements. “EPS” was obtained by dividing net profit by the total number of issued shares at the close of the settlement term. “DPS” was treated as the total of the mid-term and term-end dividends. Ordinary dividends were most common, however, there are also special dividends, commemorative dividends and stock dividends regarded here. “Total Assets” included all assets possessed by the company and is composed of total of current assets, fixed assets, and deferred assets. The figure of “Total Assets” is equal to the total of liabilities and capital. “Shareholders’ Equity” was extracted from the
2) For similar study see: Allen, D. E., ‘The Pecking-Order Hypothesis: Australian Evidence’, School of Economics and Finance, University of Technology Perth WA, 1992, Baskin, J. B., ‘An Empirical Investigation of the Pecking Order Hypothesis’, Financial Management, 18, 1989, Baskin, J. B., ‘On the Financial Policy of Large Mature Corporations’, Ph. D Dissertation, Harvard University, Department of Economics, 1985, Han Suck Song, ‘Capital Structure Determinants, an Empirical Study of Swedish Companies’, the Royal Institute of Technology, 2005, and Nishioka, S. and Baba, N., ‘Dynamic Capital Structure of Japanese Firms’, Bank of Japan, 2004.
3) Other sources did not include such data as depreciation, research and development expenditures.
capital part of the balance sheet and was obtained by adding surplus to capital stock and legal reserves. “Borrowings” represent so-called interest-bearing liabilities, namely the total of short and long–term borrowings (including commercial papers), short-term bonds, convertible bonds and warrant bonds. “Return on Assets - ROA” was calculated as ratio of pre-tax profits to total assets. “Employees” indicate the number of regular full-time employees of the parent firm, excluding temporary employees, outside workers, and members of the board of directors in principle.
Because of a relatively extensive nature of the study it was necessary to introduce certain structural and methodological limitations here. The first one is that the sample does not include financial companies, which operate on functionally different financial strategies from these of manufacturing sector
4). The sample of study consists only of the biggest, interna- tional manufacturing companies. This is due to the fact that manufacturing companies are product, innovation and technology leaders for the rest of Japanese industry. They are also leading in marketing and advertising and hence, considering the process of financing decisions, may be regarded as good representatives of the whole industry. These companies dominate corporate sector in terms of capital concentration, and output volume.
The other limitation refers to the data collected for this study, which do not include, in 1988, corporate bonds, convertible bonds and warrants as in case of the data from 2003. The reason of not including them in 1988-1999 samples was the lack of such data and the fact of low level of corporate bond and warrant markets at that period, its small impact on company financial behavior
5). The level of corporate borrowings in 1988-1999 is therefore represented by the amount of bank borrowings. It may result in certain qualifications when making comparison with 2003 sample but has no impact on the results of study for the 1988-1999 samples. As all companies in the sample were affected in the same way, the lack of corporate bond data will not have any significant impact on the validity and consistency of the correlations derived from this analysis.
The other limitation is that all corporate borrowings are aggregated without making distinction between long and short-term borrowings. The division between short-term and
4) For example, the high debt ratios of firms from banking and finance sectors reflect the nature of their activities as well as any preferences they may have for funding sources.
5) Michaelas et. al. find that most of the determinants of capital structure (e.g. size, profitability, growth, and more) seem to be relevant for both short-term and long-term debt ratios, see:
Michaelas, N., Chittenden, F. and Poutziouris, P., ‘Financial Policy and Capital Structure Choice in U. K.: Empirical Evidence from Company Panel Data, Small Business Economics, 1999.
long-term debt is obviously a significant and important feature from accounting, auditing and corporate accounting management point of view. The focus of this study is, however, on corporate finance from economic and aggregated point of view, hence more detailed accounting analysis is not conducted here
6). Three important variables, such as tangibility, debt cost and market to book ratio are not available for Toyo Keizai, and I will use the data from other source. The choice for 1988 and 2003 statistical samples is not coincidental.
Year 1988 marks the peak of the financial bubble in Japan and comparing the financial conditions of companies from that period with 2003 will re-emphasize the contrasts between these two extreme periods.
This paper is organized as follows. Section 2 presents a brief overview of some commonly used leverage measures. Data on financial leverage of Japanese manufacturing companies based on the data set are also presented there. Section 3 reviews major capital structure determinants suggested by the theory of finance. Section 4 presents statistics for those determinants based on the data set and discusses the interpretation and significance of the estimates. Finally, section 5 summarizes and concludes the main findings of this paper.
2. Measures of capital structure/financial leverage
The term “capital structure” refers to the mix of different types of securities (long-term debt, common stock, preferred stock) issued by a company to finance its assets. The term
“unlevered company” refers to the company having no debt, while a firm with debt in its capital structure is “leveraged company”. “Financial leverage” increases firm’s financial risk and is chosen as dependant variable in this study. Because many articles have been written about capital structure and its determinants since the MM Theory, there exist different measures of capital structure. Table 1 lists the different measures of leverage and each measures pros and cons suggested in the literature.
In measuring leverage, one can include or exclude accounts payable, accounts receivable, cash, and other short-term debt. Some studies measure leverage as a ratio of book value of debt
6) However, some commentators on company financing argue that a fuller understanding of capital structure and its determinants requires a detailed analysis of all form of corporate debt. In this study coefficients of correlation instead of panel data regression were used. The latter method would reveal interesting relationships already within the group of indicated determinants in this paper. From this, important discussions on the relationship between financial systems, corporate debt structure and growth might be based upon.
to book value of equity, others as book value of debt to market value of equity, still others as debt to market value of equity plus book value of debt
9). In addition to measurement problems, there are the usual problems with interpreting statistical results’
10). For this study I
Table 1 Different measures of leverage and corresponding pros and cons, according to Rajanand Zingales (1995)7)
+ The broadest definition of leverage; proxy for what is left for shareholders in case of liquidation.
Total liabilities /
Total assets – Not a good indication of whether the firm is at risk of default in the near future.
– May overstate leverage since total liabilities include items like accounts pay- able, untaxed reserves, etc.
+ Does not include liabilities like untaxed reserves or account payable (for transac- tion purposes); more appropriate measure of leverage that above
Total debt / Total assets
– Affected by level of trade (i.e. unpaid bills; makes up bulk of accounts payable) + Not influenced by trade credit.8) (Net assets = total assets – account payable –
other liabilities).
Total debt / Net
assets – Still affected by factors that have nothing to do with financing, e.g. assets held against pension liabilities.
+ Probably the best representation of past financing decisions (capital = total debt + equity)
Total debt / Capital
+ Measure of the risk that equity holders will not be able to make fixed payments and will have to give up control. Appropriate measure if investments equal in magnitude to depreciation needed to keep the firm a going concern.
Earnings Before Interest and Taxes /
Interest expense – Based in assumption that short-term liabilities like accounts payable and short- term debt will be rolled over. Very sensitive to income fluctuations.
+ Measure of the risk that equity holders will not be able to make fixed payment and will have to give up control. Appropriate if no such investments as above are needed
Earnings Before Interest and Taxes + Depreciation /
Interest expense – same as above
Source: Rajan, R.G., and L. Zingales, ‘What do we know about capital structure? Some evidence from international data’, Journal of Finance, 50, 1995.
7) In addition to the leverage measures depicted in table 1, there exist other leverage measures; for instance, the ratio of total debt to equity, the ratio of only long-term debt to assets, and so on.
8) The term trade credit may be confusing, since it is an item that belongs to short-term debt, and in particular to accounts payable. It trade credit is used for financing purposes rather than for transactions, trade credit should be included in measures of leverage.
9) Rajan, R. G., and L. Zingales, ‘What do we know about capital structure? Some evidence from international data’, Journal of Finance, 50, 1995.
10) Harris, M., Raviv, A., ‘Theory of capital structure and technical change’, Journal of Finance, 46, 1991.
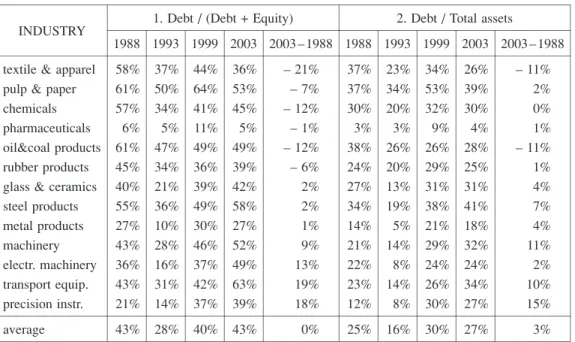
have chosen the ratio of total debt over total assets and total debt over capital (total debt + equity) as two leverage measures. Table 2 presents these ratios for Japanese manufacturing industry in years 1988–2003.
3. Determinants of capital structure
In the related literature there is some degree of disagreements over the issue of how a given determinant may affect company’s leverage
11). Here I choose eight, the most commonly used determinants of capital structure: such as profitability, size, uniqueness, expected growth,
Table 2 Leverage for Japanese Manufacturing Industry 1988 – 2003 2. Debt / Total assets 1. Debt / (Debt + Equity)
INDUSTRY
2003 – 1988 2003
1999 1993 1988 2003 – 1988 2003
1999 1993 1988
– 11%
26%
34%
23%
37%
– 21%
36%
44%
37%
58%
textile & apparel
2%
39%
53%
34%
37%
– 7%
53%
64%
50%
61%
pulp & paper
0%
30%
32%
20%
30%
– 12%
45%
41%
34%
57%
chemicals
1%
4%
9%
3%
3%
– 1%
5%
11%
5%
6%
pharmaceuticals
– 11%
28%
26%
26%
38%
– 12%
49%
49%
47%
61%
oil&coal products
1%
25%
29%
20%
24%
– 6%
39%
36%
34%
45%
rubber products
4%
31%
31%
13%
27%
2%
42%
39%
21%
40%
glass & ceramics
7%
41%
38%
19%
34%
2%
58%
49%
36%
55%
steel products
4%
18%
21%
5%
14%
1%
27%
30%
10%
27%
metal products
11%
32%
29%
14%
21%
9%
52%
46%
28%
43%
machinery
2%
24%
24%
8%
22%
13%
49%
37%
16%
36%
electr. machinery
10%
34%
26%
14%
23%
19%
63%
42%
31%
43%
transport equip.
15%
27%
30%
8%
12%
18%
39%
37%
14%
21%
precision instr.
3%
27%
30%
16%
25%
0%
43%
40%
28%
43%
average
Source: Calculations based on data from Japan Company Handbook (first section): summer 1989, autumn 1994, winter 1999 and summer 2003 Toyo Keizai Inc.
11) For example: Nishioka, S. and Baba, N., ‘Dynamic Capital Structure of Japanese Firms’, Bank of Japan, 2004, Berger, A. and Udell, G., ‘Lines of credit, collateral, and relationship lending in small firm finance’, Board of Governors of the Federal Reserve System, 1994, Rajan, R. and Zingales, L., ‘What do we know about capital structure? Some evidence from international data,’ Journal of Finance, 1995, Glen, J., ‘Capital Structure, Rates of Return and Financing Corporate Growth: Comparing Developed and Emerging Markets, 1994–00,’ University of Cambridge, 2003, Titman, S. Wessels, R., ‘The Determinants of Capital Structure‘, Journal of Finance, 43, 1988, Harris, M., Raviv, A., ‘Theory of capital structure and technical change’, Journal of Finance, 46, 1991, Prasad, S., Green, C. J. and Murinde, V., ‘Company Financing, Capital Structure, and Ownership: A Survey, and Implications for Developing Economies’, Loughborough University, 2001.
tangibility, non-debt tax shield, dividend, and market to book value. The coefficients of correlation were measured to investigate relationship between capital structure determinants and models of debt equity capital structure. Two different leverage measures have been applied: 1) total debt to total assets and, 2) total debt to capital (where capital is the sum of debt and equity).
3.1 Profitability
The pecking order theory (asymmetric-information hypothesis, signaling theory), based on works by Myers and Majluf suggests that firms display a certain pecking order in the choice of financing sources. Roughly, this theory states that firms prefer internal funds over external funds. If external finance is required, the first choice is to issue debt, then possibly issue hybrid securities such as convertible bonds, then issue eventually equity as a last resort. This behavior may be due to the costs of issuing new equity, as a result of asymmetric information or transaction costs
12). My intention is to investigate whether the predictions of the static optimal capital structure theory (bankruptcy cost hypothesis) hold. The static theory would predict a significant positive correlation between profitability and debt ratios, since high performance firms have less expected bankruptcy costs. Free-cash-flow hypothesis also predicts a positive coefficient. By contrast, the pecking-order hypothesis would be consistent with a significant negative correlation, i.e. high profit firms should have a lower leverage
13). Here, I use the return on assets as a measure of profitability. Also earnings per share could be used as a proxy for profitability. Statistical results of the relationship between EPS and leverage are also presented here, however, it has low explanatory power in case of the companies whose share amount is limited, which is often case in Japan. I suspect there will
12) Majluf, N. and Myers, S., ‘Corporate Financing and Investment Decisions When Firms Have Information Investors Do Not Have’, Journal of Financial Economics, 13, 1984. for empirical study see, for example: Baskin, J. B., ‘On the Financial Policy of Large Mature Corporations’, Ph. D Dissertation, Harvard University, Department of Economics, 1985, Baskin, J. B., ‘An Empirical Investigation of the Pecking Order Hypothesis’, Financial Management, 18, 1989.
13) for conflicting theories see: Brealey, R. and Myers. S. C., ‘Principles of Corporate Finance.
Fourth Edition. New York: McGraw-Hill, 1991, Rajan, R. and Zingales, L., ‘What Do We know about Capital Structure? Some Evidence from International Data’, Journal of Finance, 50, 1995, Majluf, N. and Myers, S., ‘Corporate Financing and Investment Decisions When Firms Have Information Investors Do Not Have’, Journal of Financial Economics, 13, 1984 and Jensen, M. C.
and W. Meckling, ‘Theory of the Firm Managerial Behavior, Agency Costs and Capital Structure’, Journal of Financial Economics, 3 October 1976 (Jensen predicts a positive relationship if the market for corporate control is effective).
be a significant negative relationship between profitability and debt ratios. (This would support the pecking-order hypothesis and run counter to the static optimal capital structure theory and free-cash-flow hypotheses).
3.2 Size
In corporate finance literature there is a certain disagreement on how company size may affect financial leverage
14). If companies with excess debt ratios have higher costs of bankruptcy and financial distress, then size may be an inverse proxy for the probability of bankruptcy, since larger firms are more likely to be more diversified and fail less often.
Accordingly, larger firms may issue debt at lower costs than smaller firms. In this case, therefore, it could be expected that company size be positively related to financial leverage.
However, there are other conflicting views arguing that there may be less asymmetric information about large firms, since these firms tend to provide more information to outside investors than smaller firms. Lower asymmetry costs should, therefore, increase their preference for equity relative to debt
15). Also, large firms often have a more dispersed ownership structure compared to smaller firms. Therefore, higher the ownership dispersion level the more negative influence on debt. This is because to have more control of a firm, the investor must have relatively big package of shares. There are many representative variables representing the size, for instance, sales, number of people employed or size of total assets.
Here, I use sales over total assets and level of employment over total assets as a measure for size. I suspect, there will be a significant negative relationship between size and debt ratios.
(This would support the governance structure and agency cost hypothesis and pecking-order hypothesis and run counter to the static optimal capital structure).
3.3 Uniqueness
There are some conflicting views on the relationship between leverage and uniqueness factor. According to the pecking order theory the positive relationship between uniqueness
14) Berger, A. and Udell, G., ‘Lines of credit, collateral, and relationship lending in small firm finance’, Board of Governors of the Federal Reserve System, 1994, Rajan, R. and Zingales, L.,‘What do we know about capital structure? Some evidence from international data’, Journal of Finance, 1995, and Glen, J., ‘Capital Structure, Rates of Return and Financing Corporate Growth:
Comparing Developed and Emerging Markets, 1994 – 00’, University of Cambridge, 2003.
15) For the theories see: Rajan, R. and Zingales, L., ‘What Do We know about Capital Structure?
Some Evidence from International Data’, Journal of Finance, 50, 1995 and Fama and Jensen,
‘Separation of Ownership and Control’, Journal of Law Economics, 1983.
and financial leverage could be expected because investments in research and development implies a higher demand for funds and a greater preference on external financing through the preferred source of debt
16). On the other hand, the more unique a firm’s asset (financed from R&D expenditures) the ‘thinner‘ the market for such assets
17). Accordingly the lower is the expected value recoverable by a lender in the event of a bankruptcy. Here a negative dependence could be expected between uniqueness and leverage. Uniqueness will be measured as a ratio of research and development expenditures over sales.
3.4 Expected growth
Relationship between expected growth and leverage seems to be similar to this between uniqueness and leverage. Here, We can also expect a positive relationship (between expected growth and leverage) due to higher demand for funds. However, it is plausible that the relationship might be negative due to higher cost of financial distress (under investment hypothesis)
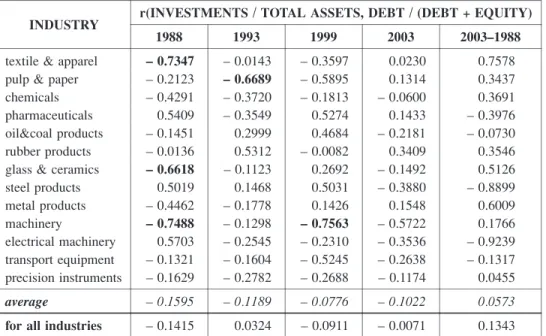
18). The proxy for expected growth is the ratio of investments over total assets.
For this determinant also a negative dependence is expected. This would support the static optimal capital structure theory (costs of financial distress, under investment hypothesis and conflicts to the pecking-order hypothesis).
3.5 Tangibility
19)According to agency cost theory models the relationship between assets’ tangibility and capital structure is based on the presumed conflict that exists between lenders and shareholders.
This theory asserts that conflicts between lenders and shareholders create incentives for shareholders to invest in suboptimal way. Therefore, lenders take actions to protect them- selves by requiring tangible assets as collateral.
Many valuable fixed assets should give a higher debt ratio, because the firm can offer security for loans. Firms, which can offer collateral will be charged lower interest rates than
16) Majluf, N. and Myers, S., ‘Corporate Financing and Investment Decisions When Firms Have Information Investors Do Not Have’, Journal of Financial Economics, 13, 1984.
17) Titman, S. and Wessels, R., ‘The Determinants of Capital Structure Choice’, Journal of Finance, 43, 1988, Titman, S., ‘The Effect of Capital Structure on a Firm’s Liquidation Decision’, Journal of Financial Economics, 3, 1984, and Rao, N. and Lukose, J., ‘An Empirical Study on the Determinants of the Capital Structure of Listed Indian Firms’, 2002
18) Myers, S. C., ‘Determinants of Corporate Borrowing’, Journal of Financial Economics, 5, 1977.
19) Data for this variable are derived from: Nishioka, S. and Baba, N., ‘Dynamic Capital Structure of Japanese Firms’, Bank of Japan, 2004.
firms that do not have any security to offer (in addition to the future cash flow).
Also, according to the static optimal capital structure theory, the bankruptcy costs should limit borrowings of risky firms whose value depends on intangible assets. For the company with intangible assets the losses are much greater. The losses to assets that are linked to the condition of the firm as a going concern, e.g. technology, growth opportunities, and human capital, become higher. Therefore, it is important for the company to optimize debt because of the potential value that may be lost
20). The significant positive relationship between tangibility and debt ratios is expected (this would support the agency cost theory and optimal static capital structure theory — bankruptcy cost).
3.6 Non-debt tax shield
According to Modigliani and Miller, interest tax shields create strong incentives for firms to increase leverage. The size of non-debt related corporate tax shields like tax deductions for depreciation and investment tax credits may affect leverage. It is argued that such non-debt tax shields are substitutes for the tax benefits of debt financing. Therefore, the tax advantage of leverage decreases when other tax deductions like depreciation increase. It is expected that an increase in non-debt tax shields will affect leverage negatively. As measure of non-debt tax shield I use the ratio of depreciation over total assets and expect a significant negative relationship between non-debt tax shield and debt ratios (this would support the optimal static capital structure theory – (corporate tax shield)).
3.7 Dividend
It is argued that a firm paying out dividends can be kept in the capital market
21). Firms, which simultaneously pay out dividends and raise debt must do this because they need to signal their quality to the equity capital market. The basic idea behind Miller and Rock theory is
20) For the theory see: Myers, S. C., ‘Determinants of Corporate Borrowing’, Journal of Financial Economics, 5, 1977, Harris, M., Raviv, A., ‘Theory of capital structure and technical change’, Journal of Finance, 46, 1991, ensen, M. C. and W. Meckling, ‘Theory of the Firm Managerial Behavior, Agency Costs and Capital Structure’, Journal of Financial Economics, 3 October 1976 and Michaelas, N., Chittenden, F. and Poutziouris, P., ‘Financial Policy and Capital Structure Choice in U. K.: Empirical Evidence from Company Panel Data, Small Business Economics, 1999.21) It is an argument for the existence of dividend. The monitoring of management is less costly in the capital market. If a firm does not report to truthfully to the capital market, the social cost of monitoring will be exceedingly large. See: Easterbrook, F. H., ‘Two Agency-cost Explanations of Dividends’, American Economic Review, 74, 1992.
that dividends give a credible signal of firm quality because they cost inefficient firms more than efficient firms in terms of reduced investments, thus reducing the future value of the firm
22). The negative correlation between dividend and leverage can be taken as evidence that dividend-paying firms have less debt because they need less debt than the other firms. The positive correlation would mean that firms prefer to pay out dividends while having much debt because they need to be in the capital market to obtain cost-efficient monitoring of their management
23).
I expect a significant negative relationship between dividend and debt ratios (this would support 1) prediction that dividend-paying firms have less debt because they need less debt than the other firms, 2) pecking order theory and counter 3) the prediction that firms prefer to pay out dividends while having much debt because they need to be in the capital market to obtain cost-efficient monitoring of their management, 4) agency theory and 5) static optimal capital structure theory recommendations).
3.8 Market to book ratio
Market to book ratio is the ratio of market value to book value of equity and is a proxy for investment opportunities
24). Firms with high-market to book ratios tend to grow quickly.
They pass up promising projects and tend to lower leverage. The market timing hypothesis also indicates a negative sign between market-to-book ratio and leverage because firms with high market-to-book ratios have an incentive to take advantage of high/low equity prices to issue/repurchase equities. On the other hand, a positive sign could be expected since a higher market-to-book ratio shows a higher expected growth rate of firm value. According to the static optimal capital structure firms have their target debt-to-equity ratios and in order to adjust the leverage to rise in stock price company should raise more debt or sell stocks
25).
22) Miller, M. and Rock, K., ‘Dividend policy under asymmetric information’, Journal of Finance, 40, 1985.
23) See: Dahalival, D., Li O., Moser, W., ‘Dividend Taxes and Implied Cost of Equity Capital’, University of Arizona, 2004. In the literature dividend is also often used as a proxy for equity cost.
24) Data are derived from: Nishioka, S. and Baba, N., ‘Dynamic Capital Structure of Japanese Firms’, Bank of Japan, 2004.
25) See: Stulz, R., ‘Managerial Discretion and Optimal Financing Policies’, Journal of Financial Economics, 26, 1990, Myers, S. C., ‘Determinants of Corporate Borrowing’, Journal of Financial Economics, 5, 1977, Merton, R., ‘On the Pricing of Corporate Debt: ‘The Risk Structure of Interest Rates’, Journal of Finance 29, 1974. Data are derived from: Nishioka, S. and Baba, N.,
‘Dynamic Capital Structure of Japanese Firms’, Bank of Japan, 2004.
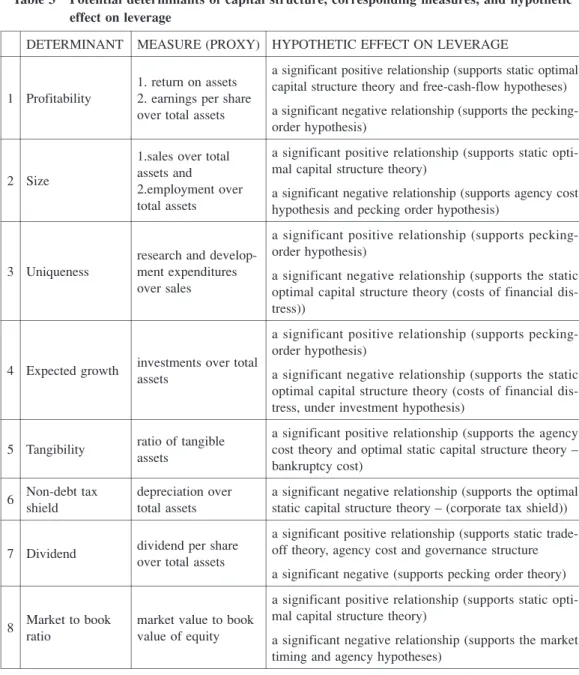
Table 3 Potential determinants of capital structure, corresponding measures, and hypothetic effect on leverage
HYPOTHETIC EFFECT ON LEVERAGE MEASURE (PROXY)
DETERMINANT
a significant positive relationship (supports static optimal capital structure theory and free-cash-flow hypotheses) a significant negative relationship (supports the pecking- order hypothesis)
1. return on assets 2. earnings per share over total assets Profitability
1
a significant positive relationship (supports static opti- mal capital structure theory)
a significant negative relationship (supports agency cost hypothesis and pecking order hypothesis)
1.sales over total assets and
2.employment over total assets Size
2
a significant positive relationship (supports pecking- order hypothesis)
a significant negative relationship (supports the static optimal capital structure theory (costs of financial dis- tress))
research and develop- ment expenditures over sales Uniqueness
3
a significant positive relationship (supports pecking- order hypothesis)
a significant negative relationship (supports the static optimal capital structure theory (costs of financial dis- tress, under investment hypothesis)
investments over total assets
Expected growth 4
a significant positive relationship (supports the agency cost theory and optimal static capital structure theory – bankruptcy cost)
ratio of tangible assets
Tangibility 5
a significant negative relationship (supports the optimal static capital structure theory – (corporate tax shield)) depreciation over
total assets Non-debt tax
shield 6
a significant positive relationship (supports static trade- off theory, agency cost and governance structure a significant negative (supports pecking order theory) dividend per share
over total assets Dividend
7
a significant positive relationship (supports static opti- mal capital structure theory)
a significant negative relationship (supports the market timing and agency hypotheses)
market value to book value of equity Market to book
ratio 8
Source: Based on reviewed literature
Table 3 presents the set of potential determinants of capital structure, corresponding
measures and hypothetic effect on leverage.
4. Analysis of Hypothesized Effects on Debt-ratio
Correlation analysis has been used to identify and measure the factors affecting capital structure and their relationship with debt equity capital structure models. The conflicting recommendations of the capital structure models (Tradeoff Theory, the Pecking Order Hypothesis, the Agency Theory, the Market Timing Hypothesis and other established capital structure models) were confronted with Japanese companies’ financing decisions. There were eight determinants of capital structure: 1) profitability, 2) size, 3) uniqueness, 4) growth opportunity, 5) tangibility, 6) non-debt tax shield, 7) dividend, and 8) market to book value
26). The results suggest that the capital structure of the Japanese manufacturing industry is significantly affected by: profitability, dividend, tangibility, market-to-book ratio and size.
The only variables suggested by theoretical and empirical literature that seem not to affect capital structure of Japanese manufacturing industries are: uniqueness, growth opportunities and non-debt tax shield variable.
In general, as for the results of this study, some recommendations, especially of the pecking order, agency cost and governance structure (less in case of static optimal capital structure hypothesis) seem to be supported. Among control variables, profitability and dividend have high explanatory power as a proxy for pecking-order theory.
4.1 Profitability
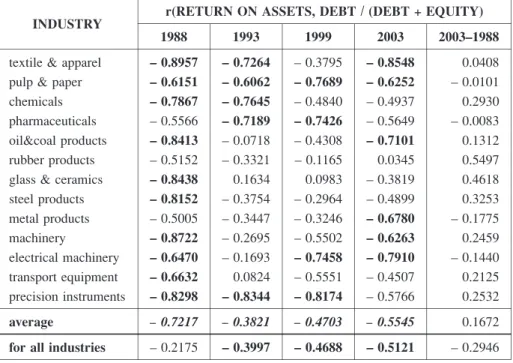
The results of this study reveal that profitability is a significant determinant of leverage (see table 4 and 5). All correlations whose t value is higher than 2.31 have noted negative values (see table 4). The strongest correlations in 1988 were displayed by textile and apparel (– 0.8957), machinery (– 0.8722), glass and ceramics (– 0.8438), and oil and coal products (– 0.8413), in 1993 by precision instruments (– 0.8344), chemicals (– 0.7645) and textile and apparel (– 0.7264), in 1999 by precision instruments (– 0.8174) and pulp and paper (– 0.7689), and in 2003 by textile and apparel (– 0.8548) and electrical machinery (– 0.7910). The biggest changes in time were observed in case of rubber products (0.5497) and metal industry (– 0.1775). The average for 1988 is the strongest (– 0.7217). There are four examples of industries that kept strong negative values of coefficients during all or almost all period. They
26) Because of the lack of date concerning debt cost, tangibility and market-to-book ratio, I have used the data from other studies to analyze these variables.
are: textile and apparel, pulp and paper, electric machinery and precision instruments.
In terms of averages, there are similar results in measuring relationship between profitability and financial leverage using debt to total assets as a leverage variable (see table 5). However, there are significant differences for individual industries — fewer industries displaying strong negative correlations in more than two periods (only textile and apparel and precision instruments, comparing with four industries when leverage was measured as the ratio of debt to capital).
Table 4 Coefficients of Correlation: Profitability / Financial Leverage in 13 Japanese Manufacturing Industries 1988 – 2003
r(RETURN ON ASSETS, DEBT / (DEBT + EQUITY) INDUSTRY
2003–1988 2003
1999 1993
1988
0.0408 – 0.8548
– 0.3795 – 0.7264
– 0.8957 textile & apparel
– 0.0101 – 0.6252
– 0.7689 – 0.6062
– 0.6151 pulp & paper
0.2930 – 0.4937
– 0.4840 – 0.7645
– 0.7867 chemicals
– 0.0083 – 0.5649
– 0.7426 – 0.7189
– 0.5566 pharmaceuticals
0.1312 – 0.7101
– 0.4308 – 0.0718
– 0.8413 oil&coal products
0.5497 0.0345
– 0.1165 – 0.3321
– 0.5152 rubber products
0.4618 – 0.3819
0.0983 0.1634
– 0.8438 glass & ceramics
0.3253 – 0.4899
– 0.2964 – 0.3754
– 0.8152 steel products
– 0.1775 – 0.6780
– 0.3246 – 0.3447
– 0.5005 metal products
0.2459 – 0.6263
– 0.5502 – 0.2695
– 0.8722 machinery
– 0.1440 – 0.7910
– 0.7458 – 0.1693
– 0.6470 electrical machinery
0.2125 – 0.4507
– 0.5551 0.0824
– 0.6632 transport equipment
0.2532 – 0.5766
– 0.8174 – 0.8344
– 0.8298 precision instruments
0.1672 – 0.5545
– 0.4703 – 0.3821
– 0.7217 average
– 0.2946 – 0.5121
– 0.4688 – 0.3997
– 0.2175 for all industries
Note: bold font indicates the t-value for probability p = 0.0527)
Source: Calculations based on data from Japan Company Handbook (first section): sum- mer 1989, autumn 1994, winter 1999 and summer 2003 Toyo Keizai Inc.
27) The tables with coefficients of correlation include the results of the T-test for each examined coefficient of correlation. In most cases in this study there are 8 degrees of freedom (and over 120 in case of coefficients for all industries). I assume a probability of p = 0.05 (95%
probability of making a correct statement – i.e. debt and one of examined variable are highly correlated) the critical value of the Student‘s test for eight degrees of freedom is t = 2.31. The coefficients than reached the value of T-test greater than 2.31 are indicated in the tables by the bold font. However, because of the limited space the lines of regression for these coefficients are not included in this paper and bolded values are just to indicate the significant relationships between debt and examined variable.
Table 5 Coefficients of Correlation: Profitability / Financial Leverage in 13 Japanese Manufacturing Industries 1988–2003
r(RETURN ON ASSETS, DEBT/TOTAL ASSETS) 2003–1988 2003
1999 1993
1988
– 0.0689 – 0.8631
– 0.4296 – 0.7739
– 0.7942 textile & apparel
– 0.1247 – 0.5947
– 0.6783 – 0.7363
– 0.4701 pulp & paper
0.0907 – 0.4300
– 0.4873 – 0.7839
– 0.5207 chemicals
0.0049 – 0.5766
– 0.7566 – 0.7323
– 0.5815 pharmaceuticals
0.0514 – 0.7192
– 0.3188 – 0.2133
– 0.7706 oil&coal products
0.5639 0.0456
– 0.1287 – 0.3333
– 0.5183 rubber products
0.3361 – 0.4435
0.1084 0.1565
– 0.7796 glass & ceramics
0.3913 – 0.4102
– 0.3158 – 0.4284
– 0.8014 steel products
– 0.2469 – 0.6957
– 0.2561 – 0.4289
– 0.4488 metal products
0.3386 – 0.4983
– 0.3203 – 0.1634
– 0.8369 machinery
– 0.2999 – 0.8425
– 0.6400 – 0.1611
– 0.5426 electrical machinery
0.3138 – 0.3002
– 0.5931 – 0.0638
– 0.6140 transport equipment
0.3314 – 0.5187
– 0.8520 – 0.8434
– 0.8501 precision instruments
0.1294 – 0.5267
– 0.4360 – 0.4235
– 0.6561 average
– 0.3079 – 0.4882
– 0.4600 – 0.4834
– 0.1803 for all industries
Source: Calculations based on data from Japan Company Handbook (first section): sum- mer 1989, autumn 1994, winter 1999 and summer 2003 Toyo Keizai Inc.
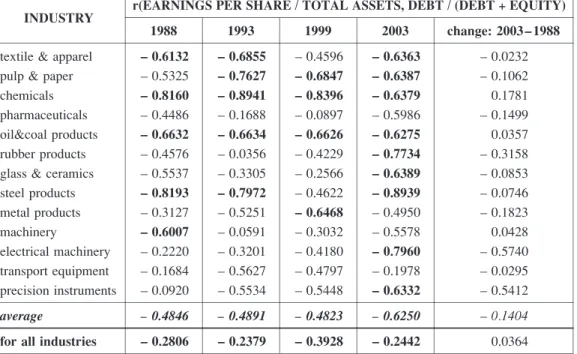
In case of earnings per share all strong correlations were negative (see table 6). In 1988 the strongest negative correlations were displayed by steel products (– 0.8193) and chemicals (– 0.816), in 1993 by chemicals (– 0.8941), and steel products (– 0.7972), in 1999 again by chemicals (– 0.8396), and in 2003 by steel products (– 0.8939), electrical machinery (– 0.796) and rubber products (– 0.7734). The biggest negative changes in correlations were observed in electrical machinery and precision instruments (respectively, from – 0.222 and – 0.092 in 1988 to – 0.796 and – 0.6332 in 2003). Although there are many negative correlations in all periods, sample from 2003 displayed strong negative coefficients in almost all cases (average correlation in 2003 was – 0.625 comparing – 0.48 from other periods). There are five industries that displayed strong negative values of coefficients during almost all period: textile and apparel, pulp and paper, chemicals, oil and coal products, and steel products.
With regard to debt to total assets, average correlations are similar to these obtained by
using debt to capital (see table 7). Here, the difference in values of coefficients (between
average for 2003 and averages for remaining periods) is bigger (– 0.634 in 2003 and – 0.45 in
years 1988 –1999). Pulp and paper, chemicals, steel products and transport equipment
displayed negative correlations of 1988 – 2003.
The relationship between profitability and leverage is negative and significant for many industries. This means that profitability may be used as a proxy for the availability of internal funds (as suggested by pecking-order theory). These findings are also supported by other studies of corporate capital structure
28). The negative correlations here may also suggest an argument that the pecking order hypothesis is closer to empirical studies than the static optimal capital structure theory and free-cash-flow hypothesis. According to pecking order hypothesis firms prefer retained earnings over external finance. Hence, good profitability reduces the need for external capital in form of a debt contract. The signs of coefficients of correlation do not seem to support the static optimal capital structure theory. Obtained results are consistent with a significant negative, as opposed to positive, relationship between profitability and
28) For example: Hirota, S., ‘Are Corporate Financing Decisions Different in Japan? An Empirical Study on Capital Structure’, IFMP Discussion Paper, 1998, Nishioka, S. and Baba, N., ‘Dynamic Capital Structure of Japanese Firms’, Bank of Japan, 2004, Han Suck Song, ‘Capital Structure Determinants, an Empirical Study of Swedish Companies’, the Royal Institute of Technology, 2005Table 6 Coefficients of Correlation: Earnings per share/Financial Leverage in 13 Japanese Manufacturing Industries 1988 – 2003
r(EARNINGS PER SHARE / TOTAL ASSETS, DEBT / (DEBT + EQUITY) INDUSTRY
change: 2003 – 1988 2003
1999 1993
1988
– 0.0232 – 0.6363
– 0.4596 – 0.6855
– 0.6132 textile & apparel
– 0.1062 – 0.6387
– 0.6847 – 0.7627
– 0.5325 pulp & paper
0.1781 – 0.6379
– 0.8396 – 0.8941
– 0.8160 chemicals
– 0.1499 – 0.5986
– 0.0897 – 0.1688
– 0.4486 pharmaceuticals
0.0357 – 0.6275
– 0.6626 – 0.6634
– 0.6632 oil&coal products
– 0.3158 – 0.7734
– 0.4229 – 0.0356
– 0.4576 rubber products
– 0.0853 – 0.6389
– 0.2566 – 0.3305
– 0.5537 glass & ceramics
– 0.0746 – 0.8939
– 0.4622 – 0.7972
– 0.8193 steel products
– 0.1823 – 0.4950
– 0.6468 – 0.5251
– 0.3127 metal products
0.0428 – 0.5578
– 0.3032 – 0.0591
– 0.6007 machinery
– 0.5740 – 0.7960
– 0.4180 – 0.3201
– 0.2220 electrical machinery
– 0.0295 – 0.1978
– 0.4797 – 0.5627
– 0.1684 transport equipment
– 0.5412 – 0.6332
– 0.5448 – 0.5534
– 0.0920 precision instruments
– 0.1404 – 0.6250
– 0.4823 – 0.4891
– 0.4846 average
0.0364 – 0.2442
– 0.3928 – 0.2379
– 0.2806 for all industries
Source: Calculations based on data from Japan Company Handbook (first section): summer 1989, autumn 1994, winter 1999 and summer 2003 Toyo Keizai Inc.
leverage.
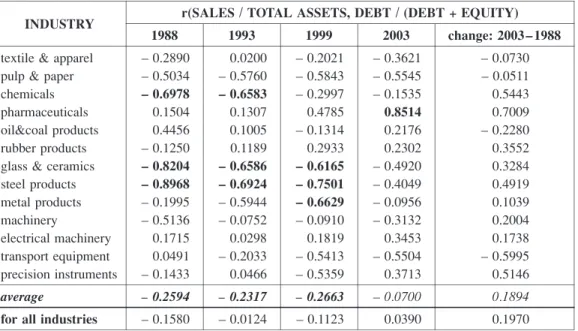
4.2 Size
The sales and employment correlations (used as the proxies for size — see tables: 8, 9, 10 and 11 respectively) are negative, and in many cases statistically significant (especially employment, tables 10 and 11). Almost all correlations whose t value is higher than 2.31 have noted negative values (see table 8). The only industry that displayed strong positive correlation was pharmaceuticals (0.8514 in 2003). The strongest negative correlations in 1988 were displayed by steel products (– 0.8968) and glass and ceramics (– 0.8204), in 1993 by steel products (– 0.6924), in 1999 again by steel products (– 0.7501). In 2003 there was no single case of strong negative correlation. The average correlation was decreasing with time (from – 0.2594 in 1988 to – 0.07 in 2003).
In terms of averages, similar results we obtain when measuring relationship between size and financial leverage (disregarding the choice of leverage measure). There are some differences in the results for individual industries. Only glass and ceramics and steel products
Table 7 Coefficients of Correlation: Earnings per share / Financial Leverage in 13 JapaneseManufacturing Industries 1988 – 2003
r(EARNINGS PER SHARE / TOTAL ASSETS, DEBT / TOTAL ASSETS INDUSTRY
change: 2003 – 1988 2003
1999 1993
1988
– 0.1231 – 0.6339
– 0.4651 – 0.6782
– 0.5108 textile & apparel
– 0.1020 – 0.6240
– 0.6229 – 0.7724
– 0.5220 pulp & paper
– 0.0817 – 0.6216
– 0.8333 – 0.8115
– 0.5399 chemicals
– 0.1373 – 0.5952
– 0.0919 – 0.1643
– 0.4579 pharmaceuticals
0.0444 – 0.5508
– 0.4726 – 0.5273
– 0.5952 oil&coal products
– 0.3265 – 0.7501
– 0.4688 – 0.0614
– 0.4236 rubber products
– 0.1716 – 0.6167
– 0.3014 – 0.2942
– 0.4451 glass & ceramics
– 0.0892 – 0.8873
– 0.4191 – 0.8053
– 0.7980 steel products
– 0.1794 – 0.4877
– 0.6431 – 0.5601
– 0.3083 metal products
0.1517 – 0.4616
– 0.0006 0.0749
– 0.6133 machinery
– 0.5015 – 0.7490
– 0.2891 – 0.1894
– 0.2475 electrical machinery
– 0.4183 – 0.7007
– 0.6368 – 0.6449
– 0.2824 transport equipment
– 0.4861 – 0.5636
– 0.5228 – 0.5286
– 0.0776 precision instruments
– 0.1862 – 0.6340
– 0.4437 – 0.4587
– 0.4478 average
– 0.2677 – 0.2352
– 0.3699 – 0.2117
– 0.2540 for all industries
Source: Calculations based on data from Japan Company Handbook (first section): summer 1989, autumn 1994, winter 1999 and summer 2003 Toyo Keizai Inc.
Table 8 Coefficients of Correlation: Size / Financial Leverage in 13 Japanese Manufacturing Industries 1988 – 2003
r(SALES / TOTAL ASSETS, DEBT / (DEBT + EQUITY) INDUSTRY
change: 2003 – 1988 2003
1999 1993
1988
– 0.0730 – 0.3621
– 0.2021 0.0200
– 0.2890 textile & apparel
– 0.0511 – 0.5545
– 0.5843 – 0.5760
– 0.5034 pulp & paper
0.5443 – 0.1535
– 0.2997 – 0.6583
– 0.6978 chemicals
0.7009 0.8514
0.4785 0.1307
0.1504 pharmaceuticals
– 0.2280 0.2176
– 0.1314 0.1005
0.4456 oil&coal products
0.3552 0.2302
0.2933 0.1189
– 0.1250 rubber products
0.3284 – 0.4920
– 0.6165 – 0.6586
– 0.8204 glass & ceramics
0.4919 – 0.4049
– 0.7501 – 0.6924
– 0.8968 steel products
0.1039 – 0.0956
– 0.6629 – 0.5944
– 0.1995 metal products
0.2004 – 0.3132
– 0.0910 – 0.0752
– 0.5136 machinery
0.1738 0.3453
0.1819 0.0298
0.1715 electrical machinery
– 0.5995 – 0.5504
– 0.5413 – 0.2033
0.0491 transport equipment
0.5146 0.3713
– 0.5359 0.0466
– 0.1433 precision instruments
0.1894 – 0.0700
– 0.2663 – 0.2317
– 0.2594 average
0.1970 0.0390
– 0.1123 – 0.0124
– 0.1580 for all industries
Source: Calculations based on data from Japan Company Handbook (first section): summer 1989, autumn 1994, winter 1999 and summer 2003 Toyo Keizai Inc.
Table 9 Coefficients of Correlation: Size / Financial Leverage in 13 Japanese Manufacturing Industries 1988 – 2003
r(SALES / TOTAL ASSETS, DEBT / TOTAL ASSETS INDUSTRY
change: 2003 –1988 2003
1999 1993
1988
– 0.0963 – 0.3671
– 0.1495 – 0.0199
– 0.2708 textile & apparel
– 0.0772 – 0.5867
– 0.6558 – 0.6670
– 0.5095 pulp & paper
0.1146 – 0.2139
– 0.3361 – 0.6114
– 0.3285 chemicals
0.6894 0.8538
0.4273 0.1709
0.1644 pharmaceuticals
– 0.2865 – 0.0004
– 0.0262 – 0.0499
0.2860 oil&coal products
0.2916 0.1889
0.1906 0.1475
– 0.1027 rubber products
0.1540 – 0.5858
– 0.6735 – 0.6294
– 0.7398 glass & ceramics
0.4140 – 0.4727
– 0.7854 – 0.6862
– 0.8866 steel products
0.1725 – 0.1531
– 0.7337 – 0.5606
– 0.3256 metal products
0.1872 – 0.3699
0.0487 – 0.0148
– 0.5571 machinery
– 0.0837 0.3175
0.0427 – 0.2146
0.4012 electrical machinery
– 0.6557 – 0.6759
– 0.4187 – 0.0874
– 0.0202 transport equipment
0.4109 0.2925
– 0.5965 0.0550
– 0.1185 precision instruments
0.211 – 0.1364
– 0.2820 – 0.2437
– 0.2314 average
– 0.1382 – 0.0849
– 0.2353 – 0.0789
– 0.1538 for all industries
Source: Calculations based on data from Japan Company Handbook (first section): summer 1989, autumn 1994, winter 1999 and summer 2003 Toyo Keizai Inc.
display strong negative correlations and were observed in almost all periods. The strongest negative correlations in 1988 were displayed by steel products (– 0.8866) and glass and ceramics (– 0.7398), in 1993 again by steel products (– 0.6862) and pulp and paper (– 0.667), in 1999 by steel products (– 0.7854) and metal products (– 0.7337), and in 2003 by transport equipment (– 6759). There is only one case of strong positive correlation in whole sample, which is pharmaceuticals that displayed positive change over time absolute correlations (from weak 0.1644 in 1988 to strong 0.8538 in 2003). There are two industries that displayed strong negative correlations during almost whole period (glass and ceramics and steel products). The biggest negative change in time was displayed in transport equipment (from – 0.0202 in 1988 to – 0.6759 in 2003 (see table 9, and compare also transport equipment from table 8; change form 0.0491 in 1988 to – 0.5504 in 2003).
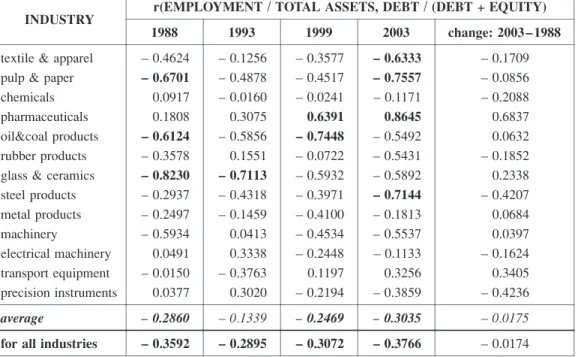
In case of employment as a proxy for size the average coefficients had lower values (see table 10 and 11). However, there were less industries that displayed strong negative correlations (in 1993 there was only one industry that displayed strong negative correlation — glass and ceramics (– 0.7113)). In 1988 the strongest negative correlations were in glass and
Table 10 Coefficients of Correlation: Size / Financial Leverage in 13 Japanese Manufacturing Industries 1988 – 2003
r(EMPLOYMENT / TOTAL ASSETS, DEBT / (DEBT + EQUITY) INDUSTRY
change: 2003 – 1988 2003
1999 1993
1988
– 0.1709 – 0.6333
– 0.3577 – 0.1256
– 0.4624 textile & apparel
– 0.0856 – 0.7557
– 0.4517 – 0.4878
– 0.6701 pulp & paper
– 0.2088 – 0.1171
– 0.0241 – 0.0160
0.0917 chemicals
0.6837 0.8645
0.6391 0.3075
0.1808 pharmaceuticals
0.0632 – 0.5492
– 0.7448 – 0.5856
– 0.6124 oil&coal products
– 0.1852 – 0.5431
– 0.0722 0.1551
– 0.3578 rubber products
0.2338 – 0.5892
– 0.5932 – 0.7113
– 0.8230 glass & ceramics
– 0.4207 – 0.7144
– 0.3971 – 0.4318
– 0.2937 steel products
0.0684 – 0.1813
– 0.4100 – 0.1459
– 0.2497 metal products
0.0397 – 0.5537
– 0.4534 0.0413
– 0.5934 machinery
– 0.1624 – 0.1133
– 0.2448 0.3338
0.0491 electrical machinery
0.3405 0.3256
0.1197 – 0.3763
– 0.0150 transport equipment
– 0.4236 – 0.3859
– 0.2194 0.3020
0.0377 precision instruments
– 0.0175 – 0.3035
– 0.2469 – 0.1339
– 0.2860 average
– 0.0174 – 0.3766
– 0.3072 – 0.2895
– 0.3592 for all industries
Source: Calculations based on data from Japan Company Handbook (first section): summer 1989, autumn 1994, winter 1999 and summer 2003 Toyo Keizai Inc.
ceramics (– 0.823), in 1993 again in glass and ceramics (– 0.7113); in 1999 in oil and coal products (– 0.7448), and in 2003 in pulp and paper (– 0.7557) and steel products (-0.7144).
There is only one case of strong positive correlation which is pharmaceuticals with strong positive correlations in two periods: 1999 and 2003 (respectively, 0.6391 and 0.8645) There are two industries that displayed strong negative values of coefficients during almost all period (glass and ceramics and oil and coal products).
In debt to total assets, glass and ceramics has shown (as the only industry) strong negative correlation in whole period of 1988 – 2003 (see table 11). In other industries, correlations display similar values (disregarding the choice of the measure of leverage). Again, pharmaceuticals showed similar change of correlation in time from weak 0.205 in 1988 to strong positive 0.891 in 2003.
The negative correlations with regard to company size means that size may represents a degree of informational asymmetry running counter static theory interpreting the size variable as an inverse measure for bankruptcy risk (default probability). The size variable represents also a risk variable since large companies are less inclined to go bankrupt. The negative sign
Table 11 Coefficients of Correlation: Size / Financial Leverage in 13 Japanese ManufacturingIndustries 1988 – 2003
r(EMPLOYMENT / TOTAL ASSETS, DEBT / TOTAL ASSETS INDUSTRY
change: 2003 – 1988 2003
1999 1993
1988
– 0.2099 – 0.6353
– 0.3228 – 0.1443
– 0.4254 textile & apparel
– 0.1514 – 0.7497
– 0.5940 – 0.4970
– 0.5982 pulp & paper
– 0.6178 – 0.1474
– 0.0751 – 0.0461
0.4703 chemicals
0.6860 0.8910
0.6123 0.3508
0.2050 pharmaceuticals
– 0.0156 – 0.5531
– 0.6898 – 0.4571
– 0.5375 oil&coal products
– 0.2295 – 0.5545
– 0.1395 0.2415
– 0.3251 rubber products
0.1326 – 0.6133
– 0.6344 – 0.6751
– 0.7459 glass & ceramics
– 0.3976 – 0.7071
– 0.4003 – 0.4567
– 0.3095 steel products
0.1372 – 0.2435
– 0.4704 – 0.1151
– 0.3806 metal products
– 0.0067 – 0.6289
– 0.0036 0.3118
– 0.6222 machinery
– 0.3068 – 0.0306
– 0.3482 0.3069
0.2762 electrical machinery
– 0.0572 – 0.1884
0.1795 – 0.3826
– 0.1312 transport equipment
– 0.5011 – 0.4598
– 0.2920 0.3301
0.0413 precision instruments
– 0.1183 – 0.3554
– 0.2445 – 0.0948
– 0.2371 average
– 0.3333 – 0.4074
– 0.3137 – 0.2646
– 0.3476 for all industries
Source: Calculations based on data from Japan Company Handbook (first section): summer 1989, autumn 1994, winter 1999 and summer 2003 Toyo Keizai Inc.
of size variable is interesting because large firms are a priori expected to have relatively more debt than smaller companies because bankruptcy cost is expected to be of a lesser risk in larger firms. Also because the asymmetric-information costs are expected to be smaller in such firms large firms may therefore be expected to have more debt.
Large firms often have a more dispersed ownership structure compared to smaller firms. The dispersion of ownership would have a negative influence on debt level because to have full control of a firm, an investor must have relative majority of stocks. It may be argued that ownership structure in smaller firms may demand more debt than in larger firms.
It is, however, doubtful whether negative relationship between size and leverage supports this assertion. The sample under study consists of the biggest manufacturing corporations, and does not include small and medium companies.
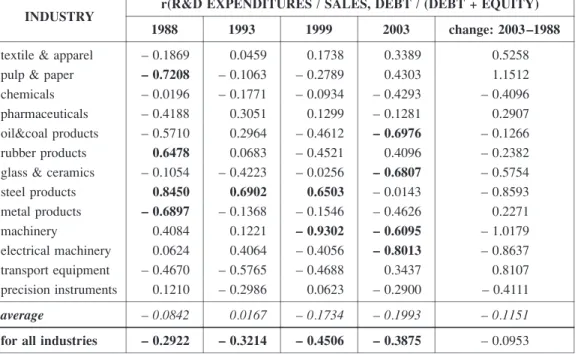
4.3 Uniqueness
The study of correlation between uniqueness and leverage show that there is no relation- ship that is of statistical significance (tables 12, 13 respectively). However, there are a few
Table 12 Coefficients of Correlation: Uniqueness / Financial Leverage in 13 Japanese Manu- facturing Industries 1988 – 2003
r(R&D EXPENDITURES / SALES, DEBT / (DEBT + EQUITY) INDUSTRY
change: 2003 –1988 2003
1999 1993
1988
0.5258 0.3389
0.1738 0.0459
– 0.1869 textile & apparel
1.1512 0.4303
– 0.2789 – 0.1063
– 0.7208 pulp & paper
– 0.4096 – 0.4293
– 0.0934 – 0.1771
– 0.0196 chemicals
0.2907 – 0.1281
0.1299 0.3051
– 0.4188 pharmaceuticals
– 0.1266 – 0.6976
– 0.4612 0.2964
– 0.5710 oil&coal products
– 0.2382 0.4096
– 0.4521 0.0683
0.6478 rubber products
– 0.5754 – 0.6807
– 0.0256 – 0.4223
– 0.1054 glass & ceramics
– 0.8593 – 0.0143
0.6503 0.6902
0.8450 steel products
0.2271 – 0.4626
– 0.1546 – 0.1368
– 0.6897 metal products
– 1.0179 – 0.6095
– 0.9302 0.1221
0.4084 machinery
– 0.8637 – 0.8013
– 0.4056 0.4064
0.0624 electrical machinery
0.8107 0.3437
– 0.4688 – 0.5765
– 0.4670 transport equipment
– 0.4111 – 0.2900
0.0623 – 0.2986
0.1210 precision instruments
– 0.1151 – 0.1993
– 0.1734 0.0167
– 0.0842 average
– 0.0953 – 0.3875
– 0.4506 – 0.3214
– 0.2922 for all industries
Source: Calculations based on data from Japan Company Handbook (first section): summer 1989, autumn 1994, winter 1999 and summer 2003 Toyo Keizai Inc.
examples of the industries that have displayed strong negative and strong positive correlations, especially when the debt to capital ratio was chosen as the measure of the leverage (see table 12).
In 1988, pulp and paper and metal products displayed strong negative correlations (respectively – 0.7208 and – 0.6897) and steel products and rubber products, strong positive ones (0.845 and 0.6478). In 1993 the only strong correlation was displayed by steel products industry (0.6902).
In 1999 it was machinery that showed the strongest correlation (– 0.9302). In 2003 all strong correlations were negative: electrical machinery (– 0.8013), oil and coal products (– 0.6976), and glass and ceramics (– 0.6807). The values of coefficients of correlations were close to zero on average, although the aggregate values for all industry were negative in all four periods.
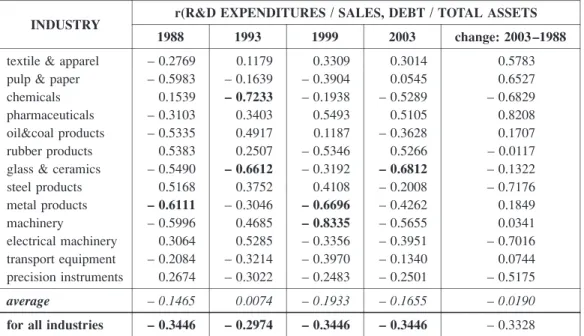
Regarding total assets, average values of correlations displayed similar values (see table 13). There are fewer cases of strong negative correlations than in case of debt to capital, however, values of correlations are lower in almost all cases (also positive correlations are lower). Metal products and glass and ceramics are the cases of industry that obtained strong/
moderate negative values of coefficients through whole period 1988–2003.
Due to high demand for funds one might expect a positive relationship between uniqueness and leverage, or, a negative relationship due to higher costs of financial distress.
Table 13 Coefficients of Correlation: Uniqueness / Financial Leverage in 13 Japanese Manu- facturing Industries 1988 – 2003
r(R&D EXPENDITURES / SALES, DEBT / TOTAL ASSETS INDUSTRY
change: 2003 –1988 2003
1999 1993
1988
0.5783 0.3014
0.3309 0.1179
– 0.2769 textile & apparel
0.6527 0.0545
– 0.3904 – 0.1639
– 0.5983 pulp & paper
– 0.6829 – 0.5289
– 0.1938 – 0.7233
0.1539 chemicals
0.8208 0.5105
0.5493 0.3403
– 0.3103 pharmaceuticals
0.1707 – 0.3628
0.1187 0.4917
– 0.5335 oil&coal products
– 0.0117 0.5266
– 0.5346 0.2507
0.5383 rubber products
– 0.1322 – 0.6812
– 0.3192 – 0.6612
– 0.5490 glass & ceramics
– 0.7176 – 0.2008
0.4108 0.3752
0.5168 steel products
0.1849 – 0.4262
– 0.6696 – 0.3046
– 0.6111 metal products
0.0341 – 0.5655
– 0.8335 0.4685
– 0.5996 machinery
– 0.7016 – 0.3951
– 0.3356 0.5285
0.3064 electrical machinery
0.0744 – 0.1340
– 0.3970 – 0.3214
– 0.2084 transport equipment
– 0.5175 – 0.2501
– 0.2483 – 0.3022
0.2674 precision instruments
– 0.0190 – 0.1655
– 0.1933 0.0074
– 0.1465 average
– 0.3328 – 0.3446
– 0.3446 – 0.2974
– 0.3446 for all industries
Source: Calculations based on data from Japan Company Handbook (first section): summer 1989, autumn 1994, winter 1999 and summer 2003 Toyo Keizai Inc.
This study shows that the relationship between uniqueness and leverage is not statistically significant. This may be explain by the possibility that the effects of the two different theories (pecking order and tradeoff theory) neutralize each other, and in case of strong positive and negative relationships each theory play reflects in financing behavior of different industry.
There are few cases of a significant positive relationship between debt levels and uniqueness.
This would be consistent with the pecking order hypothesis (if borrowing is being used to fund investment opportunities) because firm would issue debt rather than external equity.
Ratio of R&D expenditures over sales is also used as a proxy of other capital structure determinant that is expected growth, however, looking at the results, other more significant results might be obtained by using another measure for expected growth, such as market-to- book ratio, a commonly used proxy for expected growth.
4.4 Expected growth
Regarding expected growth the correlations display similar results to those between uniqueness and leverage. It seems that there is no significant relationship here (see tables 14, 15 respectively). There are however, examples of several industries that have displayed
Table 14 Coefficients of Correlation: Expected growth / Financial Leverage in 13 Japa- nese Manufacturing Industries 1988 – 2003
r(INVESTMENTS / TOTAL ASSETS, DEBT / (DEBT + EQUITY) INDUSTRY
2003–1988 2003
1999 1993
1988
0.7578 0.0230
– 0.3597 – 0.0143
– 0.7347 textile & apparel
0.3437 0.1314
– 0.5895 – 0.6689
– 0.2123 pulp & paper
0.3691 – 0.0600
– 0.1813 – 0.3720
– 0.4291 chemicals
– 0.3976 0.1433
0.5274 – 0.3549
0.5409 pharmaceuticals
– 0.0730 – 0.2181
0.4684 0.2999
– 0.1451 oil&coal products
0.3546 0.3409
– 0.0082 0.5312
– 0.0136 rubber products
0.5126 – 0.1492
0.2692 – 0.1123
– 0.6618 glass & ceramics
– 0.8899 – 0.3880
0.5031 0.1468
0.5019 steel products
0.6009 0.1548
0.1426 – 0.1778
– 0.4462 metal products
0.1766 – 0.5722
– 0.7563 – 0.1298
– 0.7488 machinery
– 0.9239 – 0.3536
– 0.2310 – 0.2545
0.5703 electrical machinery
– 0.1317 – 0.2638
– 0.5245 – 0.1604
– 0.1321 transport equipment
0.0455 – 0.1174
– 0.2688 – 0.2782
– 0.1629 precision instruments
0.0573 – 0.1022
– 0.0776 – 0.1189
– 0.1595 average
0.1343 – 0.0071
– 0.0911 0.0324
– 0.1415 for all industries
Source: Calculations based on data from Japan Company Handbook (first section): summer 1989, autumn 1994, winter 1999 and summer 2003 Toyo Keizai Inc.