Lao PDRʼs Economic Growth: the Role of Capital Accumulation and the Natural Resource Sector
Vanthana Nolintha + Lau Sim Yee ++
Introduction
Since the adoption of the ʻNew Economic Mechanism”̶a market-oriented economic policy̶in 1986 Lao Peopleʼs Democratic Republic (Lao PDR or Laos) has made significant progress in social and economic spheres. More specifically, Laotian economy has grown persistently at an annual rate of 6.7% in the last two decades. The Gross Domestic Product (GDP) per capita has risen from US$491 in 1986 to more than US$1,649 in 2013 1) . In social spheres, some remarkable results were accomplished. The poverty headcount ratio at US$1.25 a day (2005 PPP) dropped from 55.7% in 1992 to 33.9% in 2008 2) . The literacy rate for both male and female, the primary education completion rate and the total enrolment rate, respectively, has shown gradual but continuous improvement. Similarly, other indicators like infant mortality rate and life expectancy have also improved too.
Regarding the external sector, the open-door policy has enhanced Laotian economic integration with regional and global economy. Consequently, trade and foreign direct investment (FDI) have expanded significantly. The membership to the ASEAN in 1997 was a critical turning point in intensifying Laosʼ integration with the regional economy. Export of Laos has grown from US$217 millions in the fiscal year 1995/96 to US$1.8 billion in 2009/10.
Likewise, the amount of foreign direct investment (FDI) inflows into Laos have surged from a low level of US$4 millions in 1989 to US$ 1.9 billion in 2010 with a peak at almost US$ 4 billion in 2006. Presently, Laos also engages exhaustively in the Greater Mekong Sub-region and the Triangle Economic Development (Laos, Vietnam and Cambodia). In addition, the accession to World Trade Organization (WTO) in February 2013 has offered more opportunities for Laos to accelerate its pace for widening and deepening the scope of economic integration with the global economy.
+
Correspondence author; JSPS RONPAKU Fellow and Visiting Researcher, Department of Economics, C.Hiroike School of Graduate Studies, Reitaku University; Senior Researcher, National Economic Research Institute, Laos. Email:
[email protected]
++
Professor, Faculty of Economics and Business Administration, Reitaku University.
1) World Development Indicators Database, URL: http: //data. worldbank. org/indicator/NY. GNP. PCAP. PP. CD, retrieved on 20 September 2014.
2) Ibid., URL: http://data.worldbank.org/indicator/SI.POV.DDAY/countries, retrieved on 20 June 2013.
Journal of Economic Studies
Vol.22, March 2015
The natural resource sector has become the most vibrant sector in the Laos economy. It has contributed to most of the recent expansion of exports, the surge in FDI inflows and thus the GDP growth. After a rocket like soar in 2003 3) , the value added part of the mining sector has grown at an average of 30% per year for five consecutive years. As a consequence, the share of mining sector to total GDP rose from an average of 0.2% before 2002 to an average of 10% in the period between 2006 and 2010. In addition, the natural resource sector is the key driver for export. The share of export from this sector was about an average of 42% of total exports in the late 1990s, and it rose to an average of 75% during the period from 2006 to 2010 4) . The export of natural resource sector grew annually at an average of 65% during the last decade compared to a slower growth of 10% annual rate for the non-natural resource sector.
At the same time, the natural resource sector has drawn in significant amount of FDI inflows into Laos 5) . The amount of inflow in this sector was about 52% of total FDI over the past decade.
This figure topped at 93.5% in 2003 and 2006, respectively, when there were approvals of big hydro-power projects. The rapid increase of the natural resource sector has generated a lot of concerns about the long-term sustainability of the growth path 6) , the possible adverse effects on other sectors of the economy and potential impact on the notion of equality 7) .
Against this background, this paper aims to examine empirically the growth of Laotian economy with particular analysis on the role of capital accumulation and FDI inflows into the natural resource sector. This paper is organized as follows. Section 1 provides a literature review. Section 2 provides the descriptive assessments of economic performances of Laos.
Section 3 outlines the analytical framework. Empirical findings are provided in Section 4. The last section presents the conclusion, policy recommendations and further research directions.
1. Literature Review
For the purpose of this paper, this section reviews two major areas of literature, viz., neo-classical growth theories and Resource Curse hypothesis. Essentially, this literature review intends to provide a direct bearing for setting a theoretical foundation in constructing an analytical framework for this empirical study.
The classical theory of economic growth dates back to the work of Adam Smithʼs Wealth of Nations in 1776, in which he expounds that the inter-linkages between division of labor, capital accumulation and labor productivity growth are crucial conditions for increasing the wealth of a nation (Smith 1776). Capital and labor are two main drivers of economic growth. The
3) GDP of mining sector in 2003 is equivalent to 10 times of the level in 2002.
4) Exports from the natural resource sector include wood and wood products, electricity, mining and non-timber forest product.
5) Mining and hydro-power sectors.
6) With current rapid expansion of the natural resource sector, Laos has a risk of lower employment and higher volatility in the long-run (World Bank, 2010). The IMF (Article IV Consultation Paper in 2008) also suggests that large inflows into Laos could result in Dutch Disease over the medium term.
7) Kyophilavong and Toyoda (2008), using the macroeconomic model, conclude that a small impact of large FDI inflow
on export sector is observed through real exchange rate appreciation in Laos. Insisienmay (2008) also asserts that
there is a symptom of Dutch disease in Laos.
Harrod-Domar model of economic growth outlines the importance of capital-output ratio, saving ratio, and the rate of increase of the labor force in long-run economic growth. In essence, the Harrod-Domar model predicts that economic growth relies on two types of growth rates, viz., the natural rates of growth and the warranted rate of growth. The former depends on the increase of labor force, whereas the latter relies on saving and investment behavior of households and firms. However, Solow (1956) argues that Harrod-Domar model assumes “there is no possibility of substituting labor for capital in production.” In reality, as income rises along with economic growth, demands for goods and services also shift, and consequently the allocations of capital and labor also change. Equally crucial, technological progress̶which is exogenously determined̶induces higher labor productivity which affects the demand of labor as well. Such interactions in the allocation of factor inputs and technology in the market offer massive chances for the substitution between labor and capital.
Because of the coordination for the allocation of factor inputs in the market, the neoclassical school of thought asserts that efficient resource allocations would be ultimately determined by the price mechanism̶the interaction between demand and supply in markets characterized by perfect competition. In other words, in neoclassical economic framework, prices are vital signals for economic agents to attain efficiency in resource allocation for fostering economic growth. The introduction of Solowʼs growth model has consolidated the neoclassical approach to economic growth. The central proposition of Solowʼs growth model is
“the equilibrium rate of growth is not only not proportional to the saving (investment) rate, but is independent of the saving (investment) rate. A developing economy that succeeds in permanently increasing its saving (investment) rate will have a higher level of output than if it had not done so, and must therefore grow faster for a while. But it will not achieve a permanent rate of growth of output.” (Solow 1970).
There are two remarkable predictions from the neoclassical growth model. The first one is the conditional convergence. It predicts that the lower the starting level of real GDP per capita, relative to the long-run or steady-state position, the faster is the growth rate. Put differently, economies that have less capital per worker (relative to their long-run capital per woker) tend to have higher rates of return and higher growth rate. The second prediction states that in the absence of continuing improvements in technology, per capita growth must eventually come to an end.
By extending his neoclassical growth model, Solow (1957) expounds one of the most
important methodologies in analyzing the sources of economic growth. Although Adam Smith
(1776) emphasizes that technology is a crucial contributory factor of economic growth, rigorous
economic analysis on the role of technology or the mechanism of technical progress in economic
growth was not obvious until the seminal work of Solow in 1957. Consequently, literature on the
study of the relationship between technological change and economic growth has grown
significantly. Essentially, the basic methodology for growth accounting is to use a neoclassical
production function to estimate the contribution of capital and labor to the measured growth of
output. Any portion from the measured output growth that is not derived from the factor
inputs is defined as technological change or total factor productivity (TFP). In other words, rate
of growth of TFP is the “residual” derived from the difference between the rate of growth of output and the rate of growth of capital and rate of growth of labor. This growth accounting concept has given particular meaning to the analysis of sources of growth in the neoclassical school of thought. Also, it can be said that growth accounting has wielded a great deal of its influence not only in the industrialized world but also substantially impacted on policy makers in the developing countries.
Empirical works by Jorgenson (1995a, 1995b) indicate that the key driver of economic growth in the developed world is technical progress or TFP. However, the explanatory power of growth accounting in East Asia region is mixed. At the extreme end, some studies (for example Young 1994 and 1995) find that capital accumulation explain much of economic growth in East Asia while technological change plays a limited role in rising productivity. The findings of Marti (1996) show impressive contributory roles of capital and technological advancement in propelling growth in the East Asia region. On the contrary, although other empirical studies, which incorporated education as a variable added to the labor augmented production function, explain the role of factor accumulations, especially capital input as the main driver of economic growth in East Asia, their analytical results also show that the role of technological progress was insignificant (Collins and Bosworth, 1997).
Growth accounting methodology has both strengths and weaknesses. The key strength is its simplicity in the mechanic, which enable economists to estimate separate effects on how capital, labor and technology, respectively, have contributed to economic growth. In addition, the convergence hypothesis allows cross-country empirical studies on the variations of growth and their contributory factors. There are several limitations in growth accounting, especially in relation to the application of its analytical method in the developing world. Firstly, the conclusion that long-term economic growth relies on exogenous factors limits the application of its analytical implications in policy spheres in a developing country. In other words, the model limits the application of important policy measures that could influence long-term growth. More critically, this analytical method does not provide answers to those questions that address the sources and developments of the technological progress. Secondly, the assumption on smooth and perfect substitution between labor and capital has made the model simple, but it is faced with difficulties in its application to the real world especially in the developing countries. Finally, because of the model addresses long-term economic growth, it does not take into account the significances of expectations 8) and how it influences the macroeconomics, especially the lack of investment function 9) . This shortcoming is partly because investment function is a Keynesian type of argument that stresses the important of short-term fluctuations in the economy.
The convergence hypothesis of neoclassical growth model suggests that developing countries tend to grow faster than developed countries. As a result, as predicted by the theory,
8) Stiglitz (1973) comments that from extensive research after the introduction of Solow model, it found that the model is as debatable as the theory of Harrod because Solowʼs model does not include the role of expectations and that the economy could smoothly converge to the balanced growth path.
9) More discussion in Sen (1970).
developing countries will narrow the gap with developed countries over time. However, notwithstanding the sophistication of convergence hypothesis, Baumol (1986) shows that, from a large sample of countries, convergence theory does not explain the differences of growth rate between the developing and developed countries. Instead, empirical evidence shows that there is a convergence among a set of countries but not for countries in the world as a whole.
Although this observation could be explained by the principle of transition dynamics, Sachs and Warner (2001) show that resource-poor developing countries grow faster than resource-rich developing countries. This phenomenon has prompted many economists to claim that richness in natural resources is a curse for developmental factors.
Resource Curse hypothesis has been widely researched since the publication by Aunty (1993, cited in Frankel, 2010). The hypothesis reflects the observations that resource rich countries tends to perform relatively poorer than those with limited resources (Sachs and Warner, 2001). Moreover, countries with abundance in natural resources might be able to improve the living standards but failed to create self-sustaining economic growth (Humphreys, Sachs and Stiglitz, 2007). On the other hand, many countries with limited natural resources, for examples Japan, Korea, Taiwan and Hong Kong, enjoyed rapid export-led growth with expansions of the manufacturing sector. Still, even among resource rich countries, some performed better than the others. For instance, Botswana and Sierra Leone are both rich in diamonds. Botswana recorded a remarkable economic growth of over 7 percent per year for two decades while Sierra Leone has faced civil strife and a decline in GDP per capita (Humphreys, Sachs and Stiglitz, 2007).
There are several channels of impacts that could explain why resource rich countries may record sub-standard economic performance. These include a long term downward trend of world commodity prices 10) , the volatility of natural resource prices, the crowding out of manufacturing sector, the factor of civil war, poor institutions and the Dutch Disease (Frankel, 2010). The Dutch Disease hypothesis exhibits an adverse effect of the booming sector on the lagged sectors (Corden and Neary, 1982). Common symptoms include a real appreciation of domestic currency, expanding non-traded sector and slow-down or contraction in the traded non-resource sector. Other negative effects of the Resource Curse include the disproportionate use of technology on the extracted resource, the inefficient utilization of capital and inadequate investment in education 11) and inducement of rent seeking behaviors 12) (Humphreys, Sachs and Stiglitz, 2007).
10) There are also many papers suggest the upward trend in commodity prices. Detailed discussions on both sides could be found in Frankel (2010, pp.4-9). In general, Frankel (2010) concludes that the long-term trend of world commodity price depends on the selected period for the study.
11) Gylfason (2001) finds that government spending in education is negatively correlated with the abundance of natural resource. The study covers 90 countries in the period of 1980 to 1997. Gylfason argues that the low investment in education will become a risk for a long term growth in a resource rich country because it undermines then ecessity to diversify to non-resource sectors.
12) Leite and Weidmann (1999) construct the Endogenous Growth Model to find the determinants of corruption, using
data of 77 countries. The study finds that the corruption seems to be higher in the country with more abundance of
natural resources especially the capital intensive natural resources. Corruption is also found to have a negative impact
on long-term growth. One standard deviation shock of corruption (i.e., a lower level of corruption) leads to 1.4
percentage increase in the average growth rate.
2. An Overview of Laotian Economic Performances
Economy of Laos has grown rapidly after the introduction of the reform package in 1986. The GDP grew at an average annual rate of 6.5% between 1991 and 1995, but it declined in the late 1990s due to negative influence from the Asian Financial Crisis in 1997/98 (Figure 1). However, the economy recuperated after the impacts of the crisis diminished in the early 2000s, and consequently Laos achieved a relatively high level of economic growth in the late 2000s. The growth was most significant in the industry sector, while the service and agriculture sectors also performed reasonably well. As a result, the share of the industry sector in the GDP has increased from 8.3% in 1991 to 25% in 2010 on the one hand, while the share of the agriculture sector decreased from 53% to 30% in the same period. The share of the service sector remained stable at 38% in the late 2000s.
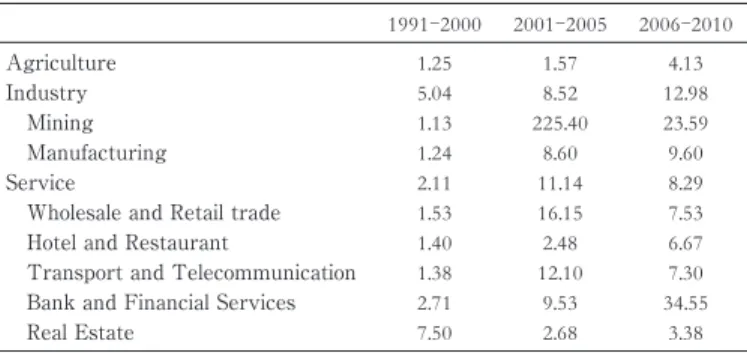
Expansion of industry sector was characterized by rapid growth of mining sector in between 2000-2005 (Figure 2). During this resource boom period, the growth of manufacturing and agriculture grew relatively faster than the earlier period while the service grew slower (Table 1). Additionally, decomposition of the GDP in relation to resource and non-resource finds that the natural resource sector (mining and electricity export) on average has contributed about one-fourth of the growth rate during 2003 to 2010 and the contribution is subject to year to year fluctuations.
Inflows of FDI have flourished over the last five years, fueled by the expansion in mining Figure 2: GDP share of the industry sector
2009 2007 2005 2003 2001 1999 1997 0.0 50.0
%
Mining Manufacturing
Electricity and water supply Construction
Figure 1: Growth rate of Laotian economy
2010 2008 2006 2004 2002 2000 1998 1996 1994 1992 1990 0 2 4 6 8 10
Source: Compiled by the authors from various annual statistical yearbooks by Lao Statistics Bureau
Table 1: Annual growth rate by industry sector (%)
1991-2000 2001-2005 2006-2010
Agriculture 1.25 1.57 4.13
Industry 5.04 8.52 12.98
Mining 1.13 225.40 23.59
Manufacturing 1.24 8.60 9.60
Service 2.11 11.14 8.29
Wholesale and Retail trade 1.53 16.15 7.53
Hotel and Restaurant 1.40 2.48 6.67
Transport and Telecommunication 1.38 12.10 7.30
Bank and Financial Services 2.71 9.53 34.55
Real Estate 7.50 2.68 3.38
Source: Compiled by the authors from various annual statistical yearbooks by Laos Statistics Bureau
and hydropower sectors. On average, the hydropower sector accounts for 29% of total approved FDI and the mining sector shares 17%. Notwithstanding such a huge volume of foreign capital inflows into mining and hydropower sectors, in which every project is a mega size, their influence on local employment is limited because these projects import capital-intensive equipments and high skill technicians from overseas, especially during the construction period 13) . Conversely, in spite of the potential to generate employment opportunity in labor intensive sectors such as agriculture, manufacturing and service, FDI inflows are in small scales or those foreign capital inflows were targeting only smaller projects which have limitation in terms of scaling up their investment frontiers.
Enhanced integration of Laotian economy into the ASEAN has brought about bigger expansion in trade volume. The boom in natural resource sector has boasted export from the average of 10% per year between 2001 and 2005 to 32% per annum between 2006 and 2009.
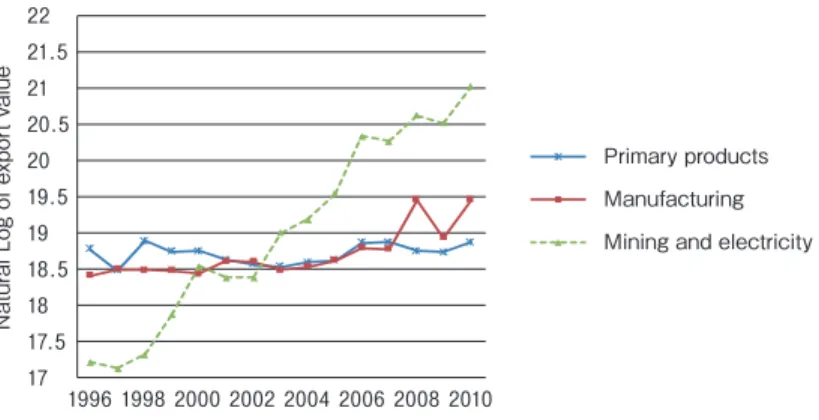
Imports, on the other hand, grew at a slower pace at 24% between 2006 and 2009, which as a result brought down the trade deficit in that same period. Higher volume of mining output and electricity production was the driver of export expansion from 2001 to 2010, whereby the share of this sector in total export rose from 28% to 75% (Figure 3). By contrast, manufacturing exports grew more slowly and consequently its share in total export contracted from 35% to 15% over the same period. The rise of imports was mainly attributed to three main domains, viz., the increase of imported capital goods geared for investment projects, petroleum and gas, and vehicles (Table 2). The import of intermediate goods for the industry sector has indeed grown more slowly in the period between 2006 and 2009, where its share of total import was at 18%.
Amid the rapid growth of the economy, the inflation rate has been well managed. Prior to the Asian Financial Crisis in 1997, the inflation rate was maintained at an annual average of
13) The output-employment elasticity for mining sector is estimated at 0.29 which is the lowest compared to other sectors. This suggests that 1% increase in output of mining sector generates only 0.29% increase in employment. The elasticity for the whole economy is 0.40, 0.94 for the service sector, and 1.32 for hotels and restaurants ( Fourth NHDR Report, UNDP and MPI, 2009).
Figure 3: Export by major product groups
17 17.5 18 18.5 19 19.5 20 20.5 21 21.5 22
1996 1998 2000 2002 2004 2006 2008 2010
Natural Log of export value
Primary products Manufacturing Mining and electricity
Source: Calculated by the authors based on data from the Ministry of Industry and Commerce
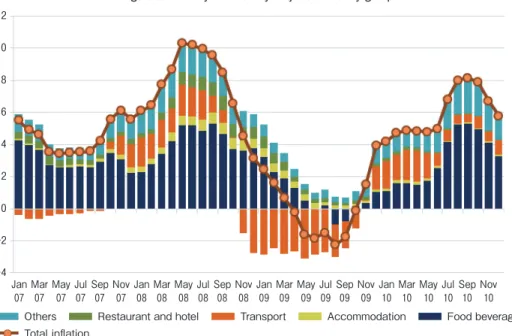
13% , but it increased dramatically up to 87% in 1998 and then further aggravated to 134% in 1999 (Figure 4). 1998-99 was considered as a hyperinflation period of Laotian economy. This extraordinary surge of the inflation rate in 1998-99 was mainly due to the extensive printing of money to finance government expenditure to boost the economy which was seriously affected by the impact of the crisis in terms of the devaluation of local currency. When the Asian Financial Crisis subsided, the Central Bank followed up with a counter measure by issuing the Central Bankʼs Bills to absorb liquidity from the economy. As a result, inflation dropped to 27 percent in 2000 and it gradually declined to a single digit in subsequent year. Since then, by and large, inflation is induced by imported food and fuel (Figure 5). There are two reasons for this imported inflation. Firstly, imported food affects food prices in Lao economy. Secondly, the rise of the oil price in between 2006-2010 has affected imported fuel prices. Indeed, empirical analysis of Insisienmay and Nolintha (2010) shows that the inflation in Laos is strongly influenced by prices of its major trading partner̶Thailand̶while domestic money supply and output growth have minimal impact on inflation 14) .
The value of Laotian currency has fluctuated through two major trends. In 2000-2002, the LAK depreciated against both Thai Baht and US Dollar. However, since 2003, LAK appreciated against US dollar (Figure 6). Consequently, the business community in the export sector voiced their concerns about the impact of continuous rise on exchange rate which affected their competitiveness 15) . However, the net impact of the hike in nominal exchange rate is inconclusive because in the medium term horizon, Laos will continue to depend on imports of consumption goods as well as more critically capital goods. In fact, the concern over the lost of
14) Insisienmay and Nolintha (2010), using the accumulated impulse response based on the SVAR model of inflation, suggest that Thai inflation explains about 92% of the variation in Laotian inflation in short-term. Over the medium (3 years) and long term (5 years), the variation comes from the Thai inflation (47%), NER (24%), GDP (4.5%) and money supply (3.4%). These analytical findings substantiated the impact of imported inflation in Laos and thus its economy needs a policy anchor for maintaining exchange rate stability in order to control pricestability.
15) The Garment Export Association calls for government support in intervening in the currency market in 2008. The association claims that the industry relies on revenue in US dollars but expenditure in local currency. As such, recent appreciation has pushed up the production cost in US dollar term in the industry.
Table 2: Import pattern
Average annual growth Average share of total 1996-2000 2001-05 2006-09 1996-2000 2001-05 2006-09
For investment projects
-20.528.6 21.0 6.8 31.0 33.5
Petroleum and gas 8.8 17.4 27.1 12.7 18.4 20.5
Vehicles and parts
-15.318.7 59.9 15.8 4.3 8.8
Inputs for the industry sector
-7.723.1 8.0 3.2 19.8 18.3
Inputs for agriculture
-9.722.0 42.6 4.7 2.3 1.7
Construction materials
-22.6 -0.47.0 19.4 4.5 2.6
Electronic goods
-37.242.4 64.2 10.8 0.7 1.0
Food
-20.414.3 98.0 7.6 3.3 2.4
Electricity
-16.135.8 37.5 2.0 1.6 2.0
Luxury goods
-21.164.8 196.5 1.0 0.6 0.9
Others 4.3
-0.273.1 15.8 13.6 8.4
Source: Calculated by the authors based on data from the Ministry of Industry and Commerce.
Figure 4: Average Inflation
2010 2009 2008 2007 2006 2005 2004 2003 2002 2001 2000 1999 1998 1997 1996 1995 1994 1993 1992 1991 1990 0 50 100 150
Source: Calculated by the authors based on data published in various annual statistical yearbooks by Laos Statistics Bureau
Figure 5: Monthly Inflation by major commodity groups
Nov 10 Sep
10 Jul 10 May
10 Mar
10 Jan
10 Nov
09 Sep
09 Jul
09 May
09 Mar
09 Jan
09 Nov
08 Sep
08 Jul 08 May
08 Mar
08 Jan
08 Nov
07 Sep
07 Jul
07 May
07 Mar
07 Jan
07
‑4
‑2 0 2 4 6 8 10 12
Total inflation
Food beverages Accommodation
Transport Restaurant and hotel
Others
Source: Calculated by the authors based on data published in various annual statistical yearbooks by Laos Statistics Bureau
Figure 6: Nominal exchange rate
1999/2000 2002/2003 2005/2006 2008/2009 0
20 40 60 80 100 120 140
USD/LAK THB/LAK
Note:2002=100. Increase means appreciation.
Source: Calculated by the authors based on data from the Bank of Lao PDR
competitiveness is strongly supported by the appreciation of the real effective exchange rate (REER) since 2002 (Figure 7). The REER of Laotian currency has increased faster than other countries in the Mekong sub-region. Furthermore, another key factor that has driven the appreciation of Lao KIP over the past five years is the rise of FDI inflows and the increase of export revenue in US dollars from booming exports of mineral resources.
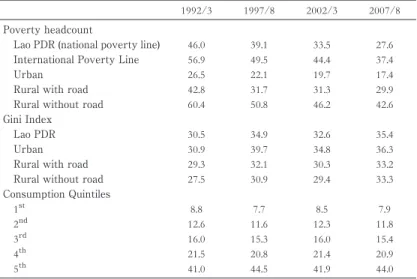
Despite outstanding progress on economic development, inclusiveness of growth dividends has been a recent subject of concern. With rapid economic growth, Laos manages to reduce the incidence of poverty substantially both in the urban and rural area (Table 3).
However, the Gini coefficient, which measures the intensity of inequality, increases in 2007/08 compared to 2002/03 in both rural and urban area. Widening inequality is resulted from divergent trends of income growth during this period in which the richest 20% enjoy higher share of total income and the opposite trend for the poorest 20%. Economic development during this natural resource boom period can be characterized by rapid increase in income,
Figure 7: Real effective exchange rate
2011M07
2010M10
2010M01
2009M04
2008M07
2007M10
2007M01
2006M04
2005M07
2004M10
2004M01
2003M04
2002M07
2001M10
2001M01
2000M04
1999M07
1998M10
1998M01
1997M04
1996M07
1995M10
1995M01
40 90 140
Vietnam Thailand
Laos Cambodia
Note: December 2012=100. Increase means appreciation Source: Calculated by the authors based on data from Darvas (2012)
Table 3: Poverty and inequality
1992/3 1997/8 2002/3 2007/8
Poverty headcount
Lao PDR (national poverty line) 46.0 39.1 33.5 27.6
International Poverty Line 56.9 49.5 44.4 37.4
Urban 26.5 22.1 19.7 17.4
Rural with road 42.8 31.7 31.3 29.9
Rural without road 60.4 50.8 46.2 42.6
Gini Index
Lao PDR 30.5 34.9 32.6 35.4
Urban 30.9 39.7 34.8 36.3
Rural with road 29.3 32.1 30.3 33.2
Rural without road 27.5 30.9 29.4 33.3
Consumption Quintiles
1
st8.8 7.7 8.5 7.9
2
nd12.6 11.6 12.3 11.8
3
rd16.0 15.3 16.0 15.4
4
th21.5 20.8 21.4 20.9
5
th41.0 44.5 41.9 44.0
Source: Compiled by the authors from various reports on Lao Consumption and Expenditure Survey by Lao Statistics Bureau
decline in poverty incidence but rising inequality. Although such characteristics can be explained by Kuznets hypothesis, the causality between resource boom and inequality is still unclear, as a bulk of literature shows opposing views 16) . The concern for growth inclusiveness in Laos indeed deserves a rigor analysis.
3. Analytical framework
This empirical study aims to examine the role of capital accumulation and the FDI driven growth in natural resources sector. For this purpose, this section depicts the analytical framework that provides an econometric model for investigating the relationship between output growth, capital accumulation and labor growth. Our analysis uses time series data of GDP, gross fixed capital formation (GFCF) and labor force obtained from the Lao Statistics Bureau. GDP and GFCF are real terms expressed in 2002 price.
3.1 Model specification
For the purpose of the empirical analysis, Laotian economy is expressed by the neo-classical production function in the form of Cobb-Douglass production function 17) as shown in Eq.1. Y represents GDP, A represent the constant term, K denotes capital stock, L stands for labor, and e
is the time trend which denotes the technical progress known as total factor productivity (TFP).
Y = Aε
Kβ
Lβ
⑴
We transform the Eq.1 into a linear function which is shown in Eq.2. In order to obtain an equation that alludes the decomposition of GDP growth rate, we total differentiate Eq. 2 and thus it becomes Eq. 3. In this equation, dY
Y is the growth rate of output, dK
K is capita growth rate, dL
L is labor growth rate, dt is the growth of time trend, β
is the output elasticity of capital, β
is the output elasticity of labor and α
the rate of TFP change. Using Eq. 3, we can examine the relationship between output and inputs by time series regressions.
ln Y =ln A+αt+β
ln K+ β
ln L ⑵ dY
Y =αdt +β
dK K +β
dL
L ⑶
16) The concentration of mineral sector together with low quality investment and low level of education contribute to the relationship between resource boom and inequality in Africa (Deaton, 1999). Many studies assert that the least developed countries, which often have relatively weaker social infrastructure and dysfunctional economic policy and institution/organization, face negative impact of resource boom in terms of increasing rent seeking and inequality (for instance, see Lane and Tornell,1995). However, a panel econometric analysis of 90 countries shows opposite result regarding the impact of resource boom on inequality. Goderis and Malone (2011) find that the resource boom helps lower the income inequality in the boom period but over time that positive effect gradually diminishes to the level of inequality prior to the boom.
17) See McQuinn and Whelany (2006); Mankiw, Romer, and Weil (1992)
In addition, in order to examine the relationship between output per labor (i. e. labor productivity) and capital per labor (i.e. capital intensity), we can divide both sides of Eq.1 by labor (L) and then it becomes Eq.4. With the assumption 18) of a constant return to scale (β
1+ β
2= 1), the Eq. 1 can be denoted in the form of output per labor (i.e., labor productivity) as shown in Eq. 4. We can further transform Eq. 4 to a linear function as shown in Eq.5. On that basis, we can make a regression of the output per labor on time trend and capital per labor (K/L, i.e., capital intensity).
Y
L =Aε
K L β
⑷ Δ Y
L =ln A+αt+ β
Δ K
L ⑸
In order to control for other macroeconomic factors that could have affected growth, we extend Eq. 3 to include other controlled variables which are considered to have influenced the growth performance of Laotian economy. Undoubtedly, macroeconomic stability is a crucial factor for growth because positive output growth also influences prices of goods and services.
However, the relationship between prices and output could be either positive or negative (Samuelson and Nordhaus, 1992, p.595). In addition, empirical studies by Kamin and Rogers (2000) and Husain et al. (2005) demonstrate that the real exchange rate volatility is the result of poor macroeconomic policies which consequently hinders economic growth. From these perspectives, our study selects inflation (INFL) and the growth rate of real effective exchange rate (REER) as key factors that exert influence on output growth. Furthermore, we extend the model to reflect two major structural changes such as the Asian Financial Crisis and the increasing share of FDI in the natural resource sector. Therefore, the dummy variable CRISIS and the share of FDI in the resource sector (FDINAT) are also included in the extended equation. These specifications are shown in Eq.6. In other words, Eq.6 is used for the purpose of verifying the relationship between growth rate of output and growth rate of inputs after controlling for other macroeconomic factors and structural changes. The expected sign on β
and β
is negative for REER 19) and CRISIS respectively, positive for β
but for β
it can be either positive or negative.
d
Y =αdt +β
dK K + β
dL
L + β
dREER
REER +β
INFL+ β
CRISIS+β
FDINAT ⑹
18) In Cobb-Douglass production function, constant return to scale is commonly assumed (see Joshesk et al, 2011 and Felipe and Adams, 2005). However, the natural resource sector intuitively is increasing return because of its capital intensive oriented production activities. As such, the sum of output elasticity of capital and labor will be greater than one. However, this study assumes they are constant return to scale in order to make the findings from the study comparable to earlier study on Laotian economic growth, which also made the assumption of constant return to scale (for instance, Insisienmay, 2006).
19) REER indicates the relative prices between home and foreign market hence real appreciation (increase in REER)
could reduce the price competitiveness of the countryʼs overall export. Hence, REER is expected to have negative
impact on the output growth. The equation introduces the lagged value of REER to capture the time lag of the impact
from REER change to output.
=C+ Γ
+ Γ
+ ... +Γ
+ε
⑺
The structural approach to a time series modelling uses the production function in order to specify how the dependent variable dY
Y is influenced by those independent variables which are the focus our empirical inquiry. For this purpose, we have to extend our investigation so as to include dynamic specifications which identify the relationships among those independent variables that fit into empirical analytical framework. In this context, we construct a vector autoregressive (VAR) model by treating every endogenous variable as a function of the lagged values of all endogenous variables in the system. Such a VAR(p) model involves a system of equations being denoted by Eq.7 where y
tis a column vector of the endogenous variables (i.e., output growth rate, capital growth rate, labor growth rate and inflation), C is a vector of constant, p is the order of time lag, each Γ
, Γ
.... , Γ
is a coefficient matrix, each
,
... ,
is a vector of the lag endogenous variables, and ε
is a vector of the random error term in the system. The appropriate lag length for our system of equations is one time period, meaning that we include one year lagged for all variables to the right hand side of the equation.
3.2 Estimation of capital stock
For the purpose of growth accounting, this study needs to estimate capital stock of Laotian economy. There were a few attempts in estimating capital stock in Laotian economy, but their methodologies were too simplified. For example, Kyophilavong (2004) estimates the capital stock by making two strong assumptions: capital stock equals to output in the initial year; and there is no capital depreciation. These assumptions are too simplified and hence they are questionable in terms of the reliability of the estimated results. Insisienmay (2006), by adopting Kuznets (1955) model, incorporates annual capital depreciation rate and the author estimated the initial capital stock by considering lagged relationship between investment growth and capital.
In order to overcome the limitation of the existing studies in Laos, we place particular emphasis on the influence of a long-term rate of investment growth, which depicts the long term relationship between capital and output closer to the observed reality in Laotian economy. From this perspective, our estimation is quite similar to the methodology used in Selia (2011) and UNIDO (2008). In our model, as shown in Eq. 8, the capital stock in the base year is estimated by considering the long term investment growth. K
Tis the capital stock of the base year, I
Tis the investment in the base year, i is the average growth rate of investment for a period of 10 years prior to the base year and d
Tis the depreciation rate in the base year.
K
= I
i+d
⑻
K
=K
+I
−DEP
⑼
In order to incorporate capital depreciation, we use the conventional Perpetual Inventory
Method (Eq.9). K
tand K
t-1,respectively represents capital stock in year t and t-1; I
tis gross capital formation in year t and DEP
tis the capital depreciation in year t. Our depreciation rate is estimated following Kuznets (1955) and Insisienmay (2006). From this approach, the annual capital depreciation is 6. 13% in Laos, which is consistent with the depreciation in the sub-region 20) . Accordingly, Eq. 9 allows us to estimate the capital stock in the years after the initial year. Using the above methodology, capital stock of Laos can be estimated and the results are shown in Table 4.
After the booming of the natural resource since early 2000s, capital stock in Laos has been accumulated at the more rapid pace. The growth of capital stock increased from an average of 5.4% per year from 1991 to 2002. The growth rate has increased to 7.2% from 2003 to 2010. The ratio of capital to labor also has increased significantly in particular after the natural resource boom period. This confirms that Laotian economy has become more capital intensive. The ratio between capital per output has declined gradually. This implies that capital stock growth has surpassed the output growth.
4. Empirical results and discussions 4.1 Growth Accounting
Before the regression analysis on Eq.3, we conducted standard unit root tests in order to
20) 5% for Cambodia, 6% for Vietnam and 7% for Thailand , see Seila (2011).
Table 4: Estimated capital stock Capital stock
(million LAK)
Labor (person)
Growth of capital
Capital/
labor
Capital/
output
1991 36,719,197 2,098,240 17.5 4.2
1992 38,497,086 2,138,727 4.8 18 4.1
1993 40,820,549 2,182,917 6 18.7 4.1
1994 43,059,947 2,219,585 5.5 19.4 4
1995 45,758,215 2,265,258 6.3 20.2 3.9
1996 48,370,576 2,314,382 5.7 20.9 3.9
1997 51,058,507 2,363,820 5.6 21.6 3.9
1998 53,835,116 2,414,131 5.4 22.3 3.8
1999 56,568,099 2,459,483 5.1 23 3.8
2000 60,084,767 2,514,007 6.2 23.9 3.9
2001 63,017,438 2,582,682 4.9 24.4 3.9
2002 65,457,563 2,650,104 3.9 24.7 3.8
2003 68,761,071 2,675,528 5.1 25.7 3.7
2004 73,067,084 2,706,188 6.3 27 3.7
2005 77,830,514 2,740,511 6.5 28.4 3.7
2006 83,368,471 2,816,502 7.1 29.6 3.6
2007 90,754,048 2,881,081 8.9 31.5 3.7
2008 97,846,643 2,938,338 7.8 33.3 3.7
2009 105,537,528 2,998,225 7.9 35.2 3.7
2010 113,707,097 3,064,881 7.7 37.1 3.7
Source: Estimated by the authors using the data on gross fix capital formation provided by Lao Statistics Bureau
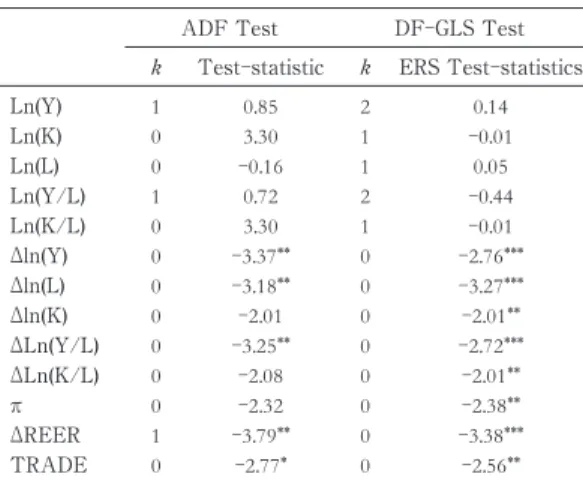
ensure our time series data is stationary 21) . For this purpose, the augmented Dickey-Fuller (ADF) test and the Dickey-Fuller Test with GLS de-trending (DFGLS) test are conducted for all the data series. The unit root test results are provided in Table 5. The results show that we could not reject the null hypothesis of an existence of a unit root in ln(Y), ln(K) and ln(L).
However, the first difference series of ln(Y), ln(K) and ln(L) used in the regression are stationary. In this regard, therefore, the time series regression on Eq.3 uses the first difference series to analyse the relationship between output, input and TFP in Laotian economy. The regression results on the relationship between the output growth rate, capital growth rate, labor growth rate and the time trend, which reflects the change of TFP as specified in Eq.3 are summarized in Table 6. The coefficient on dK
K and dt (time trend) are positive and statistically significant. These suggest that change is output is positively related with change in capital.
The TFP is statistically significant in explaining that the technical progress has contributed to
21) A stationary time series data means that series has a constant mean and variance over time, which implies that the series fluctuate around the mean value and thus does not affect by the time trend.
Table 5 Unit root test
ADF Test DF-GLS Test
k
Test-statistic
kERS Test-statistics
Ln(Y) 1 0.85 2 0.14
Ln(K) 0 3.30 1
-0.01Ln(L) 0
-0.161 0.05
Ln(Y/L) 1 0.72 2
-0.44Ln(K/L) 0 3.30 1
-0.01Δln(Y)
0
-3.37**0
-2.76***Δln(L)
0
-3.18**0
-3.27***Δln(K)
0
-2.010
-2.01**ΔLn(Y/L)
0
-3.25**0
-2.72***ΔLn(K/L)
0
-2.080
-2.01**π
0
-2.320
-2.38**ΔREER
1
-3.79**0
-3.38***TRADE 0
-2.77*0
-2.56**Note: (1) The test equations include constant. Null hypothesis: series has a unit root. (2) In DF-GLS test, the critical values are-3.69, -1.96and-1.61for the1%,5% and10% level, respectively. (3) The lag length (k) is selected by the minimum AIC with maximum lag=3. (4) ***, **, * denote rejection of null hypothesis at the1%,5% and10% level of significance, respectively.
Table 6: Regression results, relationship between outputs, capital, labor and TFP, 1990 to 2010
dYY(Dependent) Eq.3
Coef.
dKK
0.51 (3.12)***
dLL
0.06 (0.14)
dt
0.03 (2.60)***
R2 0.38
Adjusted R2 0.29
Durbin-Watson 1.87
Degree of freedom 18
Source: Estimated by the authors
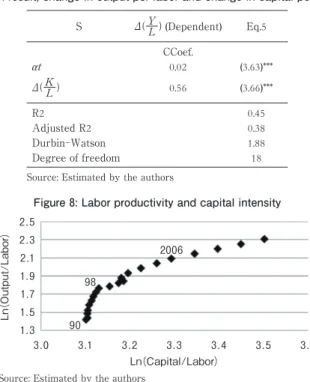
growth in Laotian economy. Specifically, 1% increase in capital growth rate pushes up output growth rate by 0. 51%. Equally important, the estimated results show that a 1% increase in technical progress (i.e., TFP) causes 0.03% rise in output growth rate. The analytical results of Eq. 5 are shown in Table 7, and the relationship shown in Eq. 5 is depicted in Figure 8.
4.2. Influence of REER, inflation and structural changes
The regression result of Eq.6 is summarized in Table 8. As explained in earlier sections, Eq.6 extends the standard production function originated from Cobb Douglas production function to include other explanatory variables like REER, inflation and structural changes in order to control for their effects on growth. Because of the strong correlation between inflation and the dummy on the Asian Financial Crisis (Table 7), these two variables are run separately in the regression analysis. The estimated coefficient of capital growth rate and the time trend (TFP) remain statistically significant in both equations. 1% increase in capital growth rate pushes up output growth rate by 0.58% and 0. 54%, respectively. However, the estimated coefficient of labor growth rate is statistically insignificant in all equations. These results imply that capital growth rate contributes to output growth rate in Laos, even after controlling for other factors, while labor growth does not contribute to GDP growth. TFP also provides a contributory role in pushing economic growth in Laotian economy. In other words, 1% increase in TFP causes output growth rate to rise by 0.02% and 0.03%, respectively in both estimations of Eq.6.
The empirical findings in this study have other implications for Laotian economy. The estimated coefficients of the dummy on the Asian Financial Crisis and the share of FDI in the
Table 7: Regression result, change in output per labor and change in capital per labor, 1990 to 2010
S
ΔYL
(Dependent) Eq.5 CCoef.
αt
0.02 (3.63)***
ΔK
L
0.56 (3.66)***
R2 0.45
Adjusted R2 0.38
Durbin-Watson 1.88
Degree of freedom 18
Source: Estimated by the authors
Figure 8: Labor productivity and capital intensity
2006
98
90
Ln(Capital/Labor)
3.6 3.5 3.4 3.3 3.2 3.1 3.0 1.3 1.5 1.7 1.9 2.1 2.3 2.5
Ln(Output/Labor)
Source: Estimated by the authors
natural resource sector are statistically significant and have the anticipated sign. These findings suggest that the negative external shock hampers growth. More specifically, the Asian Financial crisis reduces the output growth rate by 0.68%. 1% increase in the share of FDI in the natural resource sector increases the output growth rate by 0. 001%. The estimated coefficient on REER and inflation are however statistically insignificant.
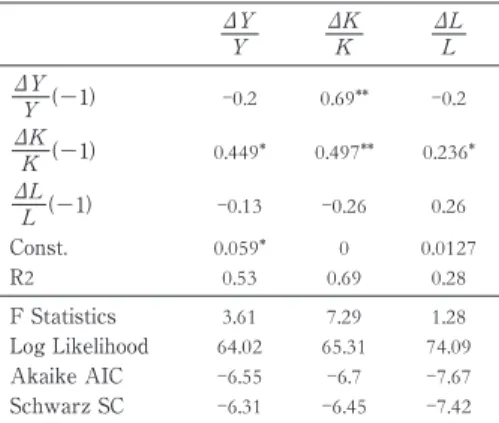
The estimated results from the VAR model, which is summarized in Table 9, could complement the discussion from multivariate regression results in the preceding paragraphs.
Because of insufficient time series sample, these analytical findings from VAR model are not appropriate for concrete statistical inference of causality. Nonetheless, the results can be used to examine the correlation among variables, viz., output growth rate, capital growth rate, labor growth rate between present year and previous year. It is apparent from Table 9 that output growth rate of previous year (i.e., ΔY
Y −1) is correlated to capital growth of present year (i.e., ΔK K ). Likewise, capital growth rate of previous year (i.e., ΔK
K −1) has correlation with output growth rate (i.e., ΔY
Y ), capital growth rate and labor growth rate (i.e., ΔL
L ) of the present year dt On the contrary, labor growth rate of previous year (i.e., ΔL
L −1) does not correlate with output growth rate (i.e., ΔY
Y ), capital growth rate (i.e., ΔK
K ), and labor growth rate of present year (i.e., ΔL
L ).
These empirical analyzes conclude that capital accumulation is the main driving force of economic growth in Laos. Capital, which is accumulated from domestic investments and FDI
Table 8: Correlation matrix between variable in Eq.6
Δln Y Δln K Δln L
INFL
ΔLn(REER) CRISIS Δln Y1.00 0.61 0.04
-0.660.07
-0.53 Δln K0.61 1.00 0.02
-0.300.34
-0.19 Δln L0.04 0.02 1.00
-0.03 -0.040.00 INFL
-0.66 -0.30 -0.031.00
-0.140.85
ΔLn(REER)0.07 0.34
-0.04 -0.141.00
-0.16CRISIS
-0.53 -0.190.00 0.85
-0.161.00
Table 8 Regression result, relationship between output growth rate and input growth, 1990 to 2010
dYY
(Dependent) Eq.6
α
0.02 (2.65)** 0.03 (2.42)**
β
0.58 (3.51)*** 0.54 (3.68)***
β
0.46 (1.02) 0.38 (1.01)
β
-0.005(0.03)
-0.01(-0.46)
β
-0.001(-0.23)
β
-0.68(-2.22)**
β
0.001 (2.13)* 0.001 (1.92)*
R2 0.56 0.68
Adjusted R2 0.39 0.56
Durbin-Watson 2.18 2.98
F Statistics 4.84 8.48
Prob
>F 0.02 0.00
Note: L is used as the symbol representing first difference of each variable. *, **, and *** denote the statistically significant at10%,5% and1% level, respectively.
Source: Estimated by the authors.
inflows, affects the economic performance in several ways. First, being a low saving economy 22) , Laos relies on the excess saving from overseas (in the form of FDI and ODA) to finance the countryʼs economic development. FDI inflows into the natural resource sector, which account for about half of the total foreign capital inflows, indeed have contributed to economic growth in Laos. Second, labor productivity is influenced by capital intensity. This implies that the rise of capital stock, accumulated by investments, influences growth through imported technology embodied in capital goods and training activities (on-the-job training or off-the-job training) provided for more effective use of those capital goods.
5. Conclusion
This paper aims to substantiate how capital accumulation and natural resource boom have contributed to the growth of Laotian economy. The descriptive assessment of economic performance of Laos finds that the rapid growth of Laotian economy is influenced by the expansion of FDI and exports in the natural resource sector. On a macroeconomic level, although price remains relatively stable in recent years, losing export competitiveness because of the appreciation of REER, the rise of Gini coefficient shows that growth̶instead of being inclusive̶has widen the disparity, and over-dependence on the natural resource sectors have become major challenges of Lao economy.
The purpose of our empirical analysis is to investigate the contribution of capital input, which is accumulated from both domestic investments and FDI inflows. In the first regression model, constructed from a Cobb-Douglass production function, the results illustrate that capital, instead of labor, has contributed to output growth in Laos. In addition, the growth accounting also shows that TFP has contributed to growth. In to control for effects from other factors that are important for growth, we extend the basic model to include other explanatory
22) Based on the National Account, the Gross Saving Rate in Laos is 23% of GNI but the adjusted net saving rate is only 9% (Ruta, 2010). This is lower than the average of East Asian Region.
Table 9: Regression results, VAR model
ΔYY ΔKK ΔL
L
ΔYY −1 -0.2
0.69**
-0.2ΔKK −1
0.449* 0.497** 0.236*
ΔL
L −1 -0.13 -0.26
0.26
Const. 0.059* 0 0.0127
R2 0.53 0.69 0.28
F Statistics 3.61 7.29 1.28
Log Likelihood 64.02 65.31 74.09
Akaike AIC
-6.55 -6.7 -7.67Schwarz SC
-6.31 -6.45 -7.42Note: *, **, and *** denote the statistically significant at10%, 5% and1% level, respectively.
Source: Estimated by the authors.