1
Leymus racemosus, a wheat wild relative is a potential source for wheat improvement for aluminum and heat stress tolerance ( コムギの近縁種、オオハマニンニクはコムギのアルミニウムおよび
高温耐性を改良するための潜在的資源である )
Yasir Serag Alnor Mohammed
2014
2
Leymus racemosus, a wheat wild relative is a potential source for wheat improvement for aluminum and heat stress tolerance
( コムギの近縁種、オオハマニンニクはコムギのアルミニウムおよび 高温耐性を改良するための潜在的資源である )
A thesis Submitted to the United Graduate School of Agricultural Sciences, Tottori University, in partial fulfillment of requirements for the doctoral degree (PhD) in Agricultural Sciences, Plant Molecular Breeding
By
Yasir Serag Alnor Mohammed
Approved by:
Prof. Dr. Nitaro Maekawa………..
Dean, United Graduate School of Agricultural Sciences, Tottori University
Prof., Dr. Hisashi Tsujimoto ……….
Chairman of Supervisory Committee
The United Graduate School of Agricultural Sciences Tottori University
2014
3
Table of contents
Table of contents --- I Acknowledgement --- III
General introduction --- 1
Chapter 1 1.1 Abstract --- 5
1.2 Introduction --- 6
1.3 Materials and Methods --- 7
1.4 Results --- 13
1.5 Discussion --- 17
Tables and figures --- 22
Chapter 2 2.1 Abstract --- 32
2.2 Introduction --- 33
2.3 Materials and Methods --- 34
2.4 Results --- 37
2.5 Discussion --- 45
Tables and figures --- 50
Chapter 3 3.1 Abstract --- 60
3.2 Introduction --- 61
3.3 Materials and Methods --- 63
3.4 Results --- 66
3.5 Discussion --- 71
Tables and figures --- 76
General discussion and conclusion --- 88
Summary --- 89
Summary (in Japanese) --- 92
4
References --- 94 List of publications --- 111
5
Acknowledgement
I would like to express my truthful thankfulness and gratitude to my supervisor, Professor Tsujimoto Hisashi for providing generous, smooth and perfect environment for me during the entire course of this study.
Without this valuable guidance, thoughtful advice, continues encouragement and endless patient, this thesis would not have come into being.
Next, my deep appreciation and thanks are extended to my co-supervisors, Professor Toru Kobata and Associate Professor Hiroyuki Tanaka for their thoughtful advice and kind help.
I sincerely acknowledge Assistant Professor Dr. Amin Elsadig Eltayed for his kind support fruitful advice and continuous support during the course of this study.
My deep thankfulness is extended to all my colleagues in Plant Molecular Breeding laboratory for their friendliness attitude, help and support.
My gratitude and thanks to the Ministry of Education, Science, Sports and Culture of Japan for providing the financial support that effectively contributed in the rapid and smooth completion of this study.
Especial thanks and appreciation is extended to my wife Nasrein for her extended love, kind help and support.
Finally, I would like to express my honest thankfulness to my father and my brothers, for their deep heartfelt love and their endless struggle through the years to help my own development. It is your gift of years of prayers and love that spirited me and made this dream of us came true. You have all my love and gratitude.
Yasir Serag Alnor Mohammed
6
General introduction
Wheat (Triticum spp.) is one of the most widely grown food grain in the world, providing about one-fifth of the calories consumed by human (FAOstat 2007). Wheat is grown on more land area than any other commercial crop and continues to be the most important food grain source for humans. Its production leads all crops, including rice, maize and potatoes.
The world’s population is expected to grow considerably over the coming years; the world’s population is forecast to increase by 2 billion people to exceed 9 billion people by 2050. Recent FAO estimates indicate that to meet the projected demand, global agricultural production will have to increase by 60 percent from its 2005–2007 levels. In 2010–2012, about 870 million people or one in eight of the people in the world did not consume enough food to cover their minimum dietary energy requirements. Of these people, 852 million were in developing countries, making up 14.9 percent of the total population of these countries (FAOstat 2013).
This situation made the increase in wheat production area and wheat productivity by unit area an urgent objective worldwide. The total potential area for wheat production expansion estimated in the tropics to be between 3 and 4 million ha in nearly 60 countries.
These countries can be divided into two basic environments; the first one is characterized by high temperature, dry, short crop season and few disease problems, whereas the second environment is characterized by high temperature, more humid, short crop season and high disease problems (Curtis 1988). The expansion of wheat production into these new marginal areas is hindered by biotic and abiotic stresses, therefore broadening the genetic
7
variability of wheat for more marginal areas and warmer climates and their stresses is essential. Moreover the expected reduction on wheat production due to climate change (Yang et al. 2013, Lobell et al. 2011) adding another dimension to the problem and complicate the future of food production.
Development of new stress tolerant cultivars with high yield potential and well adapted germplasm to enable the expansion and stabilization of wheat production and increase the wheat productivity, can be achieved by marker assisted breeding, genetic transformation and discovery and utilization of novel genes presented in wild relatives of wheat.
Several studies have revealed the significance of utilizing wheat alien genes to improve wheat abiotic stresses (heat, salt and drought), diseases, insect, kit-nematode resistance, nutrient use efficiency, grain yield and bread making quality (Eastwood et al.
1994, Jiang et al. 1994, Cox et al. 1995, Gatford et al. 2002, Marais et al. 1994, Martin- Sanchez et al. 2003, Dreccer et al. 2004, Wang et al. 2010, Garg et al. 2009, Li et al. 2013), with the aid of powerful molecular biology and cytogenetic techniques.
The nature of the most of the wild relatives as perennial species with huge biomass, small dormant seeds and poor agronomic traits complicate the proper evaluation and determination of their response under different stress conditions. On the other hand most of these wild relatives were successfully hybridized with wheat and resulted in wheat lines with addition, substitution and translocated chromosomes harboring part of the wild relative genome. The availability of hundreds of these lines in the genebanks facilitated the examination and determination of the wild relative’s genes response under stress conditions
8
to explore new sources of stress tolerance genes. Moreover the presence of these genes in the wheat background allows the determination of their positive or negative impact when interacting with wheat genome.
One of the great sources of alien genes is the wheat wild relatives Leymus species.
Leymus is a gnomically defined, allopolyploid, genus (2n=28 or 56; genome NsNsXmXm or NsNsNsNsXmXmXmXm) in tribe Triticeae, consisting of about 30 species worldwide.
Leymus racemosus (2n= 28, NsNsXmXm) is a perennial grass that grows along sea coasts and in inland dry areas including saline or alkaline lands, dry or semi-dry areas and shady moist forests (Fan et al. 2009). It is evolutionarily distant from wheat, and has exceptionally large spikes, strong rhizomes and vigorous growth. L. racemosus is tolerant to salt and drought (McGuire and Dvorak 1981) and resistant to various diseases, such as scab (Mujeeb-Kazi et al. 1983). Our observations of L. racemosus plants growing in the Arid Land Research Center, Tottori, Japan (35°32N, 134°13E), also indicated its ability to tolerate heat stress; it showed vigorous growth, flowering from May to June, and filled its grains from July to August during the high temperature and humidity of the summer season.
Several Leymus species including L. racemosus have been successfully hybridized and backcrossed with wheat. Some of the resulting addition lines possess potentially useful traits, including biological nitrification inhibition (Subbarao et al. 2007), resistance to Fusarium head blight (Chen et al. 2005, Qi et al. 2008, Wang and Chen 2008), and salt tolerance (Liu et al. 2001).
Due to the importance of Leymus as a novel source of useful traits, this thesis aimed to determine the impact of L. racemosus chromosomes on wheat aluminum toxicity
9
tolerance and heat stress tolerance and adaptation through physiological and molecular evaluation of wheat-Leymus racemosus chromosome introgression lines.
The first chapter describes the impact of several L. racemosus chromosomes on wheat aluminum tolerance and the identification of two introgression lines with enhanced aluminum tolerance. The second chapter demonstrates the effect of L. racemosus chromosomes on heat stress tolerance of wheat in term of physiological and morphological traits including yield and yield components. The third chapter shows the impact of two L.
racemosus chromosomes on enhancing wheat adaptation by accelerating the flowering and maturity dates.
10
Chapter 1
Impact of wheat-Leymus racemosus added chromosomes on wheat aluminum tolerance
1.1 Abstract
Aluminum (Al) toxicity is the key factor limiting wheat production in acid soils. Soil liming has been used widely to increase the soil pH, but due to its high cost, breeding tolerant cultivars is more cost-effective mean to mitigate the problem. Tolerant cultivars could be developed by traditional breeding, genetic transformation or introgression of genes from wild relatives. Thirty wheat alien chromosome addition lines were used to identify new genetic resources to improve wheat tolerance to Al, and to identify the chromosomes harboring the tolerance genes. These lines and their wheat background Chinese Spring were evaluated for Al tolerance in hydroponic culture at various Al concentrations. Also Al uptake, oxidative stress, and cell membrane integrity were investigated. The L. racemosus chromosomes A and E significantly enhanced the Al tolerance of the wheat in term of relative root growth. At the highest Al concentration tested (200 µM), line E had the greatest tolerance. The introgressed chromosomes did not affect Al uptake of the tolerant lines. The improved tolerance conferred by chromosome E was attributing to improved cell membrane integrity. Chromosome engineering with these two lines could produce Al- tolerant wheat cultivars.
11 1.2 Introduction
Wheat (Triticum aestivum) is the major staple food crop in many parts of the world.
Aluminum (Al) toxicity is the key factor limiting its production in acidic soils, which represent 40% of the world’s cultivated land (Kochian 1995). Concentrations of soluble Al can reach up to 30 ppm in acidic soils with pH values below 5.5 (Evans and Kamprath 1970).
The exact mechanisms of Al toxicity are still not well understood. Al reduces root cell wall extensibility (Ma et al. 2004) and blocks Ca2+ channels of wheat root cell plasma membranes (Huang et al. 1992); it causes membrane damage and peroxidation of membrane lipids (Cakmak and Horst 1991, Wagatsuma et al. 1995). Al affects signal transduction pathways (Jones and Kochian 1997), blocks symplastic transport and communication in wheat roots by inducing callose deposition (Sivaguru et al. 2000), and causes mitochondrial dysfunction by triggering the production of reactive oxygen species in pea roots (Yamamoto et al. 2002).
Plants have developed strategies for detoxifying Al both externally and internally.
Several mechanisms for external detoxification have been proposed (Kochian et al. 2004, Ma 2007, Poschenrieder et al. 2008). The most well studied is the secretion of organic acid anions, including citrate, oxalate, and malate, from the roots (Ma et al. 2001, Kochian et al.
2004). These anions chelate Al externally, preventing it from binding to root cells (Ma 2000). Genes encoding transporters for the Al-induced secretion of malate and citrate have been identified in many plants, including wheat malate transporter (ALMT1) (Ryan and Delhaize 2010). In some species such as buckwheat and hydrangea, internal detoxification
12
of Al is achieved by chelation with oxalate and citrate, respectively, and sequestration (Ma et al. 1997a, b, 2001). In Arabidopsis, the half-size ABC transporter ALS1 is implicated in Al sequestration (Larsen et al. 2007). OsALS1 plays a crucial role in internal detoxification of Al and tolerance in rice (Huang et al. 2012).
Soil liming is used widely to raise soil pH and prevent Al toxicity, but its high cost and other effects on soil properties make the use of tolerant cultivars a more cost-effective and environmentally friendly solution. Significant improvements in the Al tolerance of wheat have been achieved by conventional breeding methods, but the genetic variation of this tolerance in wheat is limited. Within the wild members of the tribe Triticeae, higher levels of tolerance have been identified in the Aegilops uniaristata (2n = 2x = 14, NN) (Berzonsky and Kimber 1986) and introduced successfully into wheat (Miller et al. 1997).
Due to the importance of Leymus species generally and L. racemosus particularly as novel sources for many economically important traits this study was intended to investigate the effect of Leymus-derived chromosomes (thereafter designated as Leymus added chromosomes) on wheat Al tolerance. This study describes the effect of L. racemosus added chromosomes on wheat Al tolerance and the identification of two lines with enhanced Al tolerance.
1.3 Materials and methods
1.3.1 Plant materials and growing conditions
I studied 13 wheat-L. racemosus addition and 2 wheat-L. racemosus substitution lines (Table 1-1), in addition to 15 addition lines harbor the homoeologous group 2 (HG 2) chromosomes from 11 species: L. mollis (2 lines), Aegilops longissima (2 lines), Ae.
13
geniculata (2 lines), Ae. peregrina (2 lines), Ae. umbellulata (1 line), Ae. searsii (1 line), Agropyron elongatum (1 line), Hordeum chilense (1 line), Secale cereale (1 line), Elymus ciliaris (1 line) and Psathyrostachys huashanica (1 line). These lines and their wheat recipient cultivar ‘Chinese Spring’ (CS) were provided by the Tottori Alien Chromosome Bank of Wheat (TACBOW) supported by National BioResource Project–Wheat.
The seeds of all lines were surface-sterilized in sodium hypochlorite solution (1.2%
v/v) for 10 min. After several washes with deionized water, the seeds were soaked in distilled water for 12 h and then transferred to Petri dishes to germinate in the dark for 24 h.
The germinated seeds were transferred to a mesh floating on aerated 200 µM CaCl2
solution (pH 4.6) in 20-L plastic containers. All experiments were carried out in a glasshouse at the Arid Land Research Center (Tottori, Japan; 35°32N, 134°13E) at a constant 22 °C under natural light during winter. Three-day-old seedlings of uniform length were used to determine the best Al concentration for the evaluation of the addition lines, whereas four-day-old seedlings were used for other experiments. In all treatments, a solution of 200 µM CaCl2 was used as a background electrolyte. During the experiment, the solutions were adjusted to pH 4.6 and renewed daily.
1.3.2 Evaluation of Al tolerance
The primary lengths of the longest root of each 4-day-old seedling was measured, then seedlings were placed in 0 (control) or 25 µM AlCl3·6H2O culture solution. After 48 h, the longest root on each plant was measured again, and the net root growth per plant was calculated. Root growth was expressed as relative root growth (RRG) = 100 (RGal/RGc),
14
where RGal represent the net root growth with Al treatment and RGc represent net root growth without Al.
In the dose response experiment, 4-day-old seedlings were exposed to 0, 50, 100, or 200 µM AlCl3·6H2O for 48 h, and then the roots were measured as above for calculation of RRG. In the prolonged effect experiment, seedlings were exposed to 10 µM AlCl3·6H2O for 5 days. Roots were measured and RRG was determined for every 24-h period as above.
1.3.3 Aluminum distribution in root tissues
Localization of Al in root tips was determined by staining with Morin (Sigma-Aldrich, St. Louis, MO, USA), which is used widely to detect the presence and distribution of Al in root tissues (Tice et al. 1992). After exposure to 0 or 25 µM AlCl3·6H2O for 48 h, root tips (1 cm) were excised, washed for 10 min in 5 mM NH4OAc buffer (pH 5), stained in 100 µM Morin in 5 mM NH4OAc buffer (pH 5) for 1 h, and washed again in NH4OAc buffer for 10 min. The stained root tips were examined under an Olympus BX51 microscope (Olympus, Tokyo, Japan) equipped with a BP 400–440-nm excitation filter and an LP 470- nm barrier filter. Fifteen root tips from five seedlings in each treatment were examined, and the experiment was repeated three times.
1.3.4 Determination of aluminum contents in roots
Al content in root tips was determined according to Osawa and Matsumoto (2001).
Excised 1-cm root tips (20 mg) were placed in a microcentrifuge tube (1.5 mL) containing 1 mL of 2 M HCl. The tubes were placed on an orbital shaker at 10 rpm for 24 h to release the Al from the root apices. After dilution, the Al content in the HCl solution was determined by atomic absorption spectrophotometry (AA-6800, Shimadzu, Kyoto, Japan).
15 1.3.5 RT- PCR analysis
Total RNA was extracted from the roots of Al treated and non-treated seedlings after 48 h of 25µM Al treatment using TriPure isolation reagent (Roche, Mannheim, Germany), following the manufacturer instructions. RNA was treated with RNase-free DNase 1 (Takara, Ohtsu, Japan) to remove any genomic DNA. 1 µg RNA was used to synthesize first strand cDNA using Transcriptor first strand cDNA synthesis Kit (Roche). The first strand cDNA (50 ng) was used for the PCR using primers 5'-CGTGAAAGCAGCGGAAA- GCC-3' and 5'-CCCTCGACTCACGGTACTAACAACG-3' for amplification of the ALMT1 transcript (Raman et al. 2005), and primers 5'-TCAACGAGGAATGCCTAG- TAAGC-3' and 5'-ACAAAGGGCAGGGACGTAGTC-3’ for the amplification of the ribosomal 18S gene as internal control gene (Fontecha et al. 2007). The PCR conditions were initial denaturation at 95 °C for 5 min followed by 35 cycles at 94 °C, 58 °C and 72 °C for 30 seconds each then final extension step at 72 °C for 7 minutes. Additionally, we examined the expression patterns of some genes associated with wheat Al tolerance including citrate transporter, ent-kaurenoic acid oxidase (KAO1), P450 monooxygenase CYP72A26, beta-glucosidase aggregating factor, lipid transfer protein-like protein 1 (Table 1-2).
1.3.6 Evaluation of the tolerance to long-term Al toxicity
Based on the above experiments, 2 tolerant addition lines and CS were selected for further evaluation. Seeds were sterilized, soaked and germinated as described above. One- week-old uniform seedlings were transplanted to 20 L containers containing 15 L of 1/8 strength Hoagland solution (pH 4.6) in which the phosphate strength was 1/16. On the 4th
16
day after transplanting, two treatments were established: Control (1/8 Hoagland solution, pH 4.6), and Al solution (1/8 strength Hoagland solution containing 300 µM Al, pH 4.6).
The solution was changed daily, and its pH was adjusted to 4.6. After 15 days of treatment, numbers of tillers per plant (TP), chlorophyll content (ChC), root dry weight (RDW), shoot dry weight (SDW), root Al content and shoot Al content were measured. Chlorophyll content was estimated on the upper most expanded leaves using a chlorophyll meter SPAD- 502 (Konica Minolta, Japan). Plants were harvested, dried at 60ºC for 3 days then SDW and RWD were measured. For evaluation of Al tolerance the resistance integrated score formula used by Dai et al. (2011) to evaluate the Al resistance of wild barley germplasm exposed to 100 µM Al for 15 days was adopted: Resistance integrated score = absolute value of (SPAD value x 0.2 + tillers/ plant x 0.2 + shoot dry weight x 0.2 + root dry weight x 0.2).
Al was extracted from 100 mg dry root or shoot tissues from the Al treated plants as described by (Yin et al. 2010). The Al concentration was measured by an inductively coupled plasma atomic emission spectrometer (ICP-AES, Ciros CCD, Rigaku, Japan).
1.3.7 Visualization of lipid peroxidation
Aldehydes, products of lipid peroxidation were detected histochemically by Schiff’s reagent (Yamamoto et al. 2001). Root tips exposed to 0 or 25 µM AlCl3·6H2O for 48 h were excised and stained immediately in Schiff’s reagent (Wako, Osaka, Japan) for 20 min and then rinsed with a freshly prepared sulfite solution (0.5% w/v K2S2O5 in 0.05 M HCl).
The root tips were kept in the sulfite solution until observation under a light stereomicroscope (Olympus SZX16).
17 1.3.8 Plasma membrane integrity assay
Electrolyte leakage was used as an indicator of the loss of plasma membrane integrity (Singh et al. 2007). Root tips (20 mm) exposed to 0 or 25 µM Al for 24 or 48 h were incubated in distilled water at 25°C for 2 h in tubes, and then the electrical conductivity (EC1) of the medium was measured using Horiba B-173 conductivity meter (Horiba, Kyoto, Japan). The tubes containing the root material were then boiled for 30 min to release all the electrolytes, and cooled at room temperature to 25°C before the final electrical conductivity (EC2) measurement. Electrolyte leakage was calculated as 100 × [1-(EC1/EC2)].
1.3.9 Visualization of plasma membrane integrity
Root tips exposed to 0 or 25 µM Al for 48 h were excised and stained immediately in aqueous Evans blue (Sigma-Aldrich) solution (0.025% w/v) for 10 min (Yamamoto et al.
2001). Stained roots were washed three times with distilled water, after which the dye no longer eluted from the roots. Intact stained roots were observed under a light stereomicroscope (Olympus SZX16). Fifteen roots from five seedlings in each treatment were examined, and the experiment was repeated three times.
1.3.10 H2O2 detection and determination
The distribution of H2O2 in the root tips was detected by the florescent dye 2,7- dichlorofluorescein diacetate, DCF-DA (Wako Pure Chemical, Osaka, Japan) as described by (Jones et al. 2006). Root tips exposed to 25 µM Al for 48 h were excised and placed into a solution containing 200 mM CaCl2 (pH 4.6) and 10 mM DCF-DA for 15 min, then DCF- DA fluorescence was detected under an Olympus BX51 microscope (excitation 488 nm, emission 530 nm).
18 1.3.11 Statistical analyses
In each experiment, fifteen replicated seedlings were used for each line and each experiment was conducted twice. All values are shown as means ± the standard error of the mean (SEM). Data were analyzed by analysis of variance (ANOVA) followed by Fisher’s protected least significant difference (PLSD) test at P <0.05. Statistical analysis was performed with StatView software v. 5.0.1 (SAS Institute, Inc., USA).
1.4 Results
1.4.1 Effect of aluminum on root growth
To identify the best concentration to screen the addition lines, I examined the Al tolerance of the moderately Al-tolerant CS (Aniol 1990) at 0, 25, 50, 100, 200, and 400 µM Al for 48 h. Relative root growth (RRG) decreased with increasing Al concentration. To screen the addition lines, we selected 25 µM, which reduced the RRG of CS by about 50%
(Fig. 1-1A).
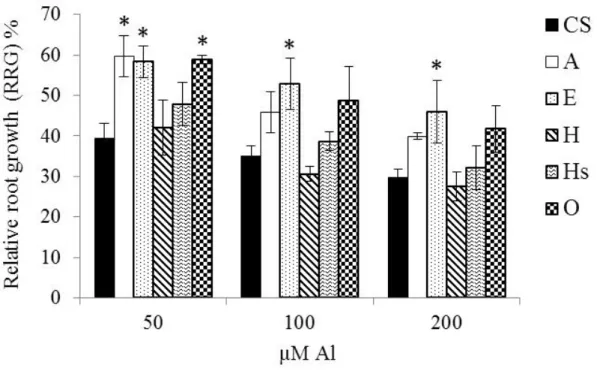
In the screening of wheat-Leymus racemosus addition lines at 25 µM Al for 48 h, addition lines A, E and O showed better tolerance to Al in term of significantly (P<0.05) higher RRG compared to CS (Fig. 1-1B). Addition lines A, E and O had 94, 77 and 79%
RRG, respectively, compared to only 57% in CS (Fig. 1B, C). On the other hand, the RRG of lines H, N, R, and S was significantly lower than that of CS (Fig. 1-1B).
The three addition lines (A, E and O) showing the highest RRG, one addition line (Hs) comparable to CS and one line (H) exhibiting low RRG were selected and evaluated in dose response experiment to confirm the tolerance of A, E and O, and to determine to which level those lines can tolerate Al toxicity. After exposure to 50, 100, or 200 µM Al for
19
48 h, RRG was highest in lines A, E and O, and lowest in lines H, N and Hs (Fig. 1-2). At 50 µM Al, RRG was significantly higher in A, E, and O than in CS. At 100 and 200 µM Al, only in E it was significantly higher than in CS; at 200 µM Al, RRG was 17% higher in E than in CS.
Lines A and O are phenotypically similar in heading and maturity time, root characteristics, and seed shape (data not shown). As these two lines harbor the same HG 2 chromosome of L. racemosus (Larson et al. 2012), I selected A and E for further characterization.
To examine the effect of low Al concentration for longer treatment time, CS, A and E were evaluated under 10 µM Al for 5 days. After 1 day in 10 µM Al, RRG was enhanced in all 3 genotypes, with greater enhancement observed on lines A and E (Fig. 1-3). On day 2, RRG had declined slightly in CS, whereas line E maintained its growth enhancement, and line A maintained a small advantage. On day 3, RRG had declined by 24% in CS, while no reduction was apparent in lines A and E. On days 4 and 5, although their root growth was reduced relative to the control, RRG in lines A and E remained 20% and 15% higher, respectively, than that in CS. Throughout the 5-day experiment, the addition lines maintained significantly (P<0.05) higher RRG compared to CS, except on day 2, when line A was comparable to CS.
To know the effect of other alien chromosomes belonging to HG 2 on Al tolerance, the 15 HG 2 chromosome addition lines were tested at 25µM Al. The result indicated that all the tested lines had RRG comparable to CS, and none of the added chromosomes form the 11 species enhanced or reduced the tolerance of CS (Fig. 1-4).
20
1.4.2 Al content and localization in the root tips, and ALMT1 expression
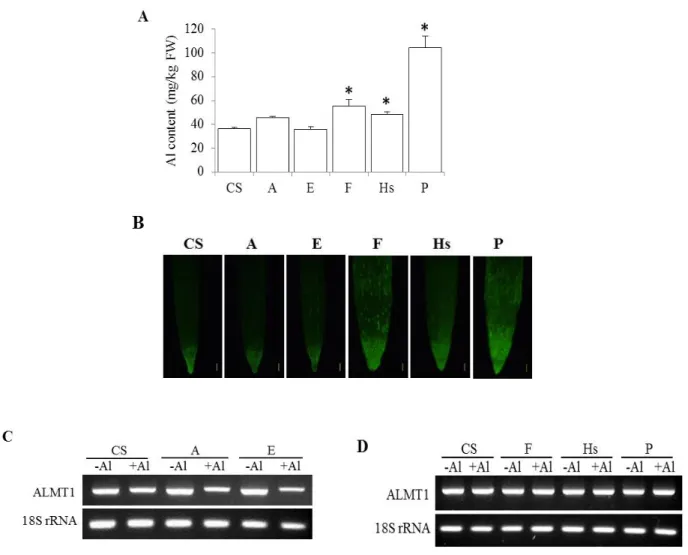
To investigate whether the enhancement of Al tolerance in the addition lines was associated with an increased ability to exclude Al from the root tips, the Al contents were determined in the root tips of CS, A, E, F, Hs and P. Significantly (P<0.05) higher Al contents were detected in root tips of lines F, Hs and P (Fig. 1-5A). In contrast, addition lines A and E accumulated similar amounts of Al as CS. Staining with the highly Al- sensitive fluorescent dye Morin (Tice et al. 1992) confirmed that CS and lines A and E accumulated the similar amounts of Al (Fig. 1-5B).
As there is no sequence information available for L. racemosus to enable the detection of the expression of Al tolerance genes, the expression of some wheat Al tolerance-related genes was examined to investigate the effect of the added chromosomes on the expression of those genes. While no difference on the expression of ALMT1 was detected in CS, a reduced expression upon Al treatment was observed on addition lines A and E (Fig. 1-5C). In contrast, lines F, Hs and P showed the same level of expression of CS (Fig. 1-5D). The expression of other Al tolerance related genes were examined in CS, A, and E, and the results indicated that the three lines had comparable expression levels.
1.4.3 Long term effect of aluminum
To test the suitability of using these lines for breeding, CS and addition lines A and E were selected and the effects of Al on different plant growth parameters evaluated.
Although treatment with 300 µM Al for 15 days resulted in a reduced chlorophyll contents in all tested lines, addition lines A and E suffered significantly (P<0.05) less percentage reduction on chlorophyll contents compared to CS (Table 1-3). Line E had lower reduction
21
in the number of tillers per plant compared to line A and CS. No significant differences were observed in SDW and RDW between both addition lines and CS. The resistance integrated score was calculated as an indication of Al tolerance. The two addition lines had significantly higher integrated score than CS (Table 1-3). No significant differences were observed in Al contents in the roots of the addition lines and CS, whereas, line E accumulated significantly higher Al content in the shoots compared to CS and line A. Line E accumulated 1.36 and 1.5 fold Al than line A and CS, respectively.
1.4.4 Assessment of cell membrane integrity, cell viability, lipid peroxidation, and H2O2
accumulation and distribution
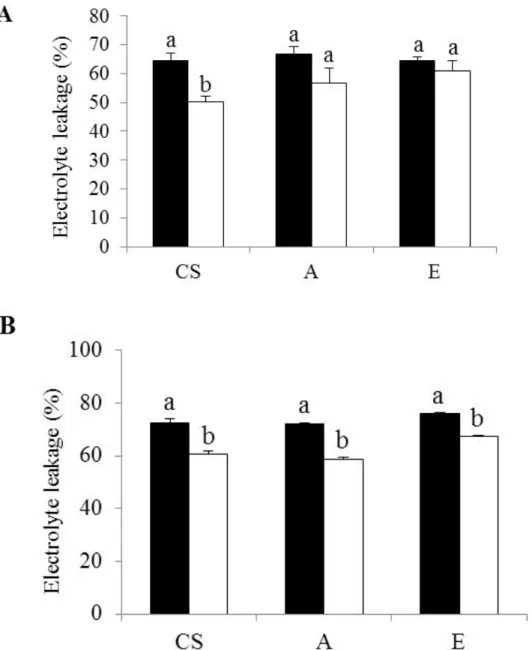
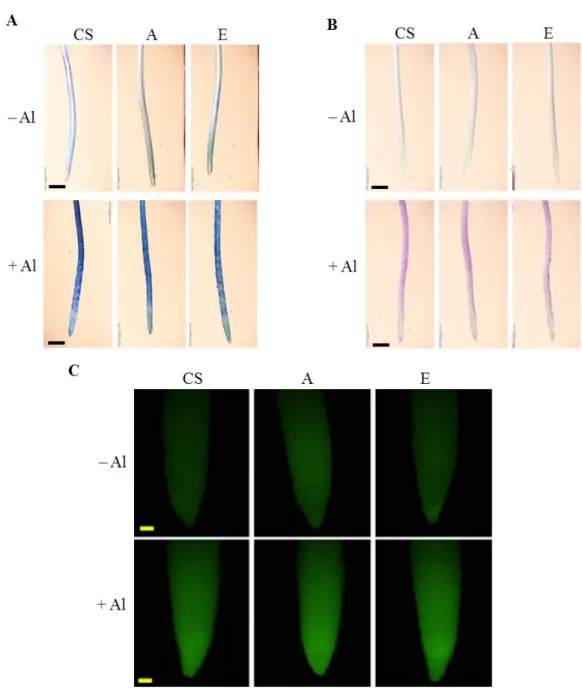
I examined the cell membrane integrity of CS, lines A, and E by detecting the amount of ion leakage. Treatment with 25 µM Al for 24 h reduced the cell membrane integrity of CS significantly, but not that of lines A and E (Fig. 1-6A). Treatment for 48 h reduced the integrity in the three lines significantly, by 35% to 47% (Fig. 1-6B). Addition line E had the lowest reduction in cell membrane integrity whereas A had the highest reduction in cell membrane integrity compared to CS. The result of the 48 h treatment is consistent with staining with Evans blue, which detects the magnitude of cell death: The root tips of the seedlings grown without Al did not absorb the dye, indicating no damage in the root cells (Fig 1-7A). On the other hand, the root tips of the seedlings treated with 25 µM Al for 48 h were affected by Al. The magnitude of the damage was similar in all tested lines.
Lipid peroxidation was evaluated using Schiff reagent. No Schiff staining was detected in plants grown without Al. After 48 h of Al treatment, no clear differences in the accumulation of aldehydes were observed in the elongation zone of lines A, E and CS (Fig.
22 1-7B).
DCF-DA staining indicates that line A slightly accumulated more H2O2 than CS and line E when grown without Al (Fig 1-7C). In the presence of Al, the amount of H2O2 was increased in all lines with no clear differences in H2O2 accumulation between the three lines. These results reveal no differences between the addition lines and CS in lipid peroxidation and oxidative stress. Line E had the highest cell membrane integrity, and CS and line A were comparable to each other.
1.5 Discussion
1.5.1 Effect of L. racemosus chromosomes on root elongation under Al stress
Reduction of root elongation is the first visible symptom of Al toxicity and can be used to examine Al sensitivity among genotypes (Sasaki et al. 1994). Chromosome addition lines A and E showed the best Al tolerance in term of higher RRG in these lines compared to CS under all tested Al concentrations. At 25 and 50 µM Al, line A performed better than line E (Figs. 1-1B and 1-2), while at higher concentrations tested, E performed better (Fig. 1-2). Kinraide (1993) concluded that low concentrations of Al often enhance root growth in wheat, and the magnitude of the enhancement is correlated with the level of Al tolerance. At the lowest Al concentration (10 µM) tested in this study, RRG in the two addition lines was enhanced on days 1 and 2 of the treatment, and in CS on day 1 only;
RRG in CS started to decline from day 2 (Fig. 1-3). Therefore, this result could be considered as an evidence for the tolerance of lines A and E.
Both lines A and O seemed to harbor the same homologous chromosome of L.
racemosus (Larson et al. 2012). However, line A was developed by Kishii et al. (2004) in
23
Japan, whereas line O was developed by Qi et al. (1997) using different L. racemosus strain in China. The tolerance of line A at 25 µM Al was better than that of line O, despite the similarity of their phenotype, root characteristics, seed shape, and days to heading and maturity. This concludes that the difference of Al tolerance is attributable to the allelic differences in the L. racemosus strains used to develop the addition lines. Line T is a substitution line including the same L. racemosus chromosome as A and O in place of wheat chromosome 2B (Qi et al. 1997). Firstly it was assumed that it would show similar tolerance as lines A and O, however, it exhibited the same level of tolerance as CS, perhaps owing to the absence of chromosome 2B. Gustafson and Ross (1990) studied the effect of wheat chromosomes arms on the expression of Al tolerance using hybrids between Al tolerant rye and ditelocentric lines of CS. They concluded that the tolerance of rye when expressed in wheat was evidently under the influence of genes located on a number of wheat chromosomes, and that the absence of some chromosome arms allowed the expression of tolerance, and the absence of other chromosome arms hindered it.
Accordingly, the result suggests the importance of wheat chromosome 2B in the expression of the Al tolerance of L. racemosus chromosome A.
The RRG was significantly lower in lines N, R, H and S than in CS (Fig. 1-1B), indicating that their introgressed chromosomes reduced the tolerance to Al in a wheat background and these chromosomes has inferior effect. The rest of the addition lines had the same level of tolerance as CS indicating that the added chromosomes do not have an effect on the Al tolerance.
The Al-tolerance-related genes in CS are located on chromosome arms 6AL, 7AS,
24
2DL, 3DL, 4DL, and 4BL and on chromosome 7D (Aniol and Gustafson 1984, Papernik et al. 2001). Considering the synteny between L. racemosus and wheat chromosomes (Qi et al. 1997, Kishii et al. 2004), I expected the presence of some tolerance genes in lines A (HG 2), F (HG 4), H (HG 3), K (HG 6), N (HGs 3, 7), O (HG 2), and T (HG 2). Kishii et al. (2004) could not assign chromosome E to any group, as only one marker present on HG 4 was available. These results indicate that only lines A and O both belonging to HG 2 were tolerant. Fifteen addition lines from 11 species all of which harbor HG 2 chromosomes were screened for Al tolerance and none of them possess tolerance to Al. This result indicates that the tolerance of lines A and O is not due to genetical imbalance by presence of extra HG 2 chromosomes but due to specific gene(s) on L. racemosus chromosomes.
Additionally, the addition line of L. mollis, a related species of L. racemosus, did not show any tolerance despite their similar morphology. This finding also indicates that the Al tolerance of lines A and O is due to specific gene(s) on the L. racemosus chromosomes.
1.5.2 Effect of L. racemosus chromosomes on Al accumulation
Quantification of Al after 48-h and after 15-days Al treatments indicated that lines A and E accumulated the same amount of Al as CS (Fig. 1-5A, B; Table 1-3). So the mechanism behind the tolerance of lines A and E must not rely on enhanced ability of Al exclusion from the root tips. The expression of the ALMT1 was not induced by Al treatment in CS and was down regulated in the addition lines A and E. Using RT-PCR analysis Fontech et al. (2007) reported that the expression of ALMT1 is not induced by Al in CS.
Sasaki et al. (2004) and Raman et al. (2005) also reported that tolerant wheat genotypes Atlass 66, ET8 and CS express ALMT1 constitutively and are not affected by Al. Ryan et
25
al. (1995) mentioned that the Al tolerance in wheat is strongly correlated with the capacity for Al-activated malate efflux. These results and the results of Al accumulation suggest presence of another mechanism operating in the addition lines and maintaining the same amount of Al in the roots. Ryan et al (2009) indicated that the tolerance of wheat cultivar Carazinho relied on constitutive efflux of citric acid. Yang et al. (2011) reported that the rhizosphere pH regulation by plasma membrane H+- ATPase was associated with the relative root elongation and Al content in root apex of tolerant cultivar ET8. In rice the cell wall polysaccharides were responsible for Al exclusion from the root tips of cultivar Nipponbare (Yang et al. 2008). In buckwheat higher levels of Al-phosphate complexes might be presented in the apoplast of the Al-tolerant cultivar, suggesting a novel mechanism of Al exclusion from the cytoplasm (Zheng et al. 2005).
After 15 days of Al treatment, line E translocates the highest amount of Al to the shoots than CS and A (Table 1-3). The amount of Al translocated to the shoots is 102 mg kg-1 DW. According to Foy (1984), Al accumulator plants have been defined as they accumulate more than 1000 mg kg-1 Al in leaves. Therefore we conclude that the enhanced tolerance of line E is not associated with Al accumulation in the shoot parts.
Several studies have reported a positive correlation between ALMT1 expression and Al tolerance. Enhanced ALMT1 expression results in reduced Al accumulation (Sasaki et al.
2004, Raman et al. 2005). Lines F, Hs and P accumulated more Al than CS (Fig. 1-5A, B), but they exhibited similar ALMT1 expression (Fig. 1-5D) and comparable Al tolerance to that found in CS (Fig. 1-1B). These results suggest the presence of other Al tolerance mechanism in these addition lines.. In buckwheat and hydrangea, Al is chelated internally
26
by oxalate and citrate, respectively (Ma et al. 1997a, b, 2001). A half-size ABC transporter ALS1 is implicated in Al sequestration in Arabidopsis (Larsen et al. 2007) and rice (Huang et al. 2012). Regulation of hormonal equilibrium in plants by nitric oxide has been suggested to enhance Al tolerance (He et al. 2012).
No differences were detected between CS and lines A and E in cell death, lipid peroxidation and H2O2 distribution and accumulation. These results indicate that the tolerance of addition lines A and E is not due to enhanced capacity to mitigate the oxidative stress caused by the Al treatment.
In conclusion the addition of L. racemosus chromosomes A, O and E to wheat enhanced the tolerance to Al, whereas the addition of chromosomes N, R, and S reduced the tolerance, and the addition of the rest of the chromosomes did not affect the tolerance.
In the case of chromosome A, the mechanism remained to be clarified in details in future studies. In the case of chromosome E, it might be increased cell membrane integrity (Fig. 1- 6). Wide hybridization and chromosome engineering with these two addition lines could produce more Al-tolerant wheat cultivars. This work should be continued to clarify the mechanism behind the Al tolerance in lines A and E. Deletion mapping should be carried out and translocated lines should be produced to facilitate the transfer of chromosome parts that confer Al tolerance to wheat.
27
Table 1-1. List of the wheat-Leymus racemosus chromosome addition lines and their chromosomes names and homoeologous groups.
aTACBOW: Tottori Alien Chromosome Bank of Wheat supported by NBRP-wheat; bND, not determined.
Strain ID Strain name and chromosome name
Homoeologous group
Number of chromosomes
Designation in this experiment
Reference
TACBOW0001 a Leymus racemosus A addition 2 44 A Kishii et al. 2004
TACBOW0003 L. racemosus E addition ND b 44 E Kishii et al. 2004
TACBOW0004 L. racemosus F addition 4 44 F Kishii et al. 2004
TACBOW0005 L. racemosus H addition 3 44 H Kishii et al. 2004
TACBOW0006 L. racemosus I addition 5 44 I Kishii et al. 2004
TACBOW0008 L. racemosus k addition 6 44 K Kishii et al. 2004
TACBOW0009 L. racemosus l addition 2 44 L Kishii et al. 2004
TACBOW0010 L. racemosus n addition 3,7 44 N Kishii et al. 2004
TACBOW0011 L. racemosus H substitution 3 42 Hs Kishii et al. 2004
TACBOW0012 L. racemosus 2Lr#1 addition 2 44 O Qi et al. 1997
TACBOW0013 L. racemosus 5Lr#1 addition 5 44 P Qi et al. 1997
TACBOW0014 L. racemosus 7Lr#1 addition 7 44 Q Qi et al. 1997
TACBOW0015 L. racemosus 7Lr#1 addition 7 44 R Qi et al. 1997
TACBOW0016 L. racemosus ?Lr#1 addition ND 44 S Qi et al. 1997
TACBOW0017 L. racemosus 2Lr#1 substitution 2 42 T Qi et al. 1997
28 Table 1-2. Oligonucleotide sequences used for RT-PCR in this study
Sequence
Gene Forward Reverse Reference
Citrate transporter GATTGCCGCGACCTCTCGTGTT GATGCCGTCGAACACGAACG Ryan et al. 2009
Cytochrome P450-like protein CAAGCTCGTCATTCTCCACCTC CGAAGTTGACCAAGATGGAATACTG Guo et al. 2007 Ent-kaurenoic acid oxidase,
KAO1 GGCTACACCATACCGAAGGGA CTATCAGGATTGAAGGAGAGAGGATC Guo et al. 2007
P450 monooxygenase
CYP72A26 GTATGTGGCGCATGAGTATACGAC GGTCAGAATTTTGCACTGCTTG Guo et al. 2007
Beta-glucosidase aggregating
factor AATAACTGGGCCATAGTTGATGC TAATAGCCAACACTTGGTTGATCAG Guo et al. 2007
Lipid transfer protein-like
protein 1 CTGTTACAGTTCGTATGTCAGGCG CCATAACAGGATACAATGACATTGATC Guo et al. 2007
29
Table 1-3. Percent reduction from control in various growth parameters of CS and addition lines A and E grown for 15 days at 300 µM Al.
% Reduction from control
Al contents (mg kg-1 DW)
ChC a TP SDW RDW RIS Root Shoot
CS 35 ± 3.2 33 ± 4.2 34 ± 2.8 -0.05 5.8 ± 0.1 4911 ± 172.6 67 ± 4.4 A 20 ± 1.0* 32 ± 0.2 37 ± 3.4 0.02 6.7 ± 0.1* 4661 ± 122.5 75 ± 5.9 E 21 ± 1.9* 27 ± 7.8 39 ± 6.4 -0.03 6.6 ± 0.05* 5159 ± 126.9 102 ± 10
a ChC, chlorophyll content; TP, tiller number per plant; SDW, shoot dry weight; RDW, root dry weight; RIS, resistance integrated score. Values are presented as means ± SEM (n=2);
each replicate included 7 replicated seedlings. Asterisks indicate the significant difference from CS (P <0.05).
30
31
Fig. 1-1. Effect of Al on root growth of CS and Leymus racemosus chromosome addition lines. (A) The effect of different concentration of Al in relative root growth (RRG) of CS.
Seedlings were exposed to 0, 25, 50, 100, 200, 400 µM Al for 48 h. Values are the mean of 10 replicated seedlings and the vertical bars represent the SEM. (B) Relative root growth (RRG) of CS and addition lines grown in 25 µM Al for 48 h. Values are means ± SEM (n = 2) of growth with Al over growth without Al; each replicate included 15 seedlings.
Asterisks indicate significant differences from CS (P<0.05, Fisher’s PLSD test). (C) Sensitivity of CS and lines A and E to 25 µM Al for 48 h. Scale bar = 5 mm.
32
Fig. 1-2. Dose response evaluation of relative root growth (RRG) of CS and selected addition lines. Seedlings were exposed to 50, 100, or 200 µM Al for 48 h. Values are means
± SEM (n = 2); each replicate included 12 seedlings. Asterisks indicate significant differences from CS (P<0.05, Fisher’s PLSD test).
33
Fig. 1-3. Time course of effects of Al on CS and addition lines A and E. Seedlings were exposed to 10 µM Al for 5 days and the relative root growths were measured daily. Values are means ± SEM (n = 15) of the relative root growth (RRG) for each 24-h period. P<0.05, Fisher’s PLSD test.
Fig. 1-4. Effects of Al on CS and HG2 addition lines exposed to 25 µM Al for 48 h. Values are means ± SEM (n = 2) each replicate included 10 seedlings. P<0.05, Fisher’s PLSD test.
0 10 20 30 40 50 60 70
Relative root growth (RRG)
34
Fig. 1-5. Al accumulation and ALMT1 expression in the roots. (A) Al content of CS and selected addition lines exposed to 25 µM Al for 48 h. Values are means ± SEM (n = 3).
Asterisks indicate significant differences from CS (P<0.05, Fisher’s PLSD test). (B) Al localization in root tips of CS, A, E, F, Hs and P. The roots were stained with Morin following exposure to 25 µM Al for 48 h. Bars = 200 µm. (C, D) RT-PCR analysis of ALMT1 expression in the roots of CS, A, E, F, Hs and P non- exposed and exposed to 25 µM Al for 48 h. (Top) expression of ALMT1. (Bottom) expression of ribosomal 18S RNA gene used as internal control.
35
Fig. 1-6. Electrolyte leakage, indicator of the loss of plasma membrane integrity, of the roots of CS, A, and E after (A) 24 h and (B) 48 h at 0 (dark bars) or 25 µM Al (white bars).
Values are means ± SEM (n = 4). Each replication included 4 replicated seedlings. Means with different letters differ significantly (P<0.05, Fisher’s PLSD test).
36
Fig. 1-7. Cell death, lipid peroxidation and distribution, and accumulation and distribution of H2O2 in root tips of CS, A, and E seedlings exposed to 25 µM Al for 48 h. Stained with (A) Evans blue to detect cell death, (B) Schiff’s reagent to detect lipid peroxidation, or(C) DCF-DA to detect H2O2. Bars = 1 mm (A, B) or 200 µm (C).
37
Chapter 2
Impact of wheat-Leymus racemosus added chromosomes on wheat adaptation and tolerance to heat stress
2.1 Abstract
Adaptation of wheat (Triticum aestivum L.) to high temperatures could be improved by introducing alien genes from wild relatives. The responses of wheat-Leymus racemosus chromosome introgression lines to high temperature were examined to determine their potentiality for developing improved wheat cultivars. Introgression lines and their parent Chinese Spring were evaluated in a growth chamber at the seedling stage and in the field at the reproductive stage in two heat-stressed environments in Sudan. Optimum and late planting were used to ensure exposure of the plants to heat stress at the reproductive stage.
The results revealed the impact of several Leymus chromosomes in improving wheat adaptation and tolerance to heat. Three lines possessed enhanced adaptation, whereas two showed high heat tolerance. Two addition lines showed a large number of kernels per spike, 32while one possessed high yield potential. Grain yield was correlated negatively with the heat susceptibility index, days to heading and maturity, and positively with kernel number per spike and triphenyl tetrazolium chloride assay under late planting. The findings suggest that these genetic stocks could be used as a bridge to introduce the valuable Leymus traits into a superior wheat genetic background, thus helping maximize wheat yield in heat- stressed environments.
38 2.2 Introduction
Wheat is the most important staple food for the majority of the world’s population.
Due to the current rapid exponential growth of the world population, an urgent expansion of the wheat production area and an increase in wheat productivity by unit area is therefore needed. Biotic and abiotic stresses and nutrient deficiencies are the biggest constraints of crop production.
Heat stress is considered one of the major factors limiting wheat production in tropical and subtropical environments. In these areas, high temperatures are known to affect crop development at all stages, imposing morphological and physiological changes that result in considerable grain yield loss (Al-Khatib and Paulsen 1990, Tahir et al. 2005, 2006, Tewolde et al. 2006). The optimum temperature for wheat growth and yield is within the range 18–24ºC. Stone and Nicolas (1994) reported that even a short period (5–6 days) of exposure to temperatures of 28–32ºC can result in significant decreases in yield of 20% or more. All plant processes are sensitive to and can be irreversibly damaged by heat. Elevated temperatures accelerate senescence, diminish the viable leaf area duration and reduce photosynthetic activities (Harding et al. 1990, Nagarajan et al. 1998). Heat stress also affects thylakoid membranes and leads to a loss in the number of chloroplasts per cell (Hurkman and Tanaka 1987). Accordingly, development of heat-tolerant cultivars is of major concern in wheat breeding programs.
Yield and its components are used widely as criteria for determining the heat tolerance of wheat (Reynolds et al. 1994, Khana-Chopra and Viswanathan, 1999).
Although expensive to obtain, they are crucial measures of productivity in stressful
39
environments and highly applicable for comparing cultivars (Reynolds et al. 1994, Hede et al. 1999). Chlorophyll content (Alkhatib and Paulsen 1990), chlorophyll fluorescence (Smillie and Hethering 1983, Moffate et al. 1990) and triphenyl tetrazolium chloride cell viability assay (Porter et al. 1994) are among the physiological parameters used widely to evaluate heat stress tolerance in wheat.
The production and release of modern wheat cultivars after the green revolution enabled the expansion of wheat production in areas that experience heat stress, such as West Asia and North Africa. Despite the success of these cultivars, we remain far from solving the global food problem. To achieve a breakthrough in wheat breeding for stress tolerance and nutrient deficiency, development of new technologies and ideas is required.
One of the possible ways is to discover and explore novel genes existed within the wheat gene pool, especially, the wild wheat relatives proved to be valuable gene sources for several important traits and contribute to increasing the available genetic diversity for development of new cultivars.
Due to the importance of Leymus as a novel source of useful traits, this study aimed to determine the response of wheat-Leymus racemosus introgression lines to heat stress and examine their potentiality to develop improved cultivars. The results indicated the presence of genotypic variability within addition lines for heat stress tolerance and revealed the potentiality of utilization of the genetic stocks identified in this study for improving wheat adaptation and heat stress tolerance.
2.3 Material and methods 2.3.1 Plant materials
40
I examined 12 wheat–Leymus racemosus chromosome additions and two substitution lines in the background of wheat cultivar Chinese Spring (CS) and their wheat background CS (Table 2-1). Hereafter the addition and substitution lines are designated together as
‘introgression lines’. All lines and their wheat parent CS were provided by the Tottori Alien Chromosome Bank of Wheat (TACBOW) supported by National BioResource Project–
Wheat, NBRP-wheat.
2.3.2 Growth chamber evaluation
The growth chamber experiment was carried out in a chamber in the Arid Land Research Center, Tottori, Japan. The seeds listed in Table 2-1 were sown directly in pots containing 1.00 kg organic soil under fully controlled conditions with a 22/18ºC day/night temperature, 40/50% day/night relative humidity, a 14/10 h (day/night) photoperiod and 80000 lux light intensity. One single seedling was maintained in each pot by clipping the secondary and tertiary tillers to eliminate the confounding effect of tiller number on plant responses under heat stress (Wardlaw 2002). Lines were grown in a completely randomized design with three replications for both the control condition and stressed condition. After 21 days, plants in the heat treatment group were exposed to high temperatures by transferring them to a controlled chamber set at 34/25ºC for 4 days. Heat-stressed plants were watered daily while those in the optimum temperature group were watered every other day. Pots were randomized every day to minimize spatial effects. Data were collected after 4 days of heat treatment on chlorophyll fluorescence and triphenyl tetrazolium chloride (TTC) cell viability assay. The chlorophyll fluorescence was measured in both the control and heat treated plants using MINI-PAM, a photosynthesis yield analyzer (WALZ, Germany).
41
TTC assay was carried out as described by Fokar et al. (1998) after 4 days heat acclimatization. Chlorophyll fluorescence data represent percentage of reduction from control and TTC assay data represent relative values to the control.
2.3.3 Field evaluation
In the first season (2011/2012), experiments were conducted at the Biotechnology and Biosafety Research Center (BBRC) experimental field, Shambat, Khartoum North, Sudan (15°32′N, 32°32′E), and in the second season (2012/2013), at Gezira Research Station experimental field, Agricultural Research Corporation (ARC), Wad Medani, Sudan (14º24′N, 33º29′E). Two planting dates were used in each field: an optimum planting date (2nd week of November) and late planting date (2nd week of December) to enable and insure exposure of the crop to heat stress during the grain filling period. Meteorological data, in particular, the weekly maximum, minimum and mean temperatures, during the two cropping seasons were obtained from meteorological stations located at the two experimental sites (Fig. 2-2A, B).
Seeds were sown manually in rows 0.2 m apart in plots consisting of 2 rows of 0.5 m length, in both seasons and locations. The seed rate was 10 g/m2. Seeds were dressed with an insecticide Gaucho, (Imidacloprid 35% WP) (Bayer CropScience, USA) to control pests, especially termites and aphids. Triple superphosphate (4.3 g/m2 of P2O5), was applied prior to planting by furrow placement and urea was applied before the second irrigation (8.6 g/m2 of N). Irrigation was carried out at 7 to 10-day intervals to avoid water stress. Weeding was performed manually at least twice. All experiments were arranged in randomized complete block design with three replications.
42
Traits measured, their definitions and abbreviations are listed in Table 2-2. Grain yield was estimated per the main culm in the first season in Shambat due to lodging of some plots, whereas in Gezira lodging did not occur, and therefore, grain yield was estimated per plot. The heat susceptibility Index (HSI) was calculated according to the formula of Fischer and Maurer (1978): HSI = (1-Y/Yp)/D, where Y is the yield of the genotype at late planting, Yp is the mean yield of the genotypes at optimum planting and D (stress intensity) = 1-X/Xp, where X is the mean Y of all genotypes and Xp is the mean Yp of all genotypes. Genotypes were rated as highly tolerant (HSI ≤ 0.50), moderately tolerant (0.50<HSI≤1.00) or susceptible (HSI>1.00) to high temperature (Fischer and Maurer 1978, Khanna-Chopra and Viswanathan 1999).
2.3.4 Statistical analysis
All data were subjected to analysis of variance (ANOVA) followed by Fisher’s protected least significant difference (PLSD) test at P<0.05 using StatView software v.
5.0.1 (SAS Institute, Inc., USA). Field evaluation data were analyzed separately for each season then combined after testing the error mean squares for homogeneity. Simple correlation coefficients among all traits were calculated based on the overall means of the genotypes in the second season in Gezira.
2.4 Results
2.4.1 Evaluation under growth chamber conditions
Although a reduction in chlorophyll fluorescence was observed in CS and all tested lines, most of the introgression lines (except TAC11, TAC 3 and TAC5) exhibited a significantly (P<0.05) lower reduction in chlorophyll fluorescence compared to CS (Fig. 2-
43
1A). The substitution line TAC11 showed the highest reduction in chlorophyll fluorescence, while addition lines TAC3 and TAC5 showed a comparable reduction to CS. Addition line TAC9 did not experience a reduction in chlorophyll fluorescence, but rather showed a negative value, indicating that chlorophyll fluorescence under heat stress was enhanced in this line than the control condition. Addition lines TAC1, TAC6, TAC9 and TAC12 and substitution line TAC17 showed significantly higher values of TTC than CS, whereas all other lines had comparable values to CS (Fig 2-1B). These results indicate the presence of genotypic variability among the chromosome introgression lines for heat stress tolerance, and moreover, the impacts of Leymus chromosomes on wheat heat stress tolerance.
2.4.2 Field evaluation
Since the growth chamber experiments indicated genotypic variability in heat stress tolerance among the introgression lines, they were further tested in the field under heat stress conditions in Shambat and Gezira, Sudan. Maximum and average temperatures were higher in Gezira in the second season compared to Shambat in the first season (Fig. 2-2A, B). In general, the temperature from the 9th to the 12th week was lower than that from the 1st to the 8th week, and the 13th to the 22nd week.
In Shambat in the first season, heading of the optimum planting occurred between the 9th to the 13th week, while physiological maturity occurred from the 13th to the 17th week.
For the late planting, heading occurred from the 12th to the 16th week and physiological maturity from the 16th to the 19th week (Fig. 2-2A). In Gezira, heading under optimum planting was observed from the 9th to the 15th week and physiological maturity from the
44
14th to the 18th week. Under late planting, heading was from the 13th to the 18th week and physiological maturity was from the 17th to the20th week (Fig. 2-2B).
2.4.2.1 Heading and maturity
Heading was observed in CS between 90 to 97 days after sowing, while maturation occurred within 109 to 121 days in both seasons in Shambat and Gezira. The introgression lines exhibited a wide range of heading and maturity. Addition lines TAC1, TAC12 and TAC13 showed early heading within 58 to 66 days and matured within 88 to 103 days (Table 2-3). TAC15 and TAC17, on the other hand, were the latest to head and mature among all the introgression lines. Their heading was almost later than CS, while maturity was nearly comparable to CS, although TAC15 matured later than CS under optimum planting in Gezira. The remaining introgression lines showed earlier heading and maturity than CS. Except for the early genotypes (TAC1, TAC12 and TAC13); all genotypes were subjected to high temperatures during the grain filling stage under both optimum and late planting. The early genotypes experienced high temperatures during the grain filling stage under late planting. Moreover, heat stress occurred late in the season, reduced the mean DH and DM by 3 and 4 days, respectively. The effects of genotype (G) and planting date (PD) were significant for both traits in Shambat and Gezira (Table 2-3), while the effect of G x PD was significant for both traits in Gezira but not Shambat. This significant G x PD interaction and the reduction in DH and DM with late planting indicate the effect of environment on each genotype.
2.4.2.2 Plant height and tiller number
45
The mean plant height (PH) was higher in Shambat than Gezira under both optimum and late planting (Table 2-4). This could be attributed to the high temperature in Gezira at the beginning of the season (Fig. 2-2A, B), affecting plant development at an early stage.
An apparent reduction in PH under late planting was observed in Gezira due to the higher temperatures (Table 2-4, Fig. 2-2A, B). In Shambat, the height of CS was 88 cm under optimum and 90 cm under late planting, while in Gezira it was 80 and 62 cm, respectively.
Addition lines TAC8 and TAC10 were taller than CS under both optimum and late planting in Shambat and Gezira, indicating the presence of genes associated with PH in these Leymus added chromosomes. All other lines were comparable to CS in Shambat, although in Gezira, TAC3, TAC4, TAC6 and TAC11 were taller than CS and TAC14 and TAC17 were shorter under both optimum and late planting (Table 2-4). Analysis of variance revealed a significant G effect. The effects of PD and G x PD were significant only in Gezira, which was hotter than Shambat (Table 2-4, Fig. 2-2).
Tiller number (TN) was estimated in Gezira in the second season. The TN of CS was 45 under optimum planting and 29 under late planting. The TN of the addition lines ranged from 57 in TAC6 to 24 in TAC15 under optimum planting and from 63 in TAC10 to 30 in TAC15 under late planting (Table 2-4). TAC6 and TAC10 had the highest TN, while TAC13 and TAC15 had the lowest. There was a reduction in TN under late planting and an apparent reduction was observed in CS, TAC3, TAC4, TAC5 and TAC11. The effects of G, PD and G x PD were significant (Table 2-4).
2.4.2.3 Spike length and number of spikelets per spike
46
The spike length (SL) of CS was 9.5 and 8.2 cm under optimum planting and 9.9 and 7.2 cm under late planting in Shambat and Gezira, respectively (Table 2-5). The SL of the introgression lines ranged from 7.6 cm in TAC6 to 11.2 cm in TAC13 under optimum planting and from 7.5 cm in TAC14 to 11.5 cm in TAC13 under late planting. Among the introgression lines, substitution line TAC11 and addition line TAC13 had the longest spikes, while addition lines TAC14 and TAC15 had the shortest (Table 2-5).
The spikelets per spike (SPS) of CS were 21 and 22 under optimum planting and 21 and 19 under late planting in Shambat and Gezira, respectively (Table 2-5). The SPS of the introgression lines ranged from 17 in TAC13 to 24 in TAC4 under optimum planting and from 15 in TAC13 to 22 in TAC3, TAC4, TAC11 and TAC14 under late planting. None of the addition lines had a higher SPS than CS across environments and PD, except TAC6, which had more SPS in Shambat under optimum planting. The highest reduction in SPS was recorded in Gezira under late planting (Table 2-5). The variation in SL and SPS among genotypes was highly significant in both environments (Table 2-5). The PD differences were significant only in Gezira and no significant G x PD interaction was observed.
2.4.2.4 Number of kernels per spike and 1000 kernel weight
Kernel number per spike (KS) was higher in Shambat than Gezira under optimum and late planting due to the high temperatures in Gezira (Table 2-6, Fig. 2-2A, B). The KS of CS was 55 and 37 under optimum planting in Shambat and Gezira, respectively, and 51 and 26 under late planting, respectively. The KS of the introgression lines ranged from 3 in TAC15 to 68 in TAC6 under optimum planting and from 6 in TAC17 to 58 in TAC6 and TAC10 under late planting in the two environments (Table 2-6). TAC6 and TAC10 had