■ Article ■
Corporate
Organization
of Indian
Business
Enterprises
During
the British
Colonial
Period
●
Chikayoshi Nomura
1. Introduction1)
At the time of its national independence, India was one of the most industrialized countries in Asia, with more than 5,337 modernized factories employing 1,571,572 workers and producing a variety of commodities such as cotton yarn and cloth, jute products, iron and steel, lime and firebrick, matches, refined petrol and electric power.2) In spite of such impressive achievements, it is also true that industrial devel-opment in British India was somewhat less than satisfactory in achieving steady na-tion-wide economic growth, making India ironically one of the least developed economies in the world at the time of national independence.
In light of this fact, research to date has attempted to explain both why industrial development in British India got such an early start and, more importantly, what caused the inadequacies in the development. The latter issue has received consider-able scholarly attention, resulting in what can be summarized as two conflicting views. On the one hand, some nationalistic scholars have argued that it was colonial regime that essentially accounted for the industrial stagnation. They insist that, for example, the economic policy of the colonial government gave overriding priority not to Indian development but to British interests, and such indifference to Indian eco-nomic development led to the neglect of industrial and financial policies to promote 野村 親義 Chikayoshi Nomura, faculty of economics, Kanagawa University, associate
pro-fessor.
Subject: economic history of india.
Articles: "Development of an educational institution for firm specific technology: a case of the Tata Iron and Steel Industry" (in Japanese), Kiyo, Oriental Institute of Culture, the Uni-versity of Tokyo. 2004.
Corporate Organization Matters: a case study of the Tata Iron and Steel Company in India under colonial regime in the 1900s-1920s, Ph.D., dissertation, the University of Tokyo. 2005.
Indian industrialization [Bagchi 1972; Gupta 1987; Ray 1992; Banerjee 1999]. On the other hand, there is the argument that industrial stagnation under the colonial re-gime can be explained largely by market factors rather than colonial policy or politi-cal factors. That is to say, factors such as extreme information asymmetry in markets and serious scarcity of capital in the context of affluent supplies of labour can largely explain limited industrialization, since a steady development of industrialization re-quires stable transactions to realize the smooth adjustment of mass production and mass consumption of industrial goods or the gradual and far-flung replacement of labour with capital goods [Morris 1983; Roy 2000]. Of course, the proponents of this latter view do not deny the negative influence of colonial policy on industrial devel-opment. They claim that market features can explain the insufficient growth in indus-trialization better than political factors.
However, both positions pay scant attention to the activities of specific corporate institutions, choosing rather to search for the causes of growth or stagnation at the macro-level: general fiscal policy, market functioning or resource endowment . Of course, there have been attempts to investigate the activities of specific industries, like cotton and jute manufacturing; however, insufficient effort has been made to exam-ine in detail how specific companies in a specific industry were managed and how their management affected the progress of those companies or the industry as a whole. It is my opinion that only a close examination of the activities of specific busi-ness enterprises and their "corporate organization" will enable us to obtain a clearer and more in-depth understanding of the cause of the limited development in Indian industrialization.
Such a "corporate analysis" approach has been employed by scholars of business histories of U.S., U.K., or Japan to show that the development of "corporate organi-zation" or "economic institutions" raises efficiency in economic transactions and plays a major role in modern economic development. For example, Alfred Chandler, an eminent business historian, points out that in the U.S. during the 20th century, cor-porate organization-in his words the "visible hand" of management-coordinated and monitored the resource allocation of large scale enterprises that led to modern economic growth in a more efficient way than the market mechanism did, and played a very important role in industrialization in the U.S. during that century [Chandler 1977: 1]. Therefore, it may be possible that the research on Indian industrialization to date, most of which has focused exclusively on the macro-level economy and in-dustry without paying sufficient attention to what occurred at the corporate-level, does not give us a clear enough understanding of all the causes of development and stag-nation in the industrialization of colonial India.
The aim of this paper is to show by the use of "growth accounting analysis" that corporate organization played an important role in such progress or stagnation in at least two leading Indian industrial sectors. It suggests that an analysis of the "visible
hand" will richly contribute to a better and deeper understanding of the progress made in industrialization under the British Raj. This idea will be tested in the present paper using corporate-level statistical evidence from two leading Indian industries, the cot-ton mills of Bombay and the Tata iron and steel works at Jamshedpur.
The argument offered here, which focuses on the effect of corporate organization on industrial progress, may seem to side with researchers who stress market factors to explain the essential features of Indian industrialization over colonial policy or po-litical factors, since the issues of private business enterprises relates more to market than political factors. However, the insufficient functioning of the market mechanism, or corporate organization, can also be improved by "market friendly" or "market en-hancing" government intervention [World Bank 1994; Aoki, Kim and Okuno-Fujiwara 1997]. That is to say, colonial policy could be blamed for the insufficient operation of the market and industrial stagnation in India, since there might have been, in fact, several possible market friendly policy choices open to the colonial re-gime. What I intend to suggest here is that corporate organization can be considered as one of the leading factors in determining the growth or stagnation of Indian indus-trialization. It is hoped that this analysis will pave the way for more concrete research on how market factors and colonial policy jointly caused the limited development of Indian industry through their impact on corporate organization.
2. Short history of the enterprises
2.1 Cotton mills in Bombay
2.1.1 Historical overview
The cotton mills of Bombay, which were one of the most important industrial ven-tures in British India, began operating as early as the 1850s under the entrepreneur-ship of the city's Parsi merchants. They accumulated capital and know-how on dealing in raw cotton and cotton goods through their daily domestic and international transactions at the leading centre of the cotton trade in India, Bombay, and thus gained a decisive advantage from the outset over merchants in other areas of India.
This industrial venture proved to be a great success, largely due to the above-men-tioned decisive advantages, as well as easy access to one of the world's richest cotton growing areas in the hinterlands of Bombay, and strong connections with British ma-chinery producers.3) These factors essentially originated from the colonial relation-ship between Britain and India.
Bombay's cotton mills began to grow apace in the 1870s. The city grew into the first centre of modern industrial enterprise in Asia during the 1880s, and the number of mills reached a reported figure of 70 with a combined total 2,124,000 spindles in 1895. As the mills grew, the coarse yarn they produced began to find foreign outlets based on the high international competitiveness and rich market information. The
Chinese market became the most significant among such foreign outlets as some 1,460 lakhs lbs. of yarn were exported from Bombay to China in 1891, increasing to 2,607 lakhs lbs. in 1905. Quoting figures for other leading cotton exporters at that time for comparison: British exports of cotton yam to British India came to 497 lakhs lbs. in 1890 and 393 lakhs lbs. in 1905, and 149 lakhs lbs. in 1890 and 84 lakhs lbs. in 1905 to China. Japan, another leading exporter to China, exported 1,188 lakhs lbs. during 1903 [Rutnagur 1927]. Such figures obviously indicate the strong international competitiveness of Bombay cotton mills at that time.
The performance of the Bombay mills was indeed remarkable in world history, since it showed that an Asian country under imperialist restrictions could attain inter-national competitiveness in a major industrial activity, though this success was lim-ited to lower quality yarn between 3s to 40s counts and finer yam production had been dominated by British manufacturers. It was even more remarkable since the ven-ture was mostly managed and financed by indigenous Indian merchant capital, indi-cating the high potential of Asian business enterprises at a very early stage.
However, the favourable prospects for Indian industry were dampened when an-other Asian industrialising nation, Japan, began to export coarse yam to the Chinese market at the turn of the century. By 1912, Japan was exporting yam to the amount of 1,333 lakhs lbs., increasing that amount to 2,116 lakhs lbs. in 1915. On the other hand, Indian yam exports to China, most of which were produced in Bombay, de-creased from 2,607 lakhs lbs. in 1905 to 1,292 lakhs lbs. in 1912 and further to 1,166 lakhs lbs. in 1915. From that time on, Indian yam exports plummeted, reaching a mere 200 lakhs lbs. in 1924, less than 10% of the 1905 figure. The failure on the part of the Bombay cotton producers was not only due to the takeover of the Chinese mar-ket by an upstart Asian competitor. It was also due to the fact that the Indian domes-tic market suffered from the sudden invasion by the same competitor, especially after the outbreak of World War I, when Japanese yam replaced British yam, the supply of which had been suspended due to wartime conditions. Indian imports of Japanese yam sharply increased from 0.3 lakhs lbs. in 1905 to 12 lakhs lbs. in 1913, and jumped to 323 lakhs lbs. in 1924, a figure exceeding Indian exports to China of the
same year [Rutnagur 1927].
The woes of the Bombay producers, especially after the outbreak of the War, were not limited to the stiff competition offered by Japanese companies. They also faced a serious challenge from non-Bombay based Indian cotton mills, those in Ahmedabad for example. These non-Bombay mills of India enjoyed cost advantages over the Bombay mills owing to the fact that wages in Bombay had become higher than in other areas due to the city's early industrialization. In addition, the companies in Ahmedabad were better managed, mostly on a family basis, leading to another com-petitive advantage.
2.1.2 Points at issue
The decline of the competitiveness of Bombay yarn both at home and abroad was regarded as a serious problem by the economic historians and economists of the time [Bagchi 1972: Chapter 7; Kiyokawa 1976ab; Koike 1979; Ray 1979: Chapter 3; Wolcott and Clark 1999]. The central question was why Bombay cotton mills lost their competitive edge against Japanese companies, despite the fact that Japanese manufacturers depended on Indian raw cotton and thus suffered from freight cost dis-advantages.
Some scholars ascribed the anomaly to the laissez-faire economic policies of the colonial government, claiming that Bombay cotton mills lost their competitive edge due to exposure to open market competition as the colonial regime levied import du-ties only for revenue purpose. They argued that Japan was not ruled by a colonial government and hold free hand to decide a level of tariff rates and the difference in attitudes of the two governments explained the dissimilar performance between the mills of the respective countries. However, such an argument does not explain why Bombay mills lost to Japan, since Japanese authorities did not have the autonomy to determine import tariff rates due to the unequal "Peace and Amity" treaty forced upon it by the United States in 1854 and similar agreements with other super powers later on. As a result, the Japanese import tariff on cotton yarn was only 2.6 per cent even in 1897, when Japanese producers first appeared as strong competitors against Indian exports to China. Although that rate was raised to approximately 10 per cent in 1899, the tariff differentials were not significant enough to explain such sharp decline in
the competitiveness of Bombay yarn. What is more, the difference was contracted
again in the 1910s when the government of India decided to introduce a 4 per cent tariff on imported yarn (7.5 per cent including a countervailing excise of 3.5 per cent) in 1916, while the Japanese rate was still 10 per cent [Takamura 1971; Kumar 1983].
Some scholars attributed the loss of competitiveness to changes in the international exchange rate of the rupee. They argued that the colonial government tried to appre-ciate the currency, especially from the 1880s onwards, in order to reduce the rupee-based payments of sterling pound debts incurred by the government of India and to
secure an imperial financial interest in British India. Such a monetary policy
nega-tively affected the competitiveness of Indian yarn in the Chinese market vis-a-vis
Japanese producers, who were exporting their products under a relatively depreciated yen, due to Japan's ability to manipulate rates of exchange [Rutnagur 1927; Koike
1979: 204-206]. This view is not entirely convincing either, because the costs of pro-duction for Japanese companies increased more than those for Bombay mill owners, and the higher rates paid by Japanese companies totally counterbalanced the negative influence of rupee appreciation on Bombay producers. For instance, wages for
ordi-nary labour in the Japanese manufacturing sector increased by almost 121 per cent
by Bombay producers increased only by 50 per cent at most, during a longer period between 1875 and 1905 [Rutnagur 1927].4) Given the fact that the rupee appreciated against the yen by about 43 per cent during the 30 years between 1875 and 1905 (from Rs.2.17 to Rs.1.51 to the yen5), the influence of currency appreciation was al-most fully counterbalanced by difference in the changes of production cost
(repre-sented here by wage increases) between Bombay and Japanese mill owners.
If so, how are we to explain the loss of competitiveness of the Bombay mills? The empirical examination of the corporate activity of cotton yarn mills in Bombay through growth accounting methodology may provide an answer. (see Section 3) Now let us review another case of iron and steel production.
2.2 Iron and steel company at Jamshedpur 2.2.1 Historical overviews
India had a long history of iron and steel production by western methods before the appearance of the first full scale venture by the Tata Iron and Steel Company (hereafter TISCO) at Jamshedpur in 1907. The very first attempt was made by an En-glishman, Josia Marshall Hearth, an employee of the East India Company, at Proto Novo on the Madras Coast during the 1830s, two decades before the invention of the Bessemer furnace in the U.K. The Bengal Iron and Steel Company, which was estab-lished in 1889 with Martin and Co. as its managing agency, followed in hearth's foot-steps and became the first factory to produce internationally competitive pig iron. However, it was only at the beginning of the 20th century that the first sustainable iron and steel company, TISCO, was established in India.
The formation of a domestic industry manufacturing pig iron and steel ingots based on the latest European technology was for a long time the cherished dream of Jamshetji N. Tata (1839-1904), head of the Tata family and founder of TISCO. Tata was the son of a Bombay Gujarati-Parsi merchant, Nusserwanji Tata, who made a fortune as a government supplier and in intra-Asian trade mainly with China [Harris 1958; S.K. Sen 1975]. The idea of founding an iron and steel company occurred to Tata as early as 1875, but the idea did not take any concrete form until 1901, due to lack of necessary pre-conditions like changes in government policy relating to min-ing lease, property rights, and the extension of railway lines for the transportation of inputs and products.6) A preliminary scheme was drawn up with the assistance of Julian Kennedy, the CEO of Kennedy, Sahlin and Co., Ltd. in the U.S. as early as 1906. It was proposed in 1909/10 that a plant consisting of two blast furnaces, four 40-ton basic open hearth steel furnaces, a blooming mill, a rail and beam mill, two bar mills, etc. for the manufacture of 120,000 tons of pig iron and 72,000 tons of steel ingots annually, could occupy 38 per cent and 10 per cent respectively of do-mestic demand at that time [Annual Report of TISCO 1909/10; Perin and Weld 1905: 21-22]. The steel works went into operation at the beginning of 1912, and the first
heat was tapped on 16 February of that year.
It is widely believed that TISCO experienced exceptional success during the colo-nial period, in contrast to the stagnating cotton yarn mills of Bombay. For example, A.K. Bagchi praises TISCO as "the single most important instance of pioneering by
private enterprise in India during the twentieth century. The represent-atives of both
the British Government and the nationalists used superlatives in describing the
achievement" [Bagchi 1972: 291]. The trend of domestic iron and steel production
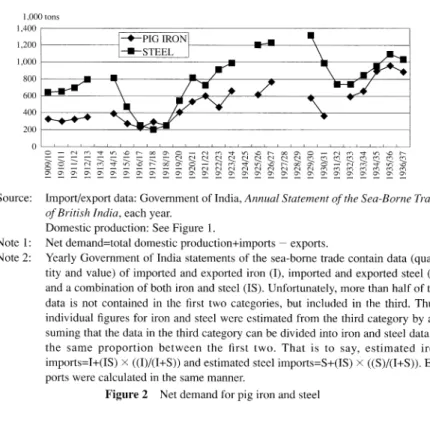
and the growth of self sufficiency ratios support this commonly held view. The figures below illustrate domestic production (Figure 1), the demand for pig iron and saleable steel in British India from 1909/10 to 1937/38 (Figure 2) and their self-sufficiency ratios during the same period (Figure 3). Since TISCO was the only steel producing company in India during that period, the "domestic production of steel" in Figure 1 implies TISCO's performance. A mere glance at the data verifies the fact that TISCO indeed enjoyed "sound and smooth" development and that the company was a suc-cessful venture. In fact, TISCO increased its production of saleable steel from 20,000
Source: TISCO: Annual Reports of TISCO, BISCO and IISCO: The Investor's India Year-book; Government of India: Department of Commercial Intelligence and Statistics, Statistical Abstract for British India.
Note 1: There were only three pig iron producing companies in India using modern west-ern technology before 1937/38: TISCO, the Bengal Iron and Steel Company (BISCO, established in 1889) and the Indian Iron and Steel Company (IISCO, es-tablished in 1919).
Note 2: The data of pig iron for BISCO before 1914 was interpolated from the data of 1901 given in Chaudhuri [1975: 34] and that of 1914 given in The Indian Investor's Year-book.
Note 3: There was only one steel producing company using modem western technology in India, TISCO, in the period of this study.
tons in 1912/13 to 115,000 tons in 1922/23, to 431,000 tons in 1932/33 and to 728,000 tons in 1942/43 [Annual Reports of TISCO]. Accordingly, the market occu-pancy ratio of TISCO steel, which is shown by "India's self-sufficiency ratio", also grew from 2 per cent in 1912/13 to 13 percent in 1922/23, 58 per cent in 1932/33 and 66 per cent in 1936/37 (Figure 3). This statistical evidence apparently suggests TISCO's successful performance, in spite of the general industrial stagnation in In-dia.
2.2.2 Points at issue
Why could TISCO demonstrate such an outstanding performance in the midst of
general stagnation? Some researches point to the excellent entrepreneurship of J.N.
Tata and members of his family, who possessed extensive and accurate information on the Indian domestic market, and the methods of cost reduction [Ray 1979: 78-81; 1992: 46; Morris 1983: 588]. It is true that such entrepreneurial capacity is necessary for the development of any modern business enterprise; however, attributing the suc-cess of TISCO, a business concern with more than 20,000 employees and over Rs. 2,000 lakhs of fixed capital [figures in the 1920s], solely to the managerial skills of a
Source: Import/export data: Government of India, Annual Statement of the Sea-Borne Trade of British India, each year.
Domestic production: See Figure 1.
Note 1: Net demand=total domestic production+imports - exports.
Note 2: Yearly Government of India statements of the sea-borne trade contain data (quan-tity and value) of imported and exported iron (I), imported and exported steel (S) and a combination of both iron and steel (IS). Unfortunately, more than half of the data is not contained in the first two categories, but included in the third. Thus, individual figures for iron and steel were estimated from the third category by as-suming that the data in the third category can be divided into iron and steel data in the same proportion between the first two. That is to say, estimated iron imports=I+(IS) •~ ((I)/(I+S)) and estimated steel imports=S+(IS) •~ ((S)/(I+S)). Ex-ports were calculated in the same manner.
few dozens of people is hardly persuasive.
Others focus on changes in the laissez-faire, non-interventionist colonial regime at the turn of the century, whose attitude toward domestic industrial ventures enabled TISCO to enjoy steady development from that time on. It is true that the government did introduce measures which helped the development of TISCO, like offering re-duced rates for the drayage of construction materials for the steel works during the 1900s, providing store purchase contracts for 20,000 tons of steel rails during the 1910s, and introducing protective tariffs during the 1920s [S.K. Sen 1964: 65-66; 1975: 42-47].7) However, it is not easy to assume that such political support was the essential cause of the company's exceptional growth, since, for example, 20,000 tons of annual store purchases occupied less than 28 per cent of TISCO's steel production capacity at the time. This meant that the company could not expect to develop unless it succeeded in exploring outlets for more than the remaining 72 per cent in the pri-vate market on its own, which required improvement of competitiveness of steel pro-duction outside the umbrella of government support. The intropro-duction of "relatively high" protective tariffs on steel materials in the mid-1920s, another alleged "leading factor" in TISCO's progress, does not sufficiently explain the company's exceptional development either, since the tariff rates on steel materials were not "relatively high" in comparison with those levied on other commodities. Indeed, industrial materials like cotton piece goods, motor cars and silk piece goods were taxed at 30.3 per cent, 29.2 per cent and 83.9 per cent respectively in 1933/34, while the tariffs on steel came to an average of just 21.6 per cent')
How then are we to explain TISCO's success? Statistical examination of its corpo-rate-based activity through "growth accounting methodology" in the following sec-tion may provide a better answer.9)
Source: See data in Figure 1 and Figure 2.
Note: The self-sufficiency rates are calculated on bases of Figure 1 and Figure 2. Figure 3 Self-sufficiency rates for pig iron and steel
3. Method of analysis
3.1 Total factor productivity analysis
The "growth accounting method," pioneered by R.M. Solow , has often been used by economists and economic historians to explain growth occurring at various levels of economic activity: the nation, specific industries and particular firms ." In growth accounting, the proximate sources of growth are divided into the growth of inputs , such as physical capital, labour and land, and their productivity. The factors of pro-duction are weighted to arrive at measures of total factor inputs. In a neo-classical framework, factor income shares are usually taken as weights. The part of growth attributed to changes in total factor productivity is considered as the residual unex-plained by changes in factor inputs.
The following traditional growth accounting method is adopted to analyze the source of growth of cotton yarn production in Bombay and iron and steel production at TISCO during the colonial period. Assuming the standard Cobb-Douglas produc-tion funcproduc-tion and the presence of competition, Y = AKaLI-a , the annual growth of cotton mills and TISCO is expressed by
where Y, K and L indicate saleable products, real gross block capital and man-hour of employees respectively; and SK and SL are the factor income shares of capital and labour respectively. The Solow residual, or total factor productivity (hereafter TFP), which is indicated by AA/A, signifies everything that contributes to growth , except the growth of real gross block capital and man-hour of employees, being com-posed of such factors as economies of scale, technological innovation, improvements in resource allocation efficiency, etc. TFP is computed by
An examination of how each factor like capital, labour and TFP contributed to posi-tive or negaposi-tive growth of each Bombay cotton mill or TISCO is expected to provide a reliable clue for explaining the positive/negative growth of these companies during a specific period of time.
3.2 The data
Deriving meaningful results from growth accounting analysis of course depends on the existence of reliable statistical data. The following is a brief discussion of the statistical data-set to be used for the analysis here.
3.2.1 Cotton mill data
Most of the data for an analysis of leading factors of growth/stagnation in the
Bombay cotton mills can be derived from the Report of Bombay Millowners' Asso-ciation (hereafter BOMA). The Report was published annually by the AssoAsso-ciation
from 1875 onwards. It targets cotton mills nationwide, not only those operating un-der the Indian Company Acts, but also those outside the Acts. It contains
corporate-level statistics like company name, names of agents or owners, office address, corporate situation, types of capital raised (number of shares, nominal value of each share, total paid-up capital), number of spindles installed and in operation, number of looms installed and in operation, approximate quantity of cotton consumed per year and average number of hands employed daily. In addition, it gives area-wise fig-ures, like those of the mills operating on the Island of Bombay, in the Presidency as a whole, in each state in British India and in the whole of British India and the princely states. BOMA provides rough clues to the three necessary statistics for growth ac-counting analysis: yield, capital and man-hour of employees, though some of the raw data cannot be used without minor modifications.
3.2.1. 1 Yarn production
Corporate figures for yarn production are not available for the period under study, but published figures relating to the "approximate quantity of [raw] cotton [in bales] consumed during a specific year of specific companies" in BOMA can be taken as a reasonably good index of production trends, on the assumption that the quality of goods produced did not change considerably during the period.")
Such an assumption seems more or less acceptable, since Bombay mills concen-trated their production only on lower counts of yarn, ranging on average from 3s to 30s throughout the colonial period. Only a very few mills ever tried to manufacture finer counts as far as 60s, while the finest varieties of yarn reached 150s or even 300s, like Best Egyptian Cotton or Best Sea Island Cotton. For example, over 86.56 per cent of the cotton yarn spun in Bombay consisted of counts ranging from 1 s to 30s even in 1931/32, when it was reported that some of the mills in Bombay had started to spin finer yarn than they did before to avoid competition with Japanese yarn, most of which also consisted of lower counts [Government of India 1932: 15].
3.2.1. 2 Capital
How to define capital, come up with an acceptable data-set for capital suitable to that definition and also make reliable estimates of the present value of capital are se-rious matters for growth accounting analysis. There are two kinds of definition of capital. The narrow one defines capital as manufactured equipment for production over a future period, while the broader one includes all agents, including human, with the capacity to generate income and products in the future. Here, we will adopt the narrow definition and employ only BOMA's "number of spindles in each company" as our index of capital.
In addition, we will employ the concept of spindles at work, instead of spindles installed. This is because mill owners sometimes reduced the rate of operation to suit
the yield of their mills to declining demand for cotton yarn, especially in the 1920s. The number of spindles installed is, therefore, not a proper indicator of the amount of input of capital of such a period. BOMA provides figures of spindles installed and spindles at work for each mill in Bombay after the 1910s and rate of operation can be calculated from these figures. Following are results of calculations, for instance, of average rates of operation of mills in Bombay in each year: 0.937 in 1920, 0.677 in 1929, 0.887 in 1935 and 0.883 in 1940. We assume, firstly, that mills in Bombay maintained rate of operation as high as 0.93 until 1920 when there was sufficient de-mand for cotton yarn of Bombay due to their high competitiveness both internation-ally and domesticinternation-ally. Secondly, we suppose that the mill owners then reduced the rate of operation in the 1920s from 0.93 to 0.67 to suit the yield of their mills to de-clining demand for their product. Lastly, we consider that the mill owners increased the rate of operation again to 0.88 in the 1930s when domestic demand for Bombay yarn recovered.
Furthermore, we will use the concept of real gross, instead of net, capital stock. In other words, we will not take into consideration any deterioration in the production capacity of installed spindles. This is because net capital stock gives too sharp a de-cline in output capacity due to increased downtime for maintenance and repair, etc.12)
3.2.1.3 Labour
BOMA's figures for "average number of workers employed at each company" are those for both spindle and loom workers, hence we must estimate the figures for spindle labour. We will assume that only one worker was needed to operate two looms (0.5 workers per loom),") and subtract half the number of looms from the total workforce to reach the number of workers operating spindles.
In addition to this estimate, labour input must be adjusted to include different work-ing hours. BOMA does not contain such figures, so we will have to rely on workwork-ing hours of cotton mills reported in various government reports and monographs '4) to estimate the typical case for Bombay, which may be applied to all Bombay mills across the board. These sources reveal that most workers in Bombay were employed 14.5 hours per day from 5am to 8pm with a midday break of half-an-hour before the implementation of the Indian Factory Act in 1911 [Government of India 1908], which limited the working hour per day for adults to 12 hours. Of course, actual working hours fluctuated in accordance with the rise and fall in yarn demand in domestic and international markets. In addition, the installation of electrical lighting from the late 1880s onwards is reported to have extended working hours per day in general. De-spite such facts, we estimate an average work load of 14.5 hours per day before 1911, including pre-1890 (since it is reported that dawn to dusk schedules were imposed as early as in the 1850s), and 12 hours after 1911. It seems that the regulation of the Indian Factory Act in 1911 was observed in general, since not only a major report of
the Royal Commission of Labour in India, but also interviews with mill-hands col-lected by the Commission, indicate that most workers laboured within the statutory
regulations. The Indian Factory Act was amended in 1934 by recommendation of the
Commission Report and limited the statutory working hours of a male factory worker to 10 hours per day. Thus, average working hours of labour is considered to reduce to 10 hours per day after 1934.
3.2.1. 4 Factor income share
Factor income share is first calculated by dividing total wages by the sum of profits and total wages. Annual profit and total wage payments for specific companies in Bombay are available for the years 1914 and 1924 [Rutnagur 1927].'5) Average fac-tor income shares in 1914 comes to 0.5863 for 41 mills, and 0.8952 for 59 mills in
1924, the great difference in percentage of labour income share being accounted for by large profit fluctuations due to the volatile market conditions of those times.
In addition, labour income share for the 1930s and 1940s can be roughly calcu-lated on the basis of Census of manufactures, 1946 and Report of the Indian Tariff Board regarding the Grant of Protection to the Cotton Textile Industry, 1932, whose
figures are an averaged figure of mills producing cotton yam in India and are
sum-marized in Sivasubramonian [2000]. While the former source gives us shares of
"value added" and deductible costs with concrete items consisting of cost of raw ma-terials, cost of fuel, power, etc., and depreciation, the latter source provides
percent-age distribution of "manufacturing cost" for Bombay cotton with concrete items
consisting of labour and supervision, fuel and power, repairs and maintenance, rent rates and taxes. If we assume that manufacturing costs, except the cost for labour and supervision in the latter source, equal the deductible cost of the former, it is possible to estimate labour income share for the 1930s and 1940s at 0.6868.
Combining our estimates for the 1910s, 1920s, 1930s and 1940s, we assume that an average of the labour income share of cotton mills in Bombay was approximately 0.7 for the entire period. Despite the existence of large fluctuations in the base fig-ures, 0.7 is the average of figures for the boom year in 1914 and the depression year in 1924, which comes close to 0.686, the estimate for the 1930s and 1940s. We will use the 0.7 figure when examining factors of growth for the entire period in question, while three different figures will be used for pre-1920s, 1920s and 1930s respectively.
3.2. 2 Iron and steel
3.2.2. 1 Yield
The Annual Report of TISCO, 1950/51 gives us per annum output figures for its
principle products-coke, pig iron, steel ingots and saleable steel, and steel
des-patched to customers; rails and fishplates, bars and light structurals, etc.-from the
an index for the company's annual production, though this has several problems, the most serious of which is the fact that TISCO sold other products as well. Pig iron, in particular, formed a considerable part of the company's annual revenue at the begin-ning of the 1910s. However, we do not think that this had a serious impact on the general trend of total production, since it was just for nine years in TISCO's long history that pig iron exceeded 10 per cent of total sales: three years from 1913/14 and six years from 1919/20.
3.2.2.2 Capital
The Annual Report of 1950/51 gives us time series figures of nominal gross block capital of the company in value-base after 1907/08, including buildings, production equipment, but excluding social capital for welfare and block capital for colliery. We will use these figures with a minor modification, converting the nominal value of block capital to real one. We first determine the real value of capital formation for each year by dividing annual growth of nominal gross block capital by the price de-flator of TISCO steel, assuming that the accumulation of the annual growth of real value of gross block capital from the initial year of operation to a specific year will be the real block capital for that specific year.16) The use of gross, instead of net, block capital is for the same reason as with our cotton mill analysis.
Besides, we will employ the concept of capital at work, instead of capital installed, due to the same reason as with the concept of capital of cotton mills in Bombay. We estimate the rate of operation of TISCO by dividing production capacity of steel fur-naces by annual production of steel ingots and get capital at work by multiplying rate of operation and gross block capital calculated above. Unfortunately, there are no ready made figures for production capacity of steel furnaces of TISCO and the fig-ures have to be estimated, though other necessary figfig-ures, annual production of steel ingots and gross block capital, are provided in or can be calculated from the data of the Annual Report of the company. According to the Annual Report of TISCO and General Manager's Correspondence File of TISCO archives at Jamshedpur which in-dicate production capacity of each furnaces of TISCO317) total annual production ca-pacity of steel ingots of TISCO were roughly 132,000 tons until 1916/17, 214,000 tons until 1919/20, 261,000 tons until 1923/24, 532,000 tons until 1928/29 and 803,000 tons until 1939/40.18) Dividing annual production of steel ingots by the an-nual production capacity indicates that the rates of operation of TISCO were roughly 0.65 in the 1910s, 0.80 in the 1920s and 0.99 in the 1930s. Multiplying the rate of operation and real gross block capital gives us the necessary figures of gross capital at work.
3.2.2.3 Labour
in the Annual Reports. Contrary to the case of the cotton mills in Bombay city, the maximum work day at TISCO was fixed at 8 hours as early as in 1912, the year after the start of steel production. There have been no subsequent revisions, apart from ex-ceptional cases of reported overtime work. Therefore, we will assume that TISCO employees worked for 8 hours a day during the colonial period.
3.2.2.4 Factor income share
TISCO's annual value added for the whole period in question is presented in Sivasubramonian [2000], while figures of total payments to employees for 15 years from 1923/24 to 1937/38 (including salaries and bonuses) is given in Industrial Rela-tion File No. 105 found in the TISCO archives at Jamshedpur. Total payments before
1922/23 can be estimated from the total number of workers in each Annual Report and average payment for the company production workers from the "Indian Tariff Board Report on Steel" [Government of India 1924]. We will use an average 0.55 labour income share for 27 years from 1913/14 in our analysis.
4. Results of the analysis (1): Yarn production in Bombay
4.1 General summary
We first analyzed the general trends in the industry during the colonial period in order to prepare for our corporate-based analysis. (see Figure 4)
The quantity of cotton yarn produced in Bombay city, calculated on the basis of raw cotton consumed in the process, slowed down at the end of the 19th century after three decades of prosperity. The production growth rate, which was over 10 per cent annually during the 1880s, dropped to 3.15 per cent during the first years of the 1900s and recorded negative figures during WWI and after. This result is reasonably consist-ent with the commonly held view concerning the rise and fall of cotton yarn produc-tion in Bombay city under the colonial regime.
The results of our growth accounting analysis further indicate the possible factors leading to stagnation. In general, it was additional investment in spindles and labour to man them that pushed up the industry's growth rate, except for the two decades of the 1880s and the 1930s when the total factor productivity (TFP) showed apparently positive rates of growth. The constant low ratio of increase in TFP seems to indicate that cotton yarn production in Bombay city failed to enhance efficiency by adjusting to necessary transactions, introducing new, more competent management system, technology, etc., which are represented by rates of TFP growth. In other words, cot-ton mills in Bombay failed to modify their corporate organizations in accordance with the changing transactions in the work process such as managing increasing number of workers (i.e. man-hours) and introducing more efficient technology (i.e. introduc-ing rintroduc-ing spindles in place of mule spindles).'9) It was such failure in transformintroduc-ing
cor-porate organizations and introducing new technology that caused the industry to fail in maintaining competitiveness on the international market and thus high ratios of positive growth.20)
The insufficient contribution of TFP on the growth of the industry can be seen clearly in the two decades of the 1890s (0.20 per cent annually) and 1910s ( -0.28 per cent annually). The unconstructive impact of negligible or negative TFP growth on the industry during those two decades presents several historically interesting im-plications when we take into consideration the context of the times. Firstly, the se-vere decline of annual growth of TFP from 3.88 per cent per annum in the 1880s to negligible in the 1890s seems to be the leading cause of decline in international com-petitiveness of Bombay cotton yarn during in the 1890s, as it began to lose foreign outlets in the decades in the face of severe competition with Japanese cotton yarn manufacturers. During this decade, production growth itself, represented by the con-sumption of raw cotton, shows only an annual growth of 2.78 per cent, compared to over 10.83 per cent in the previous decade. Negligible TFP growth rates obviously suggest that the cotton mills in Bombay experienced negligible progress in efficiency in management and production, possibly due to lack of adjustment to the changing market conditions or technological problems. No improvement in distribution or pro-duction efficiency was undoubtedly a substantial cause of the loss of foreign mar-kets.21)
Secondly, the claim here that negative TFP growth mainly accounted for the
stag-Source: BOMA.
Note: On definitions of each line, see Section 3.
Figure 4 Results of growth accounting analysis of cotton yarn companies in the Island of Bombay (three years average)
nation in the industry during the 1910s, when India was under war time economy, is quite different from the commonly held view that Indian cotton mills failed to grasp the opportunity to grow under the world-wide expansion of demand for Indian prod-ucts because they could not install additional spindles due to lack of supply of such equipment. It has also been argued that in addition to foreign restrictions on the ex-port of such production equipment to India, a leading cause of the equipment short-age was the laissez-faire economic policy adopted by the colonial government up to the first decade of the 1900s, which stifled (i.e. failed to protect and nurture) the growth potential of domestic production equipment industries before the outbreak of World War I [Bagchi 1972: Chapter 3].
The results of the present growth accounting analysis, however, indicate that a lack of production equipment explains only a minor part, at best, of the industry's stagna-tion during WWI. It is true that the Bombay cotton yarn mills did not increase their spindles during the 1910s to the extent of the previous decade; however, the growth ratio of spindles at work was still positive (0.34 per cent per annum), whereas the growth ratio of raw cotton consumed, a representative index for the growth of value added during the decade, is slightly negative ( -0.04 per cent per annum). As indi-cated by Figure 4, it was the negative growth of TFP ( -0.28 per cent per annum), not spindles, in addition to decreases in labour employment caused not by reduction in the workforce (which increased slightly by 1.4 per cent annually) but by a reduc-tion in work hours (from 14.5 to 12 hours per day due to the implementareduc-tion of the 1911 Indian Factory Act), that accounted for the largest part of the industry's set-backs during the decade.
The growth rate of TFP was severely negative during the 1920s ( -2.11 per cent per annum), while spindles at work and the workforce were significantly reduced ( -0.89 per cent per annum and -2.41 per cent per annum respectively), possibly due to reduction in the rate of operation of the mills (from 0.94 until the 1910s to 0.677 in the 1920s). The reduction in the rate of operation was largely due to sharp decline in demand for Bombay cotton yarn in the decade and subsequent retrench-ment measures sought by the mills to deal with the decrease in demand and relatively high wages in Bombay. This negative growth of labour, reduction in rate of operation and TFP jointly contributed to the declining production of cotton yarn in the decade.
The tide turned during the 1930s. TFP rates of growth increased by 4.22 per cent annually and growth rate of production increased by 2.12 per cent per annum in the decade. This was a decade when the workforce and spindles at work continued to decline largely due to reduction in working hours and gradual abolition of old spindles, though the effect of abolition of the old spindle was partly counterbalanced by the recovery in the rate of operation from 0.67 per cent in the 1920s to 0.88 in the 1930s. This means that the negative influences of rates of growth of workforce and spindle were fully counterbalanced by positive growth rate of TFP. The turn in the
tide was probably due to measures taken by each mill to improve resource allocation. This improvement consisted of not only labour retrenchment measures , but also the introduction towards the end of the 1920s of a scientific labour management system to standardize wages or the number of workers for specific tasks .22) The high growth rate of TFP during the 1930s must have been the result of such measures , though it was not sufficient to revive the competitive edge that Bombay had in the international market during the 1880s [Government of India 1940: 99-102; Morris 1965: Chapter 9; Chandavarkar 1994: Chapter 8].
4.2 The probable causes of negative TFP growth rates
The unfavourable growth of TFP for Bombay mills can be ascribed to such factors as maladjustment to inputs or outputs market, mis-allocation of labour, deterioration of skilled labour, and poor maintenance of production equipment. Among the various factors which must have had negative impact on the TFP growth rate during the pe-riod under study, we must put stress on poor management skills , or in recent
termi-nology, failures in "corporate governance" of large scale business enterprises ,
especially in managing large workforces.
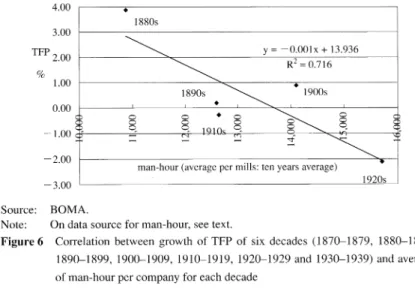
First, let us look at the industry-wide statistical evidence . Figure 5 shows "average number" of man-hours allocated to spindle operation by each company during the 76-year period (1865-1940).23) By comparing Figures 4 and 5 , we find that positive growth in the average number of man-hours per company negatively affected TFP growth from 1900 until the 1920s (see Figure 6), when the results of the standardiza-tion measures began to manifest.
Unfortunately, the statistical evidence to support our hypothesis based on sample regression analysis is still insufficient to derive a reliable implication , since number of sample is not amply enough. Furthermore, the analysis was conducted on an "av-erage" and not on a "concrete" corporate-base, obscuring the effects of negative TFP growth on yarn production and of workforce size on TFP growth at the corporate level. Therefore, we must examine the impact of man-hours on TFP growth rate based on statistical evidence at the corporate-level.
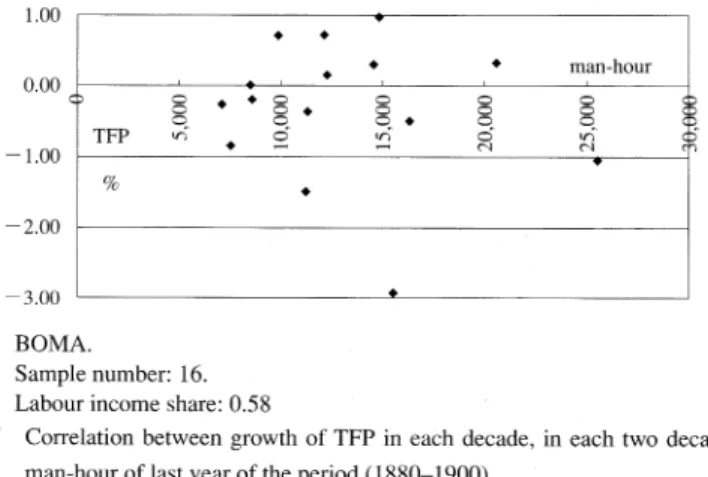
Figures 7, 8 and 9 show man-hours of the last years of 1880-1900, 1900-1920
and 1920-1940 respectively of each company operating in Bombay continuously dur-ing each twenty-year period and their TFP growth rates durdur-ing those periods.24) There is no apparent significant correlation during the 19th century when man-hours con-sumed by most of the companies were not yet large enough .25) However, when the number of man-hours increased during the following two periods , TFP growth rates tended to decrease in proportion to work-hour increase . For example, Figure 8 for
1900-1920 suggests that TFP growth of companies consuming more than 20 ,000
man-hours was much worse than those consuming less than 20 ,000 man-hours. In-deed, only three companies realized positive TFP growth among the eight companies
that consumed more than 20,000 man-hours, while 19 companies attained positive TFP growth among the total of 31 companies that consumed less than 20,000 man-hours. Why did high levels of man-hour consumption negatively influence TFP growth? It seems that mill production management in Bombay did not possess the ability to control large amounts of labour because they failed to establish an effective "corporate organization" to do so . This reduced the TFP growth rate, and resulted in the loss of the competitive edge of Bombay cotton yam at the beginning of the 20th century.
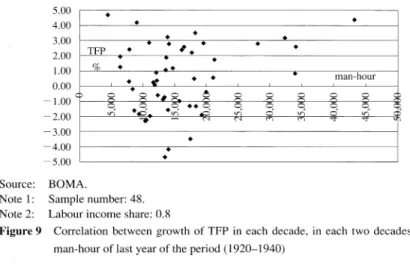
The negative influence of inefficient man-hour consumption by each company on TFP growth is indicated in a different context during the period of 1920-1940. Fig-ure 9 indicates that the negative correlation between man-hours per company in
Source: BOMA.
Figure 5 Average number of man-hour per company (three years average)
Source: BOMA.
Note: On data source for man-hour, see text.
Figure 6 Correlation between growth of TFP of six decades (1870-1879, 1880-1889, 1890-1899, 1900-1909, 1910-1919, 1920-1929 and 1930-1939) and average of man-hour per company for each decade
1900-1920 disappeared on the whole during the next two decades. On the basis of the statistical evidence for all the companies in Bombay, raw cotton consumption de-clined by 0.81 per cent annually, while man-hours and spindles declined by 2.96 per cent and 0.67 per cent respectively during the two decades. This means that TFP grew at the rate of 1.46 per annum when labour income share was 0.7. More importantly, Figure 9 suggests that the relatively lower TFP growth rates of companies consum-ing over 20,000 man-hours improved across the board during the next decades, a pe-riod when labour management began to be standardized and rationalized by scientific
Source: BOMA.
Note 1: Sample number: 16. Note 2: Labour income share: 0.58
Figure 7 Correlation between growth of TFP in each decade, in each two decades and man-hour of last year of the period (1880-1900)
Source: BOMA.
Note 1: Sample number: 39. Note 2: Labour income share: 0.58
Figure 8 Correlation between growth of TFP in each decade, in each two decades and man-hour of last year of the period (1900-1920)
labor management system. Therefore, it is appropriate to conclude that a consider-able part of the high TFP growth realized by yarn producers in Bombay can be at-tributed to transformation in corporate organization which was brought about by improvement in labour management skills of large size of man-hour.
4.3 Implications of the analysis
The above analysis strongly suggests that low or negative rates of TFP growth go a long way in explaining the loss of Bombay cotton yam's competitive edge and that those low or negative rates were essentially the result of failures to manage labour effectively. Although TFP growth was improved during the 1930 by standardizing wages and man-hours according to job type, such improvement in labour manage-ment were not enough to regain the international competitiveness that the Bombay cotton mills enjoyed as one of the leading industrial sectors of the Indian subconti-nent and Asia during the late 19th century.
Finally, some words are in order on the small size of the Bombay cotton mills in comparison with their counterparts in Great Britain, Japan and China as pointed out by many researchers. For instance, on the basis of the following average mill size in Japan, China and India in 1935, scholars like Lokanathan argue that small produc-tion scale was one of the causes of the Bombay mills' loss of competitive edge, since they failed to take advantage of the technological merits of scale [Lokanathan 1935].
Country Spindles Looms Labour
Japan 206,616 2,190 4,485
China 98,199 1,061 4,403
India 30,074 707 1,510
It is sometimes claimed that such smallness of scale in India reflected the lack of Source: BOMA.
Note 1: Sample number: 48. Note 2: Labour income share: 0.8
Figure 9 Correlation between growth of TFP in each decade, in each two decades and man-hour of last year of the period (1920-1940)
capital available to industrialists in Bombay. However, it is not easy to accept such a view, since there were many cases of a single managing agency running several small scale mills.26) It was possible for them to unite the small mills into one large mill if they saw the advantage in doing so. Rather than a shortage of capital, our examina-tion suggests that Bombay's small scale mills were the result of failures in corporate organization, for instance, to build up proper labour management system for manag-ing lager workforces more efficiently.
5. Growth accounting analysis of the Tata Iron and Steel Company
5.1 Results
Contrary to the cotton mills of Bombay, the only company to produce iron and steel in British India, TISCO, succeeded on the whole in enjoying stable develop-ment throughout the period. This section will attempt to explain what made it pos-sible for TISCO to achieve such exceptional growth under the colonial regime.
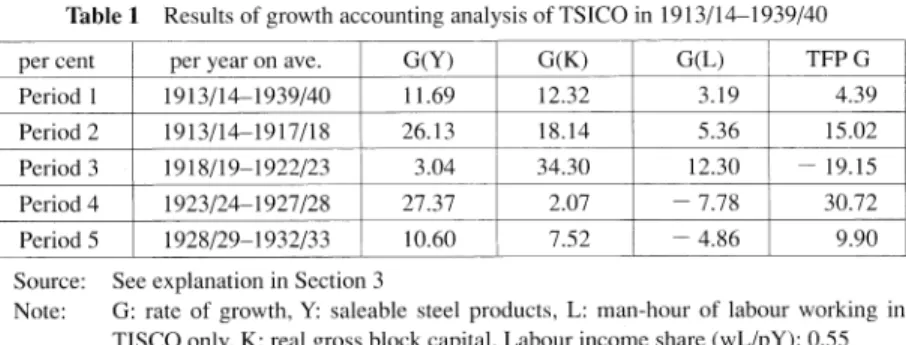
The results of our growth accounting analysis, which is divided into four periods, may be summarized as follows. To begin with, Period 1 in Table 1 covers a total of 27 years for our analysis from 1913/14 to 1939/40. The results for Period 1 indicate that the growth of block capital was the most important factor, explaining 47.4% of TISCO's production growth during the period. The table also indicates that high TFP growth, accounting for 37.5% of TISCO's growth in production, was the second most significant factor explaining TISCO's successful development during that period. Since TFP includes factors such as economies of scale, technological innovation and improvement in resource allocation efficiency, the results for Period 1 suggest that TISCO was able to grow during that period through continuous efforts to raise effi-ciency in both management and production.
Thus, the growth of block capital and TFP jointly explain almost 85% of the growth in TISCO's added value. These result support the assumptions of other growth accounting analyses that capital formation and TFP have gone hand in hand as the major sources of growth in modernized economies.27)
In order to explain such high TFP growth rates, let us look at what happened to resource allocation at TISCO and the types of technological equipment that the firm adopted. Since accumulation of block capital played an important role in the devel-opment of the company, knowing exactly how TISCO succeeded in this area is also necessary to clearly understand its development.
Period 2 of Table 1 (1913/14 to 1917/18) was a time when TISCO had the natural protection provided by the outbreak of World War I and enjoyed steady growth. Al-though it was still only pig iron that TISCO was producing with sufficient interna-tional competitiveness, while the cost of its steel production was somewhat higher than other leading producers, the internationally uncompetitive steel was sold
domes-tically under the natural protection provided by the War, and allowed TISCO the op-portunity to accumulate the necessary skill and knowledge to survive the following period. Table 1 implies that almost 57% of the growth attained during this period can be explained by high rates of TFP growth, represented by the accumulation of steel production know-how, while block capital explains just 31.2% in real terms. In this initial period of steel production for TISCO, the company increased yield through learning-by-doing with its originally installed production equipment before 1913/14, except for minor alternations like the introduction of a by-product coke oven, bar mills, power house and sleeper foundry. It was this learning-by-doing effort that en-abled the high rates of TFP under the natural protection of the War.
Period 3 of Table 1 (1918/19 to 1922/23) is an epoch-making period in the history of TISCO and, possibly, in the economic history of India as well, for it was a time when the company started its first full scale efforts to surmount the non-competitive-ness of its steel and launch the first fully-fledged heavy industrial venture in India. This attempt involved more than 5 times the workforce and block capital employed by TISCO during the 1910s or by any existing leading light industrial enterprise, like jute or cotton mills, at that time. It required specific types of corporate organization to coordinate and monitor the transactions necessary for a large scale modernized heavy industrial enterprise, in addition to amassing a huge amount of fixed capital to realize the technological merits of scale essential for gaining competitiveness in steel making.28)
The most noteworthy achievements of TISCO during Period 3 were 1) expanding steel production capacity to enjoy technological merits of scale, thus leading to inter-national competitiveness; and 2) installing a new type of steel furnace, the "duplex furnace" with two 25-ton Bessemer converters, thus technologically enhancing pro-duction efficiency. The fact that TISCO drastically expanded block capital and raised production capacity is clearly seen in its high growth rate of capital formation during the period. Table 1 indicates that TISCO increased both its expenditures for capital formation and rate of operation (from 0.65% per annum to 0.80% per annum); and
Table 1 Results of growth accounting analysis of TSICO in 1913/14-1939/40
Source: See explanation in Section 3
Note: G: rate of growth, Y: saleable steel products, L: man-hour of labour working in TISCO only, K: real gross block capital. Labour income share (wL/pY): 0.55
both figures collectively resulted in a growth rate as high as 34.3% annually for the five years, turning the company into an industrial concern worth more than Rs.2000 lakhs by the mid-1920s. The fixed capital amounted to almost 20 times that of other industrial ventures at the time, such as the cotton mills of Bombay or the jute mills of Calcutta which had been financed with approximately Rs.100 lakhs on average.
TISCO's management had initially intended to turn to the open money market to raise the necessary block capital, but the costs were high due to serious failures in the functioning of capital markets and a lack of feasible government regulation to improve the situation [Thomas 1948]. So they decided to set aside depreciation and a reserve fund as the essential source of the company's capital formation, in spite of the fact that the decision would inevitably reduce the payment of dividends to share-holders. The share of depreciation and reserves allocated for total fixed block capital sharply increased from 3% in 1914/15 to 14% in 1917/18. Although there was a tem-porary cooling down period during the early 1920s when TISCO suffered from the severe deflation of steel prices, the share began to increase again when TISCO recov-ered from the temporary crisis and reached 30% in 1931/32 and 47% in 1938/39.29)
During that time (and probably even today) accumulating depreciation at the cost of reducing dividends was not a popular strategy among Indian industrial concerns , since most of their directors were large shareholders. Some scholars claim that this negative attitude has been leading cause of the serious difficulty in gathering suffi-cient amounts of block capital for heavy industrial ventures in India and the limited growth of Indian industrial development to date [Mukherjee Reed 2001]. Despite the general negative attitude toward this practice, the TISCO management decided to cre-ate "an internal financing system (or strcre-ategy)" for the purpose of expanding produc-tion equipment, a system that provided the company with a stable source of necessary fixed capital and a firm footing for the Tata family to consolidate a powerful position in the Indian economy and political sphere, not only during the colonial period but after independence as well.
Here, it should be noted that the high growth rates of capital formation were fully counterbalanced by negative TFP growth during the period. In fact, production growth was quite low during Period 3, despite the fact that another leading input, labour, also contributed positively to production. Negative TFP growth probably indicates that some existing corporate institutions failed to coordinate or monitor newly expanded and complicated transactions to allow enlarged and technologically advanced produc-tion capacity to be realized smoothly. Attempts at overcoming such organizaproduc-tional failure become the leading factor in production growth during Period 4 (1923/24-1927/28) of Table 1, as evidenced by the extremely high TFP growth rates. Reforms conducted in areas such as sales, purchases of inputs, labour management, job train-ing/vocational education, accounting methods, welfare and town administration were indeed essential to secure the sound operation of an enlarged production capacity. As
far as TISCO was concerned, two corporate areas played especially significant roles in surmounting the failures of the previous period: the development of its sales de-partment and the transformation of its labour management system. This was because the exploration of additional, stable outlets for steel, especially among the Indian "masses"
, was a prerequisite for enjoying economies of scale, while increases in the workforce to man expanded production equipment required a better organized, sys-tematic and efficient labour management system. Attempts by TISCO to introduce its own sales depots, stockyards and exclusive dealerships, and the establishment of a Labour Employment Bureau, the Tata Technical Institute, as well as a welfare office during the first half of the 1920s collectively made it possible for the company to improve resource allocation and raise TFP growth rates.3°)
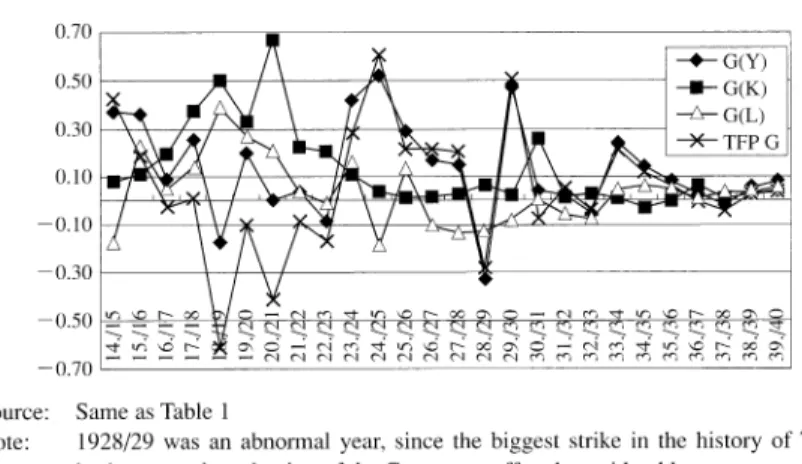
This gradual and sound development nevertheless slowed down in the 1930s (see Figure 10). It is true that TISCO's production of saleable steel increased almost 50% during this decade, as seen in Figure 1, but such growth was merely keeping pace with the increasing rate of domestic demand, as TISCO's share in the steel market did not improve (see Figures 2 and 3). The rise in market share during this period might have been checked by the fact that gross block increased only by a small de-gree, as shown in Figure 10, when domestic demand for steel was expanding at a high pace. Why TISCO did not further expand production capacity and attempt to raise its share of the market is an interesting question, because this was a decade dur-ing which the company earned considerable gross profits (e.g. gross profit-gross block capital ratio and dividend-gross profit ratio were 7.2% and 60.2% on average respec-tively throughout the 1930s, compared to 3.5% and 11.5% during the previous dec-ade3D). So there must have been sufficient internal funds to raise block capital if so desired. This, however, is an issue for future investigation.
Source: Same as Table 1
Note: 1928/29 was an abnormal year, since the biggest strike in the history of TISCO broke out and production of the Company suffered considerably.
5.2 Implications of the analysis
The above analysis clearly indicates, first of all, that high rates of TFP growth played an essential role in the development of TISCO. Without such high growth in TFP, which was the result of increase in resource allocation efficiency and the intro-duction of more efficient prointro-duction equipment, it would have been difficult for TISCO to achieve the sustained development it enjoyed in the first half of the 20th century. Our analysis supports the commonly held view of the institutionalist schools in economics and business history that corporate organization and technological in-novation play essential roles in the development of modem industrial ventures.
The analysis also suggests that the conventional explanation of TISCO's excep-tional growth as based on a favourable relationship between the colonial government and the Tata family should be reconsidered. It has been argued that TISCO achieved such high rates of growth owing to its success in gaining the favour of the colonial government in areas such as protective tariffs and/or favourable access to natural re-sources like iron are and coal. Those who hold this view also claim that the Tata fam-ily members were typical Indian capitalists who by virtue of drawing great advantage from such governmental favour thus stood on the side of the colonial regime against the independence movement [Markovits 1985]. However, I think that this section am-ply shows that the essential factors in realizing such exceptional growth at TISCO were its high TFP growth rate as the result of improvements in corporate organiza-tion, like its sales department and labour management system, and huge capital accu-mulation realized through depreciation. It was not due to government favour, though it cannot be denied that government policy might have had some positive effects on TFP growth and the company's development. The present analysis suggests that it was the performance of corporate institutions that really mattered in achieving steady development and prosperity at TISCO, and any positive or negative influence of gov-ernment policy on the company's development must be assessed in terms of their ef-fects on the performance of corporate institutions.
6. Conclusion
This paper argues on the basis of growth accounting analysis that the total factor productivity performance explains much of the stagnation suffered by the cotton yarn producers of Bombay and the steady growth of the only heavy industrial concern, TISCO's during the British colonial period. It also asserts that corporate organization-al moves like the introduction of standardized wages at the cotton mills of Bombay and the establishment of the Labour Employment Bureau and exclusive dealership by TISCO undoubtedly played major roles in raising their respective rates of TFP, though we cannot deny the influences of other factors on TFP growth, such as the employment of more efficient technology suited to the resource endowments of India