研究成果の刊行に関する一覧表 雑誌
発表者氏名 論文タイトル名 発表誌名 巻号 ページ 出版年 Yamada S., Kubo Y.,
Yamazaki D., Sekino Y., Nomura Y., Yoshida S., Kanda Y.
Tributyltin Inhibits Neural Induction of Human Induced Pluripotent Stem Cells.
論文投稿中
Yamada S., Yamazaki D., Kanda Y.
5-Fluorouracil inhibits neural induction via Mfn1/2 reduction in human induced pluripotent stem cells.
論文投稿中
Yamada S., Kubo Y., Yamazaki D., Sekino Y., Kanda Y.
Chlorpyrifos inhibits neural induction via Mfn1-mediated mitochondrial dysfunction in human induced pluripotent stem cells.
Sci Rep. 7 40925 2017
Yamazaki D., Kanda Y., Sekino Y.
Field potential recording method using multi-electrode array system-Cellular responses in human iPSC-derived cardiomyocytes and rodent brain- derived neurons-.
BUNSEKI 7 290-295 2017
Mabuchi H., Ong HY., Watanabe K., Yoshida S., Hozumi N.
Visualization of Spatially Distributed Bioactive Molecules Using Enzyme- Linked Photo Assay.
IEEJ Trans FM. 136 99-104 2016
Takanashi K., Washiya M., Ota K., Yoshida S., Hozumi N., Kobayashi K.
Quantitative evaluation method for differentiation of C2C12 myoblasts by ultrasonic microscopy.
Jpn J Appl Phys. 56 07JF11 2017
Tiong TKS., Chean TW., Yamada H., Takahashi K., Hozumi N., Kobayashi K., Yoshida S.
Effects of anticancer drugs on glia–
glioma brain tumor model characterized by acoustic impedance
microscopy.
Jpn J Appl Phys. 56 07JF15 2017
Fueta Y., Sekino Y., Yoshida S., Kanda Y., Ueno S.
Prenatal exposure to valproic acid alters the development of
excitability in the postnatal rat hippocampus.
Neurotoxicology 65 1-8 2018
Zhang W., Qian L., Lambertini L., Finik J.,
Huang Y., Tsuchiya KJ., Pehme P., Buthmann J., Yoshida S., Chen J., Nomura Y.
Timing of Prenatal Exposure to Trauma and Altered Placental Expressions of HPA-Axis Genes and Genes Driving Neurodevelopment.
J
Neuroendocrinol .
in press 2018
Fueta Y., Ishidao T., Ueno S., Yoshida Y., Kanda Y., Hori H.
Prenatal exposure to 1-bromopropane causes delayed adverse effects on hippocampal neuronal excitability in the CA1 subfield of rat offspring.
J Occup Health. 60 74-79 2018
- 45 -
Urushiyama D., Suda W., Ohnishi E., Araki R., Kiyoshima C., Kurakazu M., Sanui A., Yotsumoto F., Murata M., Nabeshima K., Yasunaga S., Saito S., Nomiyama M., Hattori M., Miyamoto S., Hata K.
Microbiome profile of the amniotic fluid as a predictive biomarker of perinatal outcome.
Sci Rep. 7 12171 2017
Kawai T., Hata K. Reproductive/Developmental
Abnormalities Induced by Epigenetic Aberrations and Possible Environmental Causes.
Nihon Eiseigaku
Zasshi. 71 195-199 2016
Ito Y., Maehara K., Kaneki E., Matsuoka K., Sugahara N., Miyata T., Kamura H., Yamaguchi Y., Kono A., Nakabayashi K., Migita O., Higashimoto K., Soejima H., Okamoto A., Nakamura H., Kimura T., Wake N., Taniguchi T., Hata K.
Novel Nonsense Mutation in the NLRP7 Gene Associated with Recurrent Hydatidiform Mole.
Gynecol Obstet Invest.
81 353-358 2016
Nohara K., Okamura K., Suzuki T., Murai H., Ito T., Shinjo K., Takumi S., Michikawa T., Kondo Y., Hata K.
Augmenting effects of gestational arsenite exposure of C3H mice on the hepatic tumors of the F2 male offspring via the F1 male offspring.
J Appl Toxicol. 36 105-112 2016
Kawai T., Yamada T., Abe K., Okamura K., Kamura H., Akaishi R., Minakami H., Nakabayashi K., Hata K.
Increased epigenetic alterations at the promoters of transcriptional regulators following inadequate maternal gestational weight gain.
Sci Rep. 5 14224 2015
- 46 -
1
Scientific RepoRts | 7:40925 | DOI: 10.1038/srep40925
www.nature.com/scientificreports
Chlorpyrifos inhibits neural induction via Mfn1-mediated mitochondrial dysfunction in human induced pluripotent stem cells
Shigeru Yamada1,2, Yusuke Kubo1, Daiju Yamazaki1, Yuko Sekino1 & Yasunari Kanda1 Organophosphates, such as chlorpyrifos (CPF), are widely used as insecticides in agriculture. CPF is known to induce cytotoxicity, including neurodevelopmental toxicity. However, the molecular mechanisms of CPF toxicity at early fetal stage have not been fully elucidated. In this study, we examined the mechanisms of CPF-induced cytotoxicity using human induced pluripotent stem cells (iPSCs). We found that exposure to CPF at micromolar levels decreased intracellular ATP levels. As CPF suppressed energy production that is a critical function of the mitochondria, we focused on the effects of CPF on mitochondrial dynamics. CPF induced mitochondrial fragmentation via reduction of mitochondrial fusion protein mitofusin 1 (Mfn1) in iPSCs. In addition, CPF reduced the expression of several neural differentiation marker genes in iPSCs. Moreover, knockdown of Mfn1 gene in iPSCs downregulated the expression of PAX6, a key transcription factor that regulates neurogenesis, suggesting that Mfn1 mediates neural induction in iPSCs. Taken together, these results suggest that CPF induces neurotoxicity via Mfn1-mediated mitochondrial fragmentation in iPSCs. Thus, mitochondrial dysfunction in iPSCs could be used as a possible marker for cytotoxic effects by chemicals.
Growing evidence suggests the involvement of environmental chemicals in neurodevelopmental toxicity, lead- ing to neurobehavioral outcomes such as learning disabilities, attention deficit hyperactivity disorder, cognitive impairment, and autism1,2. As the fetal brain is inherently more susceptible to chemical-induced toxicity com- pared to the adult brain, exposure to neurotoxic chemicals during early prenatal period can cause delayed neural disorders at lower doses than in adults3,4.
Organophosphates, such as chlorpyrifos (CPF), are well known to affect brain structure and neurodevel- opmental outcome, resulting in delayed neural disorders5,6. In regard to this, previous studies using magnetic resonance imaging have shown that prenatal exposure to CPF caused abnormalities in the structure, size, and thickness of cerebral cortex, where was responsible for several higher-order brain functions such as attention, cognition, and emotion7. Several reports indicate that CPF causes neurotoxicity in the developing brain of ani- mals. In the developing brain of neonatal rats, CPF exposure impairs neurite outgrowth by inhibiting choline acetyltransferase activity8. Maternal exposure to CPF suppresses neurogenesis in the hippocampal dentate gyrus of rat offspring9. In addition to in vivo effects, there has been reported the cytotoxic effects of micromolar CPF levels in vitro. For example, CPF inhibited mitochondrial oxidative phosphorylation10 and induced apoptosis in human neuroblastoma SH-SY5Y cells11 or human neural precursor cells12. As micromolar CPF levels were detected in the blood of human newborns living in an agricultural community13, the observations made using micromolar levels of CPF in vitro could potentially reflect the biological reactions in a living body. However, the effect of CPF on neurodevelopment has not been precisely elucidated.
1Division of Pharmacology, National Institute of Health Sciences, Tokyo, Japan. 2Pharmacological Evaluation Institute of Japan (PEIJ), Kanagawa, Japan. Correspondence and requests for materials should be addressed to Y.K.
(email: [email protected]) received: 21 October 2016
accepted: 13 December 2016 Published: 23 January 2017
OPEN
- 47 -
www.nature.com/scientificreports/
2
Scientific RepoRts | 7:40925 | DOI: 10.1038/srep40925
Morphological changes of mitochondria are known to contribute to homeostasis14,15. Under normal cir- cumstances, mitochondria fuses together and forms excessive tubular networks (mitochondrial fusion). These fusion is regulated by fusion factors mitofusin 1 and 2 (Mfn1, Mfn2) and optic atrophy 1 (Opa1)16,17. In contrast, under stress conditions, mitochondrial networks convert into large numbers of small fragments with spherical and punctate morphology (mitochondrial fission), and are regulated by fission factors, such as fission protein 1 (Fis1) and dynamin-related protein 1 (Drp1)18,19. This morphological dynamics contributes to the maintenance of mitochondrial functions, including energy generation14. Moreover, several studies have shown the relationship between mitochondrial fragmentation and cellular and neurodevelopmental defects. For example, Mfn1 or Mfn2 knockout mice die in midgestation embryo, accompanying with developmental delay. In addition, embryonic fibroblasts from these knockout mice display distinct types of fragmented mitochondria, a phenotype due to a severe reduction in mitochondrial fusion20. Thus, Mfn1 is considered to be functionally different from Mfn2.
In support to this, Mfn1, not Mfn2, is reported to contribute to Opa1-mediated fusion of mitochondrial inner membrane16.
In the present study, we investigated the effect of CPF on neural differentiation using human induced pluripo- tent stem cells (iPSCs) as a model of human organ development. We focused on the effects of micromolar levels of CPF on mitochondrial dynamics, examining the molecular mechanisms of the process. Our results show that micromolar CPF levels inhibited ATP production through Mfn1 reduction, followed by mitochondrial fragmen- tation. Moreover, Mfn1-mediated mitochondrial dysfunction suppressed early neural induction by decreasing levels of PAX6, a key transcription factor that regulates neurogenesis. These data suggest that CPF-induced neu- rodevelopmental toxicity is based on impairment of mitochondrial functions in human iPSCs.
Results
Effect of CPF on neural differentiation of iPSCs. To investigate whether CPF affects early neurodevel- opment, we examined neural differentiation capability of iPSCs, which was induced by dual SMAD inhibition protocol21 (Fig. 1A). First, we determined the critical CPF concentration, affecting neural differentiation. At day 4 after neural induction with different concentrations of CPF, the expression of PAX6, an early neuroectodermal marker that regulates neurogenesis22, was analyzed using real-time PCR. We found that exposure to 30 μ M CPF significantly decreased PAX6 gene expression (Fig. 1B). Next, we performed time course experiments for expres- sion of several neural differentiation markers at days 2, 4, 6, and 8 after exposure to 30 μ M CPF. At day 9, almost all cells exposed by CPF (30 μ M) were detached from the culture dish. Real-time PCR analysis revealed upreg- ulated expression of PAX6 by day 4, and FOXG1, a neuroectodermal marker that also regulates neurogenesis23, thereafter (Fig. 1C and D). Representative neural maturation marker NCAM124 continuously increased, confirm- ing that further neural differentiation occurred (Fig. 1E). In addition, CPF exposure reduced the expression of these neural induction markers by day 6 (Fig. 1C–E). These data suggest that CPF has an inhibitory effect on early neural differentiation of iPSCs.
Mitochondrial function of iPSCs exposed to CPF. As neural differentiation process requires ATP as a source of energy25, we examined intracellular ATP content in iPSCs. Treatment with 30 μ M CPF signifi- cantly reduced the ATP content of the cells (Fig. 2A). We have previously shown that 0.1 μ M carbonyl cyanide m-chlorophenyl hydrazone (CCCP), which functions as a mitochondrial uncoupler26, decreased ATP levels in iPSCs. Because CPF inhibited ATP production, we focused on several mitochondrial functions. Mitochondrial membrane potential (MMP) was decreased by exposure to 30 μ M CPF for 24 h (Fig. 2B and C). As a positive control, exposure to 0.1 μ M CCCP reduced MMP (Figure S1). In addition, CPF exposure increased the number of cells with fragmented mitochondria displaying punctate morphology (Fig. 2D) and decreased the number of cells exhibiting mitochondrial fusion (Fig. 2E). We have already confirmed that 0.1 μ M CCCP also increased the occurrence of fragmented mitochondria. These results suggest that CPF induces mitochondrial dysfunction, including MMP depolarization and mitochondrial fragmentation, in iPSCs.
Expression of mitochondrial fission and fusion factors in iPSCs exposed to CPF. To examine the molecular mechanisms by which CPF induces mitochondrial fragmentation in iPSCs, we assessed the expression levels of mitochondrial fission (Fis1 and Drp1) and fusion genes (Mfn1, Mfn2, and OPA1). Real-time PCR analy- sis showed that the gene expression of the factors was not altered after CPF exposure (Fig. 3A). Interestingly, west- ern blot analysis revealed that CPF significantly decreased Mfn1 protein levels. In contrast, protein expression levels of other factors, including Mfn2, were not changed (Fig. 3B and C). These data suggest that CPF-induced mitochondrial fragmentation is caused by reduction of Mfn1 protein levels.
Effects of CPF in iPSC-derived neural progenitor cells. To investigate whether the effects of CPF selec- tively occur in the early stage of neural differentiation in iPSCs, we used iPSC-derived neural progenitor cells (NPCs), which were induced by dual SMAD inhibition protocol21 (Figure S1A). Treatment with 30 μ M CPF had little effect on ATP content (Figure S1B). Similarly, exposure to 30 μ M CPF had little effect on mitochondrial morphology (Figure S1C and D), which was confirmed by the fact that CPF did not alter the protein levels of mitochondrial fission and fusion factors containing Mfn1 (Figure S1E). These data suggest that iPSCs, not NPCs, are sensitive to CPF exposure.
Effect of Mfn1 knockdown on neural induction of iPSCs. To further investigate the involvement of Mfn1 in the effects of CPF on neural induction, we performed knockdown (KD) of Mfn1, using lentivirus-delivered shRNAs. Real-time PCR analysis showed that KD was selective for Mfn1, not Mfn2, and that the efficiency was approximately 70% (Fig. 4A). The KD effects were also confirmed by protein levels (Fig. 4B and C).
The Mfn1 KD cells were used to perform neural induction. Real-time PCR analysis revealed that Mfn1 KD
- 48 -
www.nature.com/scientificreports/
3
Scientific RepoRts | 7:40925 | DOI: 10.1038/srep40925
decreased the expression of PAX6 (day 4), FOXG1 (day 6) and NCAM1 (day 6) (Fig. 4D). These data suggest that Mfn1 is involved in CPF-mediated negative effects on neural induction of iPSCs.
Negative regulation of neural induction by CPF exposure. A previous report indicates that ERK signaling inhibits neural induction via PAX6 silencing in human embryonic stem cells27. ERK has been reported to be activated after depletion of Mfn128. We focused on ERK signaling in the effect of CPF on neural induction.
Figure 1. Time course studies of neural induction in iPSCs exposed to CPF. (A) Schematic time course of induction from iPSCs to NPCs by dual SMAD inhibition. Neural induction was initiated after exposure to CPF for 24 h. The cells were continuously exposed to CPF throughout neural differentiation. (B) At day 4 after neural induction with CPF (0–30 μ M), expression of the neural differentiation marker PAX6 was examined using real- time PCR analysis. (C–E) At days 2, 4, 6, and 8 after neural induction with CPF (30 μ M), expression of neural differentiation markers, PAX6, FOXG1, and NCAM1 was examined using real-time PCR analysis. Data are represented as means ± SD (n = 3). *P < 0.05.
- 49 -
www.nature.com/scientificreports/
4
Scientific RepoRts | 7:40925 | DOI: 10.1038/srep40925
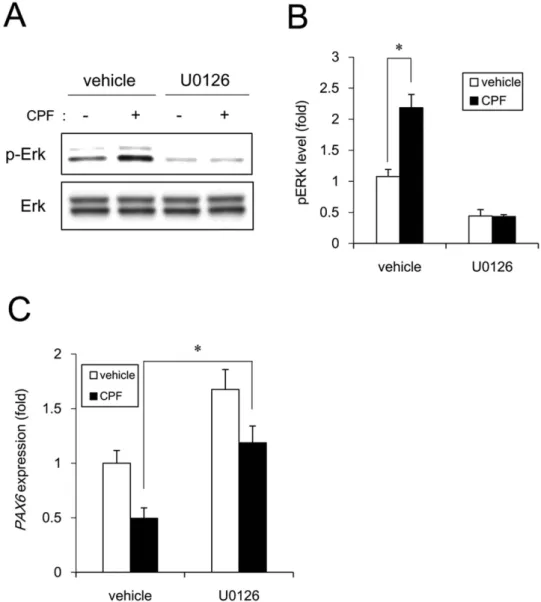
We found that CPF exposure significantly increased basal ERK phosphorylation levels, which were abolished by treatment with the ERK inhibitor U0126 (Fig. 5A and B). To further study whether PAX6 downregulation in CPF-exposed cells occurred through ERK signaling, we examined the effect of U0126 on PAX6 expression.
Incubation with U0126 recovered the expression levels of PAX6 (Fig. 5C). These data suggest that CPF activates ERK and prevents neural induction via PAX6 downregulation.
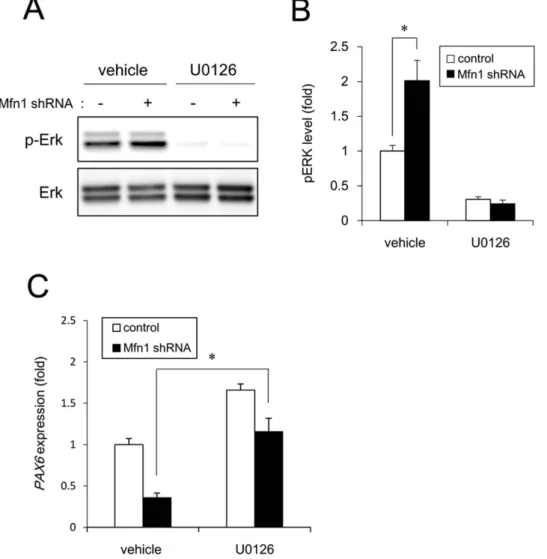
Effect of Mfn1 knockdown on neural induction. To confirm the involvement of Mfn1 in the inhibition of neural induction by CPF, we used Mfn1 KD cells. Mfn1 KD significantly increased basal ERK phosphoryl- ation levels that were abolished by treatment with the ERK inhibitor U0126 (Fig. 6A and B). To further study Figure 2. Mitochondrial function of iPSCs exposed to CPF. (A) Cells were exposed to CPF (30 μ M) for 24 h. Intracellular ATP content was determined in the lysed cells (n = 3). (B) Cells were exposed to CPF for 24 h and stained with JC-10 for 20 min. MMP of JC-10 labeled cells was analyzed by flow cytometry.
The histogram represents the ratio of JC-aggregate (F-590) to JC-monomer (F-535) fluorescence (n = 3).
(C) Cells were exposed to CPF for 72 h and stained with MitoTracker Red CMXRos and Hoechst33342.
Mitochondrial morphology was observed by confocal laser microscopy. Bar = 5 μ m. (D) The number of cells with mitochondrial fusion (< 10% punctiform) was determined in each image (n = 5). Data are represented as means ± SD. *P < 0.05.
- 50 -
www.nature.com/scientificreports/
5
Scientific RepoRts | 7:40925 | DOI: 10.1038/srep40925
whether PAX6 downregulation in Mfn1 KD cells occurred through ERK signaling, we examined the effect of U0126 on PAX6 expression. Mfn1 KD decreased PAX6 by 64% by in the vehicle-treated cells. In contrast, Mfn1 KD decreased PAX6 by 30% in the U0126-treated cells. Thus, incubation with U0126 partially recovered the PAX6 expression in the Mfn1 KD cells (Fig. 6C). Taken together, these data suggest that Mfn1 reduction by CPF exposure activates ERK and prevents neural induction via PAX6 downregulation.
Discussion
In the present study, we demonstrated that exposure to micromolar CPF targeted mitochondrial quality control in human iPSCs. We showed that CPF induced Mfn1 reduction, thereby promoting mitochondrial fragmenta- tion. These negative effects of CPF on mitochondrial quality control could suppress ATP production and neural Figure 3. Expression of mitochondrial fission and fusion factors of iPSCs exposed to CPF. (A) After exposure to CPF (30 μ M) for 24 h, expression of mitochondrial genes was analyzed by real-time PCR. (B) After exposure to CPF for 24 h, expression of mitochondrial proteins was analyzed by western blotting using anti- Drp1, anti-Fis1, anti-Mfn1, anti-Mfn2, anti-Opa1, or anti-β -actin antibodies. (C) Relative densities of bands were quantified with ImageJ software. Relative changes in expression were determined by normalization to β -actin. Data are represented as means ± SD (n = 3). *P < 0.05.
- 51 -
www.nature.com/scientificreports/
6
Scientific RepoRts | 7:40925 | DOI: 10.1038/srep40925
differentiation. Based on the data observed in our study, Fig. 7 shows a proposed mechanism of CPF cytotoxicity via mitochondrial dysfunction.
Our studies showed that treatment with micromolar CPF levels caused mitochondrial dysfunction of human iPSCs (Fig. 2). We observed that iPSCs were sensitive to CPF exposure, unlike iPSC-derived NPCs (Figure S1).
Previous reports support this difference in CPF sensitivity. The inhibitory effect of CPF on DNA synthesis in undifferentiated C6 glioma cells is found to be much higher than in differentiated cells29. In vivo studies indicate that immature organisms are more susceptible to CPF-induced toxicity compared to adults due to lower levels of CPF metabolizing enzymes30. Thus, the difference in CPF sensitivity between iPSCs and NPCs may be dependent on the maturation of CPF detoxification pathways. We are currently conducting experiments to determine the mechanism causing the differences in sensitivity to CPF.
We showed that CPF induced mitochondrial fragmentation via Mfn1 reduction (Figs 2 and 3). Consistent with this, our previous knockdown studies indicated that Mfn1 reduction was sufficient to promote mitochon- drial dysfunction31. CPF-induced Mfn1 reduction might mediate mitochondrial fragmentation, decrease ATP levels, and inhibit iPSC growth. Although Mfn2 is also involved in mitochondrial fission and energy supply processes32,33, our results indicated that CPF specifically targeted Mfn1, not Mfn2. Regarding this apparent CPF specificity, E3 ubiquitin ligase membrane-associated RING-CH 5 (MARCH5) has been reported to selectively bind to Mfn1 dependent on its acetylation, and degrade among all mitochondrial proteins, including Mfn234. In addition, we have reported that organotin compounds induced Mfn1 degradation through MARCH5, Figure 4. Effect of Mfn1 knockdown on neural induction of iPSCs. Cells were infected with lentiviruses containing a vector encoding a shRNA directed against Mfn1 or a scrambled sequence shRNA (control) for 24 h.
The infected cells were subjected to selection with puromycin (1 μ g/ml) for 24 h and cultured for an additional 72 h prior to functional analyses. (A) The expression of Mfn1 and Mfn2 genes was analyzed by real-time PCR.
(B) The expression of Mfn1 and Mfn2 proteins was analyzed by western blotting using anti-Mfn1, anti-Mfn2, or anti-β -actin antibodies. (C) Relative densities of bands were quantified with ImageJ software. Relative changes in expression were determined by normalization to β -actin. (D) Expression of neural differentiation markers PAX6 (day 4), FOXG1 (day 6), and NCAM1 (day 6) was examined with real-time PCR. Data are represented as means ± SD (n = 3). *P < 0.05.
- 52 -
www.nature.com/scientificreports/
7
Scientific RepoRts | 7:40925 | DOI: 10.1038/srep40925
thereby promoting mitochondrial fragmentation in iPSCs31. Thus, CPF may specifically target Mfn1 protein via MARCH5 in iPSCs without affecting mRNA levels. Furthermore, the difference in CPF sensitivity between iPSCs and NPCs may be dependent on Mfn1 and MARCH5 expression levels or MARCH5 activity. Further studies should determine whether CPF reduces Mfn1 via MARCH5-mediated degradation in iPSCs.
We demonstrated that ERK phosphorylation mediated the negative effects of CPF on early neural differentia- tion (Figs 1, 4 and 5). A previous report indicates that Mfn1 directly binds Ras and Raf, resulting in the inhibition of Ras-Raf-ERK signaling by the biochemical analysis35,36. Mfn1 reduction by CPF or shRNA may reverse this ERK signaling inhibition. Mobilization of Ca2+ from intracellular stores, including mitochondria was reported to result in phosphorylation of MAPKs, as the process was suppressed by chelation of intracellular Ca2+ in human T lymphoblastoid cells37. As mitochondria are known to uptake into the matrix of any Ca2+ that has accumulated in the cytosol, dependent on MMP38, mitochondrial dysfunction by CPF exposure may cause an overload of Ca2+, resulting in ERK activation. Moreover, ERK signaling was reported to inhibit neural induction by PAX6 silenc- ing via upregulation of stemness factors NANOG/OCT4 and downregulation of homeobox transcription factor OTX227. NANOG and OCT4 act as repressors of PAX6 induction, whereas OTX2 is a positive inducer of PAX627. Therefore, ERK signaling evoked by CPF could affect the expression of these transcriptional network, including NANOG, OCT4 and OTX2, by regulating PAX6. In future studies, we should further investigate the mechanisms of CPF-induced negative regulation of neural induction via ERK.
Figure 5. Negative regulation of neural induction by CPF exposure. (A) Cells were exposed to CPF (30 μ M) or CPF + U0126 (5 μ M) for 24 h. ERK phosphorylation was analyzed by western blotting using anti-phospho- ERK antibodies. (B) Relative densities of bands were quantified with ImageJ software. Relative changes in expression were determined by normalization to total ERK protein level. (C) At day 4 after neural induction with CPF or CPF + U0126, the expression of PAX6 gene was analyzed by real-time PCR. Data are represented as means ± SD (n = 3). *P < 0.05.
- 53 -
www.nature.com/scientificreports/
8
Scientific RepoRts | 7:40925 | DOI: 10.1038/srep40925
We further demonstrated that Mfn1 reduction mediated cytotoxic effects of CPF on iPSCs via PAX6 down- regulation (Figs 5 and 6). FOXG1 was downregulated, along with PAX6, during neural differentiation of iPSCs exposed to CPF. PAX6 and FOXG1 act as transcriptional regulators during forebrain development in verte- brates39,40. Targeted disruption of PAX6 and FOXG1 in rodents led to the loss of anterior neural tissues, suggesting the central role of these genes in forebrain development41,42. CPF causes various defects in the development of hippocampus and cortex of rodents43. Thus, CPF-induced defects of forebrain architecture may be caused by transcriptional silencing of anterior neural markers during early neurogenesis. As NCAM1 was downregulated during neural differentiation of iPSCs exposed to CPF, further studies using NPCs are required to reveal how CPF affects neural maturation processes.
In summary, our results demonstrate a novel mechanism underlying cytotoxicity, including neurodevelop- mental toxicity of CPF in iPSCs. Recently, significant progress has been made in the induction of differentiation of pluripotent stem cells into a variety of cell types44. Further studies are needed to evaluate the developmental effects of CPF on various types of iPSC-derived cells. Moreover, we show that CPF toxicity is caused by Mfn1-mediated mitochondrial dysfunction, which is involved in the cytotoxicity of organotin compounds31. Thus, mitochondrial functions influenced by Mfn1 might be a good starting point for investigating toxic mechanisms induced by exposure to other chemicals.
Figure 6. Negative regulation of neural induction by Mfn1 knockdown. The cells were infected with lentiviruses containing a vector encoding a shRNA directed against Mfn1 or a scrambled sequence shRNA (control) for 24 h. The infected cells were subjected to selection with 1 μ g/ml puromycin for 24 h and cultured for an additional 72 h prior to functional analyses. (A) After incubation with U0126 for 24 h, ERK phosphorylation was analyzed by western blotting using anti-phospho-ERK antibodies. (B) Relative densities of bands were quantified with ImageJ software. Relative changes in expression were determined by normalization to total ERK protein level. (C) At day 4 after neural induction with U0126, the expression of PAX6 gene was analyzed by real-time PCR. Data are represented as means ± SD (n = 3). *P < 0.05.
- 54 -
www.nature.com/scientificreports/
9
Scientific RepoRts | 7:40925 | DOI: 10.1038/srep40925
Methods
Chemicals. Chlorpyrifos (CPF), Y-27632, SB431542, and LDN193189 were obtained from Wako (Tokyo, Japan). Penicillin-streptomycin mixture (PS) was obtained from Thermo Fisher Scientific (Waltham, MA, USA).
U0126 was obtained from Enzo Life Sciences (Farmingdale, NY, USA). Poly-L-ornithine, 2-mercaptoethanol (2-ME), and carbonylcyanide m-chlorophenylhydrazone (CCCP) were obtained from Sigma-Aldrich (St. Louis, MO, USA). All other reagents were of analytical grade and obtained from commercial sources.
Cell culture. Human iPSC line 253G1 (Riken BRC Cell Bank, Tsukuba, Ibaraki, Japan) was established through retroviral transduction of OCT4, SOX2, and KLF4 into adult human dermal fibroblasts45. The cells were cultured under feeder-free conditions using human embryonic stem cell (ESC)-qualified Matrigel (BD Biosciences, San Jose, CA, USA) and TeSR-E8 medium (Stemcell Technologies, Vancouver, BC, Canada) at 37 °C in an atmosphere containing 5% CO2. For passage, iPSC colonies were dissociated into single cells using Accumax (Innovative Cell Technologies, San Diego, CA, USA) and cultured in TeSR-E8 medium supplemented with Y-27632 (ROCK inhibitor, 10 μ M). The NPCs derived from iPSCs were cultured on poly-L-ornithine and Laminin (Thermo Fisher Scientific) coated dishes at 37 °C in an atmosphere containing 5% CO2. The culture Figure 7. Proposed mechanism of CPF cytotoxicity in human iPSCs. CPF exposure causes Mfn1 reduction, which induces mitochondrial dysfunction, including mitochondrial fragmentation and decreased ATP levels.
Mitochondrial dysfunction in turn evokes ERK phosphorylation, leading to the suppression of PAX6, which is an early marker of neurogenesis.
- 55 -
www.nature.com/scientificreports/
10
Scientific RepoRts | 7:40925 | DOI: 10.1038/srep40925
medium was Neural maintenance medium [NMM; a 1∶ 1 mixture of DMEM/F12 (Thermo Fisher Scientific) and Neurobasal (Thermo Fisher Scientific) containing N2 (Thermo Fisher Scientific), B27 (Thermo Fisher Scientific), GlutaMAX (Thermo Fisher Scientific), non-essential amino acids (NEAA; Thermo Fisher Scientific), 2-ME, PS].
For passage, NPCs were dissociated into single cells using Accumax and cultured in NMM supplemented with EGF (20 ng/ml), FGF2 (20 ng/ml) and Y-27632.
Neural differentiation procedure. For the induction of neuronal lineages, dual SMAD inhibition protocol was used as previously described21 with modifications. Briefly, iPSC colonies were dissociated into single cells with Accumax. The cells were seeded at a density of 7 × 10⁴ cells/cm2 in TeSR-E8 medium on Matrigel-coated plates in order to reach nearly confluent within two days after seeding. The initial differentiation medium was knockout serum replacement (KSR) medium [Knockout DMEM (Thermo Fisher Scientific) containing KSR (Thermo Fisher Scientific), L-glutamine, NEAA, 2-ME, PS] with SB431542 (TGFβ inhibitor, 10 μ M) and LDN193189 (BMP inhibitor, 1 μ g/ml). After 4 days, N2 medium [Neurobasal containing N2, B27, GlutaMAX, PS] was added to the KSR medium with LDN193189 every two days.
Measurement of intracellular ATP levels. Intracellular ATP content was measured using an ATP Determination Kit (Thermo Fisher Scientific), according to the manufacturer’s protocol. Briefly, the cells were washed and lysed with 0.1% Triton X-100/PBS. The resulting cell lysates were added to a reaction mixture con- taining 0.5 mM D-luciferin, 1 mM DTT, and 1.25 μ g/mL luciferase and incubated for 30 min at room temperature.
Luminescence was measured using a Fluoroskan Ascent FL microplate reader (Thermo Fisher Scientific). The luminescence intensities were normalized to the total protein content.
Measurement of MMP. A Cell Meter JC-10 Mitochondrial Membrane Potential Assay Kit (AAT Bioquest, Sunnyvale, CA, USA) was used to detect MMP. Briefly, the cells were suspended in staining buffer containing JC-10 and incubated for 20 min at room temperature. After the cells were treated with CPF, a FACS Aria II cell sorter (BD Biosciences) was used to measure the fluorescence intensity ratio, JC-aggregate (F-590)/JC-monomer (F-535).
Assessment of mitochondrial fusion. After treatment with CPF (30 μ M, 72 h), the cells were fixed with 4% paraformaldehyde and stained with 50 nM MitoTracker Red CMXRos (Cell Signaling Technology, Danvers, MA, USA) and 5 μ g/mL Hoechst 33342 (Sigma-Aldrich). Changes in mitochondrial morphology were observed using a confocal laser microscope (Nikon A1). Images (n = 5) of random fields were taken, and the number of cells displaying mitochondrial fusion (< 10% punctiform) was determined in each image, as previously reported46. Real-time polymerase chain reaction (PCR). Total RNA was isolated from iPSCs using TRIzol reagent (Thermo Fisher Scientific), and quantitative real-time reverse transcription (RT)-PCR was performed using a QuantiTect SYBR Green RT-PCR Kit (Qiagen, Valencia, CA, USA) on an ABI PRISM 7900HT sequence detec- tion system (Applied Biosystems, Foster City, CA, USA) as previously reported47. Relative changes in transcript levels were normalized to the mRNA levels of glyceraldehyde-3-phosphate dehydrogenase (GAPDH). The fol- lowing primer sequences were used for real-time PCR analysis: Fis1, forward, 5′-TACGTCCGCGGGTTGCT-3′
and reverse, 5′-CCAGTTCCTTGGCCTGGTT-3′; Drp1, forward, 5′-TGGGCGCCGACATCA-3′ and reverse, 5′-GCTCTGCGTTCCCACTACGA-3′; Mfn1, forward, 5′-GGCATCTGTGGCCGAGTT-3′ and reverse, 5′-ATTATGCTAAGTCTCCGCTCCAA-3′; Mfn2, forward, 5′-GCTCGGAGGCACATGAAAGT-3′ and reverse, 5′-ATCACGGTGCTCTTCCCATT-3′; Opa1, forward, 5′-GTGCTGCCCGCCTAGAAA-3′ and reverse, 5′-TGACAGGCACCCGTACTCAGT-3′; PAX6, forward, 5′-ATGTGTGAGTAAAATTCTGGGCA-3′ and reverse, 5′-GCTTACAACTTCTGGAGTCGCTA-3′; FOXG1, forward, 5′ -GCCACAATCTGTCCCTCAACA-3′ and reverse, 5′-GACGGGTCCAGCATCCAGTA-3′; NCAM1, forward, 5′-GGCATTTACAAGTGTGTGGTTAC-3′ and reverse, 5′-TTGGCGCATTCTTGAACATGA-3′; GAPDH, forward, 5′-GTCTCCTCTGACTTCAACAGCG-3′ and reverse, 5′-ACCACCCTGTTGCTGTAGCCAA-3′.
Western blot analysis. Western blot analysis was performed as previously reported48. Briefly, the cells were lysed with Cell Lysis Buffer (Cell Signaling Technology). The proteins were then separated by sodium dode- cyl sulfate-polyacrylamide gel electrophoresis (SDS-PAGE) and electrophoretically transferred to Immobilon-P membranes (Millipore, Billerica, MA, USA). The membranes were probed with anti-Drp1 monoclonal antibodies (1:1000; Cell Signaling Technology), anti-Fis1 polyclonal antibodies (1:200; Santa Cruz Biotechnology, Santa Cruz, CA, USA), anti-Mfn1 polyclonal antibodies (1:1000; Cell Signaling Technology), anti-Mfn2 monoclonal antibodies (1:1000; Cell Signaling Technology), anti-Opa1 monoclonal antibodies (1:1000; BD Biosciences), anti-ERK1/2 polyclonal antibodies (1:1000; Cell Signaling Technology), anti-phospho ERK1/2 (Thr202/
Tyr204) monoclonal antibodies (1:2000; BD Biosciences), and anti-β -actin monoclonal antibodies (1:5000;
Sigma-Aldrich). The membranes were then incubated with secondary antibodies against rabbit or mouse IgG conjugated to horseradish peroxidase (Cell Signaling Technology). The bands were visualized using an ECL Western Blotting Analysis System (GE Healthcare, Buckinghamshire, UK). Images were acquired using an LAS- 3000 Imager (FUJIFILM, Tokyo, Japan).
Gene knockdown by shRNA. Knockdown experiments were performed using Mfn1 shRNA lentiviruses from Sigma-Aldrich (MISSION shRNA), as previously reported49. A scrambled hairpin sequence was used as a negative control. Briefly, the cells were infected with the viruses at a multiplicity of infection of 1 in the presence
- 56 -
www.nature.com/scientificreports/
11
Scientific RepoRts | 7:40925 | DOI: 10.1038/srep40925
of 8 μ g/mL hexadimethrine bromide (Sigma-Aldrich) for 24 h. After medium exchange, the cells were subjected to selection with 1 μ g/mL puromycin for 24 h and cultured for an additional 72 h prior to functional analyses.
Statistical analysis. All data are presented as means ± standard deviation (SD). Analysis of variance (ANOVA) followed by post-hoc Bonferroni test was used to analyze data in Figs 1, 3C, 4, 5, and 6. Student’s t test was used to analyze data in Figs 2, 3A, S1, and S2. P-values < 0.05 were considered statistically significant.
References
1. Landrigan, P. J., Lambertini, L. & Birnbaum, L. S. A research strategy to discover the environmental causes of autism and neurodevelopmental disabilities. Environ. Health Perspect. 120, a258–a260 (2012).
2. Ross, E. J., Graham, D. L., Money, K. M. & Stanwood, G. D. Developmental consequences of fetal exposure to drugs: what we know and what we still must learn. Neuropsychopharmacology 40, 61–87 (2015).
3. Rodier, P. M. Developing brain as a target of toxicity. Environ. Health Perspect. 103, 73–76 (1995).
4. Rice, D. & Barone, S. Jr. Critical periods of vulnerability for the developing nervous system: evidence from humans and animal models. Environ. Health Perspect.108, 511–533 (2000).
5. Brown, M. A. & Brix, K. A. Review of health consequences from high-, intermediate- and low-level exposure to organophosphorus nerve agents. J. Appl. Toxicol. 18, 393–408 (1998).
6. Ray, D. E. & Richards, P. G. The potential for toxic effects of chronic, low-dose exposure to organophosphates. Toxicol. Lett. 120, 343–351 (2001).
7. Rauh, V. A. et al. Brain anomalies in children exposed prenatally to a common organophosphate pesticide. Proc. Natl. Acad. Sci. USA 109, 7871–7876 (2012).
8. Slotkin, T. A., Levin, E. D. & Seidler, F. J. Comparative developmental neurotoxicity of organophosphate insecticides: effects on brain development are separable from systemic toxicity. Environ. Health Perspect. 114, 746–751 (2006).
9. Ohishi, T. et al. Reversible effect of maternal exposure to chlorpyrifos on the intermediate granule cell progenitors in the hippocampal dentate gyrus of rat offspring. Reprod. Toxicol. 35, 125–136 (2013).
10. Salama, M., El-Morsy, D., El-Gamal, M., Shabka, O. & Mohamed, W. M. Mitochondrial complex I inhibition as a possible mechanism of chlorpyrifos induced neurotoxicity. Ann. Neurosci. 21, 85–89 (2014).
11. Lee, J. E., Park, J. H., Jang, S. J. & Koh, H. C. Rosiglitazone inhibits chlorpyrifos-induced apoptosis via modulation of the oxidative stress and inflammatory response in SH-SY5Y cells. Toxicol. Appl. Pharmacol. 278, 159–171 (2014).
12. Lee, J. E., Lim, M. S., Park, J. H., Park, C. H. & Koh, H. C. Nuclear NF-κ B contributes to chlorpyrifos-induced apoptosis through p53 signaling in human neural precursor cells. Neurotoxicology 42, 58–70 (2014).
13. Huen, K. et al. Organophosphate pesticide levels in blood and urine of women and newborns living in an agricultural community.
Environ. Res. 117, 8–16 (2012).
14. Youle, R. J. & van der Bliek, A. M. Mitochondrial fission, fusion, and stress. Science 337, 1062–1065 (2012).
15. van der Bliek, A. M., Shen, Q. & Kawajiri, S. Mechanisms of mitochondrial fission and fusion. Cold Spring Harb. Perspect. Biol. 5, pii:
a011072 (2013).
16. Cipolat, S., De Brito, O. M., B. Dal Zilio, B. & Scorrano, L. OPA1 requires mitofusin 1 to promote mitochondrial fusion. Proc. Natl.
Acad. Sci. USA 101, 15927–15932 (2004).
17. Koshiba, T. et al. Structural basis of mitochondrial tethering by mitofusin complexes. Science 305, 858–862 (2004).
18. Smirnova, E., Griparic, L., Shurland, D.-L. & van der Bliek, A. M. Dynamin-related protein Drp1 is required for mitochondrial division in mammalian cells. Mol. Biol. Cell 12, 2245–2256 (2001).
19. Yoon, Y., Krueger, E. W., Oswald, B. J. & McNiven, M. A. The mitochondrial protein hFis1 regulates mitochondrial fission in mammalian cells through an interaction with the dynamin-like protein DLP1. Mol. Biol. Cell 23, 5409–5420 (2003).
20. Chen, H. et al. Mitofusins Mfn1 and Mfn2 coordinately regulate mitochondrial fusion and are essential for embryonic development.
J. Cell Biol. 160, 189–200 (2003).
21. Chambers, S. M. et al. Highly efficient neural conversion of human ES and iPS cells by dual inhibition of SMAD signaling. Nat.
Biotechnol. 27, 275–280 (2009).
22. Manuel, M. N., Mi, D., Mason, J. O. & Price, D. J. Regulation of cerebral cortical neurogenesis by the Pax6 transcription factor. Front.
Cell Neurosci. 9, 70 (2015).
23. Shen, L., Nam, H. S., Song, P., Moore, H. & Anderson, S. A. FoxG1 haploinsufficiency results in impaired neurogenesis in the postnatal hippocampus and contextual memory deficits. Hippocampus 16, 875–890 (2006).
24. Polo-Parada, L., Bose, C. M., Plattner, F. & Landmesser, L. T. Distinct roles of different neural cell adhesion molecule (NCAM) isoforms in synaptic maturation revealed by analysis of NCAM 180 kDa isoform-deficient mice. J. Neurosci. 24, 1852–1864 (2004).
25. Cheng, A., Hou, Y. & Mattson, M. P. Mitochondria and neuroplasticity. ASN. Neuro. 2, e00045 (2010).
26. Tanaka, A. et al. Proteasome and p97 mediate mitophagy and degradation of mitofusins induced by Parkin. J. Cell Biol. 191, 1367–1380 (2010).
27. Greber, B. et al. FGF signalling inhibits neural induction in human embryonic stem cells. EMBO J. 30, 4874–4884 (2011).
28. Son, M. J. et al. Mitofusins deficiency elicits mitochondrial metabolic reprogramming to pluripotency. Cell Death Differ. 22, 1957–1969 (2015).
29. Garcia, S. J., Seidler, F. J., Crumpton, T. L. & Slotkin, T. A. Does the developmental neurotoxicity of chlorpyrifos involve glial targets?
Macromolecule synthesis, adenylyl cyclase signaling, nuclear transcription factors, and formation of reactive oxygen in C6 glioma cells. Brain Res. 891, 54–68 (2001).
30. Basha, M. & Poojary, A. Cold stress offered modulation on chlorpyrifos toxicity in aging rat central nervous system. Toxicol. Int. 19, 173–181 (2012).
31. Yamada, S. et al. Tributyltin induces mitochondrial fission through Mfn1 degradation in human induced pluripotent stem cells.
Toxicol. In Vitro. 34, 257–263 (2016).
32. Leboucher, G. P. et al. Stress-induced phosphorylation and proteasomal degradation of mitofusin 2 facilitates mitochondrial fragmentation and apoptosis. Mol. Cell 47, 547–557 (2012).
33. Yue, W. et al. A small natural molecule promotes mitochondrial fusion through inhibition of the deubiquitinase USP30. Cell Res. 24, 482–496 (2014).
34. Park, Y. Y., Nguyen, O. T., Kang, H. & Cho, H. MARCH5-mediated quality control on acetylated Mfn1 facilitates mitochondrial homeostasis and cell survival. Cell Death Dis. 5, e1172 (2014).
35. Chen, K. H. et al. Dysregulation of HSG triggers vascular proliferative disorders. Nat. Cell Biol. 6, 872–883 (2004).
36. Chen, K. H. et al. Role of mitofusin 2 (Mfn2) in controlling cellular proliferation. FASEB J. 28, 382–394 (2014).
37. Yu, Z. P., Matsuoka, M., Wispriyono, B., Iryo, Y. & Igisu, H. Activation of mitogen-activated protein kinases by tributyltin in CCRF- CEM cells: role of intracellular Ca(2+ ). Toxicol. Appl. Pharmacol. 168, 200–207 (2000).
38. Pizzo, P., Drago, I., Filadi, R. & Pozzan, T. Mitochondrial Ca2+ homeostasis: mechanism, role, and tissue specificities. Pflugers Arch.
464, 3–17 (2012).
- 57 -
www.nature.com/scientificreports/
12
Scientific RepoRts | 7:40925 | DOI: 10.1038/srep40925
39. Danesin, C. & Houart, C. A. Fox stops the Wnt: implications for forebrain development and diseases. Curr. Opin. Genet. Dev. 22, 323–330 (2012).
40. Georgala, P. A., Carr, C. B. & Price, D. J. The role of Pax6 in forebrain development. Dev. Neurobiol. 71, 690–709 (2011).
41. Tuoc, T. C. et al. Selective cortical layering abnormalities and behavioral deficits in cortex-specific Pax6 knock-out mice. J. Neurosci.
29, 8335–8349 (2009).
42. Tian, C. et al. Foxg1 has an essential role in postnatal development of the dentate gyrus. J. Neurosci. 32, 2931–2949 (2012).
43. Chen, X. P., Chen, W. Z., Wang, F. S. & Liu, J. X. Selective cognitive impairments are related to selective hippocampus and prefrontal cortex deficits after prenatal chlorpyrifos exposure. Brain Res. 1474, 19–28 (2012).
44. Li, K. et al. Differentiation of pluripotent stem cells for regenerative medicine. Biochem. Biophys. Res. Commun. 471, 1–4 (2016).
45. Nakagawa, M. et al. Generation of induced pluripotent stem cells without Myc from mouse and human fibroblasts. Nat. Biotechnol.
26, 101–106 (2008).
46. Fan, X., Hussien, R. & Brooks, G. A. H2O2-induced mitochondrial fragmentation in C2C12 myocytes. Free Radic. Biol. Med. 49, 1646–1654 (2010).
47. Hirata, N. et al. Sphingosine-1-phosphate promotes expansion of cancer stem cells via S1PR3 by a ligand-independent Notch activation. Nat. Commun. 5, 4806 (2014).
48. Kanda, Y. et al. Reactive oxygen species mediate adipocyte differentiation in mesenchymal stem cells. Life Sci. 89, 250–258 (2011).
49. Yamada, S. et al. NAD-dependent isocitrate dehydrogenase as a novel target of tributyltin in human embryonic carcinoma cells. Sci.
Rep. 4, 5952 (2014).
Acknowledgements
This work was supported by a Health and Labour Sciences Research Grant from the Ministry of Health, Labour, and Welfare, Japan (#H25-Kagaku-Ippan-002 and #H28-Kagaku-Ippan-003 to Y.Ka.), a Grant-in- Aid for Scientific Research from the Ministry of Education, Culture, Sports, Science, and Technology, Japan (#26293056 and #26670041 to Y.Ka.), the Japan Agency for Medical Research and Development, AMED (#15mk0104053h0101 and #16mk0104027j0002 to Y.S.), and a grant from the Smoking Research Foundation (Y.Ka.).
Author Contributions
Y.S. and Y.Ka. planned the project. S.Y. performed most of the experiments. S.Y. and Y.Ka. wrote the manuscript.
Y.Ku. and D.Y. provided technical advices. All authors reviewed the manuscript.
Additional Information
Supplementary information accompanies this paper at http://www.nature.com/srep Competing financial interests: The authors declare no competing financial interests.
How to cite this article: Yamada, S. et al. Chlorpyrifos inhibits neural induction via Mfn1-mediated
mitochondrial dysfunction in human induced pluripotent stem cells. Sci. Rep. 7, 40925; doi: 10.1038/srep40925 (2017).
Publisher's note: Springer Nature remains neutral with regard to jurisdictional claims in published maps and institutional affiliations.
This work is licensed under a Creative Commons Attribution 4.0 International License. The images or other third party material in this article are included in the article’s Creative Commons license, unless indicated otherwise in the credit line; if the material is not included under the Creative Commons license, users will need to obtain permission from the license holder to reproduce the material. To view a copy of this license, visit http://creativecommons.org/licenses/by/4.0/
© The Author(s) 2017
- 58 -
- 59 -
- 60 -
- 61 -
- 62 -
- 63 -
- 64 -
© 2016 The Institute of Electrical Engineers of Japan. 99 㟁ẼᏛㄽᩥㄅA㸦ᇶ♏࣭ᮦᩱ࣭ඹ㏻㒊㛛ㄅ㸧
IEEJ Transactions on Fundamentals and Materials Vol.136 No.2 pp.99-104 DOI: 10.1541/ieejfms.136.99
Visualization of Spatially Distributed Bioactive Molecules using Enzyme-Linked Photo Assay
Hikaru Mabuchi
㸨 Student Member, HongYao Ong
㸨 AssociateKazunori Watanabe
㸨 Non-member, Sachiko Yoshida
㸨 Non-memberNaohiro Hozumi
㸨a) Senior Member (Manuscript received March 18, 2015, revised Oct. 4, 2015)In this paper, we propose a new simple device for visualizing bioactive molecules with a fine spatial resolution by using a membrane in which a specific enzyme is immobilized. The layer produces fluorescence after association with a specific substance.
The layer, on which a biological tissue is to be mounted, is deposited on a quartz substrate that is used as a light guide to introduce UV light to the layer. Substance release is observed by a CCD camera from the opposite side of the substrate. In order to shorten the experiment time, we had automated the optical device. The paper also describes the reduction of background fluorescence by means of image processing technique. Images were acquired by employing two UV-LEDs with slightly different angle. Image processing was performed to separate background and target fluorescence by means of independent component analysis. Finally the release of GABA(γ-aminobutyric acid) and glutamate from specific layers in rat cerebellum was successfully observed. It is expected that, using this method, both real-time transmitter release and its response to medicine can be observed.
Keywords : bioactive molecules, enzyme-linked photo assay, independent component analysis
1. Introduction
Light guide is composed of a dielectric material that can enclose the light propagation. In addition to being applied to communication, it is useful for sensing as well. In chemical sensing the surface of the light guide has to be coated with some specific chemical that may change its optical property depending on chemical reactions.
Such a function can be applied to chemical imaging, if the light guide has a flat surface. This study proposes an application of two-dimensional light guide, of which surface is chemically modified, to biochemical imaging.
Neurotransmitter molecules released from neurons are not only regulators of neuronal transduction but also indicators of neuronal conditions. Glutamate and γ-aminobutyric acid (GABA) are known as typical transmitters in brain cortex that play important roles as stimulator and suppresser, respectively. Lack of balance in the release of glutamate and GABA may lead to autism, epilepsy or Parkinson’s disease(1)(2).
In order to observe the spatio-temporal release in cerebellar cortex, we have newly proposed the enzyme-linked photo assay system, which is realized even using normal CCD camera, and observed GABA release in developing cerebellar slice using either new or authorized methods(3).
In this paper, we propose a new simple device for this purpose by using a reactive layer in which a specific enzyme is immobilized, and produces fluorescence after association with a specific substance released from mounted slice. This layer is bound a quartz substrate that is used as a light guide for UV light
excitation. Fluorescence derived from a substance is observed by a CCD camera from the opposite side of the substrate.
The paper describes the reduction of background fluorescence by means of image processing technique. Finally it will be shown that the release of transmitters from specific layers in rat cerebellum was successfully observed.
2. Specimen Preparation and Photo Excitation System
Imaging of neurotransmitter release was monitored the reaction of oxidoreductases generating reduced nicotinamide adenine dinucleotide (NAD+) or diphosphonucleotide (NADP+). For glutamate and GABA, we used glutamate dehydrogenase and GABA disassembly enzyme (GABase), respectively.
Enzymes were covalently immobilized on the quartz glass substrate using a silane coupling agent and a crosslink agent. The substrate was as thick as 1 mm. Stoichiometrically generated NADH or NADPH emits 480 nm fluorescence after excitation at 340-365 nm.
Existence of glutamate and GABA lead to fluorescence when co-existing with specific enzyme and co-enzyme. A glass substrate on which specific enzyme is coated is in contact with the biological specimen. A chamber space is created around the specimen. The space is filled with buffer liquid and co-enzyme. On the glass substrate therefore, the specimen is in contact with both enzyme and co-enzyme.
Consequently glutamate or GABA, that is released from the tissue spontaneously by stimulation, makes an oxidation-reduction reaction on the substrate. Although both glutamate and GABA do not produce fluorescence by themselves, NAD(P)H that is created as the result of the above chemical reaction makes fluorescence.
As the ratio of glutamate or GABA and NAD(P)H is 1:1, the a) Correspondence to: Naohiro Hozumi. E-mail: hozumi@icceed.
tut.ac.jp
㸨 Toyohashi University of Technology
1-1, Hibarigaoka, Tenpaku, Toyohashi 441-8580, Japan
Paper
- 65 -
Visualization of Bioactive Molecules (Hikaru Mabuchi et al.)
100 IEEJ Trans. FM, Vol.136, No.2, 2016 fluorescence can be correlated to the amount of released glutamate
or GABA.
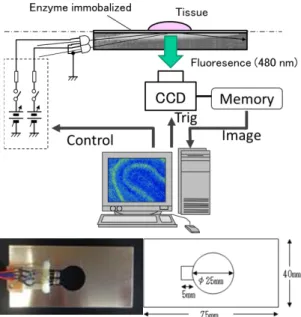
In the experiment, rat cerebellum was sliced sagittally at 400 μm thick and incubated in oxygen-aerated HEPES-Na+ buffer for 40 min. The slice was placed on the quartz glass substrate with both NADP+ and α-ketoglutarate. Figure 1 shows the schematic diagram of the observation system including the device. The enzyme was immobilized covalently on the glass as shown in Fig. 2. Figure 3 shows chemical reactions taking place on the substrate. NADP+ (nicotinamide adenine dinucleotide phosphate) changes into NADPH (reduced nicotinamide adenine dinucleotide phosphate) just as glutamate and GABA degeneration. Synthesized NADPH was illuminated by 360 nm surface UV-LED, and emitted the 480 nm fluorescent light observed by cooled CCD (ORCA ER, Hamamatsu Photonics). The quartz substrate can be recognized as a light guide to illuminate the surface of the substrate.
3. Image Processing
The fluorescent light detected by the CCD camera is divided into target light and background light. As significant intensity of background light is detected, it is assumed that fluorescence is excited by the light that is refracted on the interface between the substrate and tissue system including the layer. The light, being generated by LEDs and propagates though the substrate, can be decomposed into plane waves with different angles of propagation.
Each plane wave transfers across the enzyme layer and comes into the tissue. We assume that both target and background light were predominantly excited by normal light. As the background light significantly damage the quality of the image, it should be reduced as much as possible. Making use of the evanescent light may be a solution, however, it may make the system complicated, and the target light may be not as significant as this case. Therefore we tried to reduce the background by means of a simple image processing.
Assuming that the light is a plane wave and scatter can be neglected, wave propagation and detected fluorescence can be illustrated as Fig. 4. In the figure, fluorescence, attributed to the layer where the enzyme is fixed, is represented as I0. This is
Fig. 1. Schematic diagram of the observation system including the device and its outlook
Fig. 2. Immobilized enzyme
Fig. 4. Fluorescence detected by CCD camera Fig. 3. Chemical reaction on the substrate
- 66 -
Visualization of Bioactive Molecules (Hikaru Mabuchi et al.)
101 IEEJ Trans. FM, Vol.136, No.2, 2016 defined as to be the target. The fluorescence attributed to the tissue
is represented as I'0 . This is defined as to be the background. Both I0 and I'0 depends on the incident angle θ. The thickness of the quartz plate, which is used as a light guide, is as thick as 1 mm. As it is much thicker than the diameter of normal optical fiber it is relatively easy to introduce two kinds of lights of which angles of center axes are significantly different. In addition, in practice, they depend differently on the incident angle. As the result, the proportion (I0/I'0) is not the same along θ. This is true even if the incident angle has distributed.
As the result, the captured fluorescence with different angle of optical axis is composed of target and background fluorescence with different mixture ratios. This can be represented as:
1 11 12 1
2 21 22 2
F a a f
F a a f
§ · § ·§ ·
¨ ¸ ¨ ¸¨ ¸
© ¹ © ¹© ¹ ... (1) where F1(x,y) and F2(x,y) are captured fluorescence image, f1(x,y) and f2(x,y) are spatial distributions of fluorescence as the target and background, a11, a12, a21, a22 are constants. Although the image acquisition is sequential, ICA is performed by assuming that two images, F1(x,y) and F2(x,y) are acquired with a negligible time lag.
Reproduced images f '1(x,y) and f '2(x,y) are calculated from F1 and F2. As the result of periodical acquisitions of F1 and F2, time dependent images of f '1 and f '2 are calculated. Eq. (1) can also be described using a matrix expression as:
F A f ... (2) The target and background fluorescence distribution can be calculated by applying A-1 to F. In practice, only contrast of the image would be enough to recognize the distribution. In such a case A-1 can be represented as:
1 1 D E
§ ·
¨ ¸
© ¹ ... (3) After capturing two images F1 and F2 by changing the angle of
optical axis, the target and background images can be separated by finding appropriate numbers for α and β. α and β can be tuned manually by monitoring the quality of reproduced image, however, the theory of independent component analysis (ICA) may be powerful for solving such a problem(4).
Stochastic distribution of pixel intensity in images f '1 and f '2 are represented as p(y1i) and p(y2j), where y1i and y2j represent the intensity.
1 11 1 1
2 21 2 2
( ) { ( ), , ( ), ( )}
( ) { ( ), , ( ), ( )}
i n
j n
p y p y p y p y
p y p y p y p y
{ ½°
{ ¾°¿
, ( ),( )1111i (( 111n)} ½ , ((( 2222j),)) ((( 222n)}¾¾¾
¿¾¾¾¾ ... (4) p(y1i,y2j) represents the probability that the intensity of a pixel in image f '1 is y1i and that of the corresponding point in image f '2 is y2j. In other words p(y1) and p(y2) are probabilities that cases y1
and y2 take place, respectively, and p(y1,y2) is the probability that cases y1 and y2 takes place simultaneously. Variables y1 and y2 are considered to be independent when
1 2 1 2
( , ) ( ) ( )
p y y p y p y ... (5) is established. Kullback-Leibler (K-L) parameter is often employed to indicate the independency of variables:
1 2
1 2
, 1 2
( , )
( , )log
( ) ( )
i j
i j
i j i j
p y y
KL p y y
p y p y
{
¦
... (6) The K-L parameter is zero when two sets of variables y1 and y2 are completely independent together. In practice, α and β in Eq. (3), which determine the probabilities p(y1), p(y2) and p(y1,y2), can be tuned so that the K-L parameter indicates the minimum.The process of ICA is illustrated in Fig. 5. The equation described in the form of matrix indicates that two images, F1 and F2, derive from linear combination of unknown original images f1 and f2. If an appropriate inverse matrix can be found then the original images can be reproduced. However as the matrix to describe the linear combination is unknown as well, ICA algorithm is applied to find the most appropriate matrix (as the inverse matrix). In the
Fig. 5. Illustration for image processing based on independent component analysis
f
1f
2f’
1f’
21 (α)
(β) 1
a
11a
12a
21a
22p(y
1)
y
1y
2p ( y
2)
p(y
1,y
2)
¦
i j i j j i ji
p y p y
y y y p
y p KL
, 1 2
2 1 2
1
( ) ( )
) , log (
) , (
Reconstructed Observed Origin
Probability distribution of intensity
Parameter for independency
Tune α,β
¸¸ ¹
¨¨ ·
©
¸¸ §
¹
¨¨ ·
©
¸¸ §
¹
¨¨ ·
©
§
2 1 22 21
12 11 2
1
f f a a
a a F F
F
2F
1¸¸ ¹
¨¨ ·
©
¸¸ §
¹
¨¨ ·
© { §
¸¸ ¹
¨¨ ·
©
¸¸ §
¹
¨¨ ·
© x §
¸¸ ¹
¨¨ ·
©
¸¸ §
¹
¨¨ ·
©
§ c
c
2 1 2
1 1
22 21
12 11 2
1 2
1
1 1
F F F
F a
a a a f
f
E D N
N
(?) (?)
Target
Background
- 67 -
Visualization of Bioactive Molecules (Hikaru Mabuchi et al.)
102 IEEJ Trans. FM, Vol.136, No.2, 2016 ICA process K-L parameter is calculated in order to evaluate the
probabilistic independency of images f'1 and f'2. It can be considered that in the reproduction algorithm the core process is the calculation of the K-L parameter. In this preliminary study K-L parameter is successively calculated by manually changing the inverse matrix, and images are assumed to be reproduced when the K-L parameter indicates the minimum.
4. Results and Discussion
4.1 Image Processing using the ICA Figure 6 (a) shows visible light image of the cerebellum with postnatal 21 days. In developing cerebellum, granule cells, small input neurons, proliferate and migrate down from the external granular layer (EGL) to the internal granular layer (IGL). As the development proceeds, EGL turns into molecular layer (ML) whereas IGL remains. Purkinje cells, big output neurons, develop their dendrites and associate neuronal connections between granule cells and other interneurons. Neuronal circuit layer forms the ML. As the cerebellum shown in Fig. 6 (a) is mature, ML, PL, IGL are clearly visible. Note that ML is on the outer side of the cerebellum, and a wrinkle surrounded by the ML is seen in Fig. 6 (a).
As for fluorescence observation, three different images were acquired. Two were with different inclination of the excitation
light source, and one was with no excitation light. Each of the two images with excitation light was subtracted with the image with no excitation light, in order to reduce the background light from the outside. These two images after the subtraction were defined as images A and B.
Figure 6 (b) shows these images for a rat cerebellum. Both images are very unclear, because of the background fluorescence.
Figure 6 (c) shows the result of image processing. It is clearly shown in the image entitled as “target” that the fluorescence intensity is high in two layers, whereas that entitled as “background”
is not clear. By morphological inspection these layers are recognized as ML and IGL. These layers are known that GABAergic neurons distribute in mature cerebellum. Studies using HPLC and electrophysiological method have shown that GABA is released from the postnatal cerebellar cortex even before synaptogenesis, and that GABA receptors act on the developing cerebellar Purkinje cells(4)(5). However, dynamic GABA release could not be observed unless the enzyme-linked photo assay is used. In addition, because cytoplasmic autofluorescence becomes noisy background light, it is useful that the image processing system extracted the image of GABA release from the autofluorescence-contained image. Using this method, both real-time transmitter release and its response to medicine can be observed.
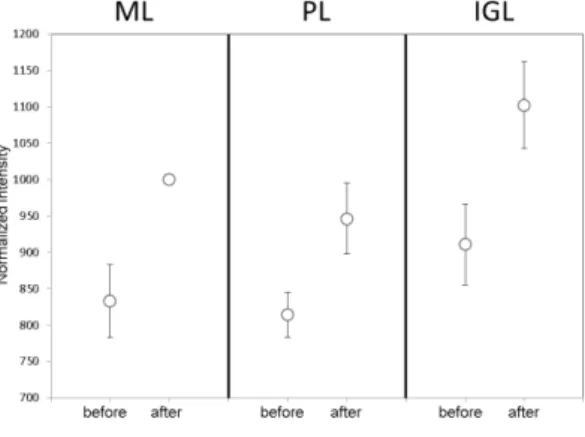
4.2 Transition after Chemical Stimulation In relatively developed cerebellum, cells distributed in the ML and IGL are only the neurons of glutamate release, so that both layers showed fluorescent activities. Figure 7 indicates release distribution of glutamate in comparison with normal optical image illuminated with visible light. The fluorescent image, indicating glutamate release, is after the ICA processing. Figure 7 (c) indicates the regions of interest for analysis. Regions highlighted as ML and IGL have relatively strong intensity in fluorescence. They have a contrast to the region highlighted as PL. Release from white matter (WM), which is mostly composed of fatty materials, is much less significant.
(a) Visible light image
Small angle (image A). Large angle (image B).
(b) Fluorecence images before image processing
Background Target (c) Fluorecence images after image processing
Fig. 6. Cross sectional mages of cerebellar cortex: (a) Visible light image, (b) original fluorescent images with different angle of optical axes, and (c) fluorescent images after the image processing. Scales are indicated in arbitrary unit. Specimen: rat cerebellum (postnatal 21 days), target: GABA
(a) Visible light image (b) Fluorescent image
(c) Regions of interest for analysis
Fig. 7. Cerebellum with postnatal 7 days observed with visible light and fluorescent light indicating glutamate release. 0.9 mm
× 0.9 mm. Gray scale is arbitrary. ML: molecular layer, PL:
Purkinje layer, IGL: internal granular layer, WM: white matter.
Specimen: rat cerebellum (postnatal 7 days)


![Fig. 2. (Color online) Illustration for calibration of the acoustic impedance. 6 day100 μmAcoustic impedance[MN·s/m3]0 day100 μm 10 day100 μm 1.52 MN·s/m 3 Acoustic impedance [MN·s/m 3 ]Count 1.52 MN·s/m 3Count 1.52 MN·s/m 3](https://thumb-ap.123doks.com/thumbv2/123deta/7427410.2464868/29.892.146.744.809.1157/illustration-calibration-acoustic-impedance-μmacoustic-impedance-acoustic-impedance.webp)


