脂質含浸膜及び疎水性の強い脂質高分子膜を用いた 味覚センサに関する研究
巫, 霄
https://doi.org/10.15017/1931937
出版情報:Kyushu University, 2017, 博士(工学), 課程博士 バージョン:
権利関係:
Strongly Hydrophobic Lipid Polymer Membrane
脂質含浸膜及び疎水性の強い脂質高分子膜を 用いた味覚センサに関する研究
Xiao Wu 2018
Kyushu University
Graduate School of Information Science and Electrical Engineering Department of Electrical and Electronic Engineering
Contents
Chapter 1 Introduction ... 1
1.1 Taste ... 1
1.1.1 Taste reception ... 1
1.1.2 Basic tastes ... 3
1.2 Electronic tongue ... 5
1.3 Taste sensor (TS-5000Z) ... 6
1.3.1 Characteristic ... 6
1.3.2 Mechanism of taste sensor response ... 8
1.3.3 Measurement of taste sensor ... 11
1.4 The purpose of this study ... 13
Chapter 2 Fabrication of Taste Sensor for Education ... 15
2.1 Background ... 15
2.1.1 Attitudes towards science among students ... 15
2.1.2 Problems of current taste sensor and purpose of this chapter ... 17
2.2 Experiment ... 19
2.2.1 Materials ... 19
2.2.2 Selectivity improvement ... 19
2.2.3 Sensory test ... 22
2.2.4 Improvement of fabrication procedure ... 23
2.2.5 Measurement method ... 26
2.2.6 Application in Science class ... 28
2.3 Results and discussion ... 30
2.3.1 Improvement on sensor selectivity ... 30
2.3.2 Result of sensory test ... 33
2.3.3 Science class ... 33
2.4 Conclusion ... 36
Chapter 3 Preconditioning process for Taste Sensor with a Strongly Hydrophobic Membrane ... 37
3.1 Background ... 37
3.1.1 Hydrophobic membrane of taste sensor ... 37
3.1.2 Detection of pesticide surfactants ... 39
3.1.3 Preconditioning process of lipid polymer membrane ... 41
3.1.4 The current problem and the purpose of this chapter ... 43
3.2 Experiment ... 45
3.2.1 Chemicals ... 45
3.2.2 Fabrication of lipid polymer membrane ... 45
3.2.3 Membrane potential measurement ... 47
3.2.4 Measurement of adsorbed SDS ... 47
3.2.5 Measurement of adsorbed MSG ... 50
3.3 Results and discussion ... 52
3.3.1 Change of CPA value with the preconditioning time ... 52
3.3.2 Amount of absorbed SDS ... 52
3.3.3 Amount of absorbed MSG ... 54
3.3.4 Reference potential ... 54
3.4 Conclusion ... 58
Chapter 4 Improved Durability and Sensitivity of Bitterness Sensing Membrane for Medicines ... 59
4.1 Background ... 59
4.1.1 Bitterness sensor for hydrochloride medicines ... 59
4.1.2 The current problem and the purpose of this chapter ... 61
4.2 Experiment ... 62
4.2.1 Materials ... 62
4.2.2 Accelerated deterioration process ... 64
4.2.3 Effect of lipid and plasticizers on deterioration rate ... 64
4.2.4 Partial deteriorated BT0 sensor ... 65
4.2.5 Quantitative analysis by LC-MS/MS ... 65
4.2.6 Products detection by GC-MS ... 67
4.2.7 Measurement of the amount of adsorbed quinine hydrochloride ... 67
4.2.8 Measurement of surface contact angle ... 68
4.2.9 Fabrication of a durable Bitterness Sensor ... 68
4.3 Results and discussion ... 70
4.3.1 Conditions of the accelerated deterioration process ... 70
4.3.2 Effect of lipid and plasticizers on deterioration rate ... 72
4.3.3 The effect of combination on the deterioration ... 75
4.3.4 LC-MS/MS analysis results ... 75
4.3.5 GC-MS analysis of the membrane components ... 77
4.3.6 Amount of adsorbed quinine hydrochloride ... 77
4.3.7 Reference potential and contact angle ... 81
4.3.8 Improvement on durability and sensitivity ... 83
4.4 Conclusion ... 87
Chapter 5 Quantitative Evaluation of Bitterness Suppression Effect of High-potency Sweeteners Using a Taste Sensor ... 88
5.1 Background ... 88
5.1.1 Bitterness suppression effect ... 88
5.1.2 Sweetener potency and high-potency sweetness ... 89
5.1.3 The purpose of this chapter ... 92
5.2 Experiment ... 93
5.2.1 Chemicals ... 93
5.2.2 Fabrication of sensor electrodes ... 93
5.2.3 Matrix effect of bitterness sensor and sweetness sensors ... 95
5.2.4 Sensory test of bitterness suppression ... 95
5.2.5 Prediction of bitterness with high-potency sweeteners ... 96
5.3 Results and discussion ... 98
5.3.1 Sensory test of bitterness masking by high-potency sweeteners ... 98
5.3.2 Matrix effect of bitterness sensor on high-potency sweeteners ... 100
5.3.3 Matrix effect of sweetness sensors on quinine hydrochloride ... 102
5.4 Conclusion ... 108
Chapter 6 Conclusions ... 109
References ... 112
Acknowledgement ... 119
Figure List
Chapter 1 ... 1
Figure 1.1 Taste-receptor cells, buds and papillae ... 2
Figure 1.2 Taste sensor (TS-5000Z) ... 7
Figure 1.3 Physicochemical properties of the five basic taste substances ... 7
Figure 1.4 Shielding effect ... 9
Figure 1.5 Dissociation by pH and suppression of dissociation ... 9
Figure 1.6 Diagram of taste sensing system ... 12
Figure 1.7 Measurement procedure of taste sensor ... 12
Chapter 2 ... 15
Figure 2.1 The electrode of taste sensor for education ... 16
Figure 2.2 Chemical structures of TOMA and PAEE ... 20
Figure 2.3 Design concept of the charged lipid membrane for salt ... 21
Figure 2.4 Design concept of the charged lipid membrane for citric acid ... 21
Figure 2.5 The answer sheet for sensory test ... 24
Figure 2.6 The fabrication procedure of taste sensor used in science class ... 24
Figure 2.7 The completed taste sensor for education ... 25
Figure 2.8 Schematic of measurement system at developing stage ... 27
Figure 2.9 Schematic of measurement system at science classes ... 27
Figure 2.10 Response characteristics of saltiness and sourness ... 29
Figure 2.11 The relative value with increasing sodium chloride ... 32
Figure 2.12 The relative value with increasing citric acid ... 32
Figure 2.13 Result of sensory test ... 34
Figure 2.14 Relative values of saltiness and sourness sensors ... 34
Figure 2.15 Result of sensory test of students ... 35
Figure 2.16 Relative values of saltiness and sourness sensors of students ... 35
Chapter 3 ... 37
Figure 3.1 The lipid polymer membranes for saltiness and bitterness (-) ... 38
Figure 3.2 Chemical structures of TDAB and SDS ... 40
Figure 3.3 The diagram of the preconditioning process ... 42
Figure 3.4 Relationship between CPA value and SDS concentration ... 44
Figure 3.5 Relationship between reference potential and SDS concentration ... 44
Figure 3.6 Chemical structures of NPOE and MSG ... 46
Figure 3.7 Chemical structure of Co-5-Cl-PADAP ... 48
Figure 3.8 Chemical structure of anisole and cyclohexane ... 48
Figure 3.9 Coloring principle of organic solvent ... 49
Figure 3.10 Measurement procedure of adsorbed SDS ... 49
Figure 3.11 The relationship between the CPA value and preconditioning time ... 53
Figure 3.12 The relationship between the amount of adsorbed SDS and preconditioning time ... 53
Figure 3.13 The relationship between the amount of adsorbed MSG and preconditioning time ... 48
Figure 3.14 Relationship between the reference potential and preconditioning time .... 55
Chapter 4 ... 59
Figure 4.1 Responses of taste sensors to six tastes ... 60
Figure 4.2 The bitterness sensor response with the preservation time ... 60
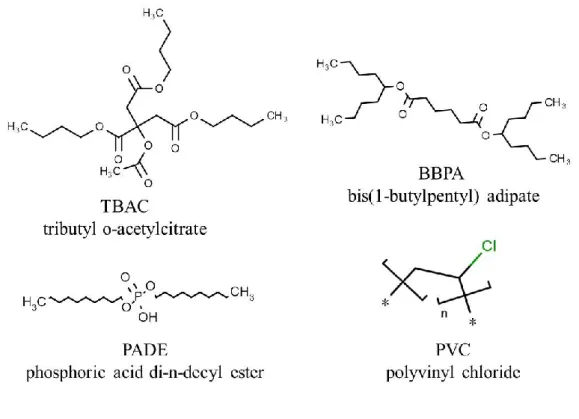
Figure 4.3 Chemical structures of PADE, TBAC, BBPA, and PVC ... 63
Figure 4.4 The response ratio with the preservation time ... 71
Figure 4.5 Relationship between deterioration rate and absolute amount of lipid ... 73
Figure 4.6 Relationship between deterioration rate and absolute amount of plasticizers ... 73
Figure 4.7 The relationship between deterioration rate and lipid mass ratio ... 74
Figure 4.8 The sensor response of BT0 sensor with deteriorated components ... 76
Figure 4.9 Quantitative comparison of the main components obtained by LC-MS/MS ... 76
Figure 4.10 Change in the amount of butyl citrate measured by GC–MS ... 78
Figure 4.11 Chemical structures of decyl alcohol and butyl citrate ... 78
Figure 4.12 The absorbance of the quinine hydrochloride ... 79
Figure 4.13 The calibration curve ... 79
Figure 4.14 Amounts of adsorbed quinine hydrochloride before and after the accelerated deterioration process ... 80
Figure 4.15 The reference potential with lipid concentration ... 80
Figure 4.16 The surface contact angle with lipid concentration ... 82
Figure 4.17 The sensor response with lipid concentration ... 85
Figure 4.18 The sensor response with TBAC concentration ... 85
Figure 4.19 The improved sensor response to five basic tastes ... 86
Figure 4.20 Dependence of the response of the improved bitterness sensor and conventional bitterness sensor on quinine hydrochloride concentration ... 86
Chapter 5 ... 88
Figure 5.1 The diagram of bitterness suppression effect ... 90
Figure 5.2 Chemical structures of high-potency sweeteners ... 91
Figure 5.3 The main sweeteners used in prescription drugs ... 91
Figure 5.4 Chemical structure of quinine hydrochloride ... 94
Figure 5.5 Bitterness sensory scores of 0.1 mM quinine hydrochloride and seven
different concentrations of added aspartame ... 99 Figure 5.6 Bitterness sensory scores of 0.1 mM quinine hydrochloride and seven
different concentrations of added saccharine sodium ... 99 Figure 5.7 The BT0 sensor response to quinine hydrochloride and seven different
concentrations of added aspartame ... 101 Figure 5.8 The BT0 sensor response to quinine hydrochloride and seven different
concentrations of added saccharine sodium ... 101 Figure 5.9 The CPA value of sweetness sensors to aspartame with added quinine
hydrochloride ... 105 Figure 5.10 The CPA value of sweetness sensors to saccharine sodium with added
quinine hydrochloride ... 105 Figure 5.11 Relationship between sensory scores of sweetness and CPA values of
sweetness sensors for high-potency sweeteners ... 106 Figure 5.12 Regression analysis results using CPA values measured with BT0 and
sweetness sensor for positively charged high-potency sweetener: aspartame ... 106 Figure 5.13 Regression analysis results using CPA values measured with BT0 and
sweetness sensor for negatively charged high-potency sweetener ... 107
Table List
Chapter 2 ... 15
Table 2.1 Relationship between taste sensor and science education ... 16
Table 2.2 Schematic of measurement system at science classes ... 29
Chapter 4 ... 59
Table 4.1 The absolute amount of each component in the membranes ... 63
Table 4.2 LC-MS/MS conditions ... 66
Table 4.3 GC-MS conditions ... 66
Chapter 5 ... 88
Table 5.1 The membrane components of the sensors ... 94
Table 5.2 Standard bitterness solutions ... 97
-1-
Chapter 1 Introduction
1.1 Taste
1.1.1 Taste reception
The dorsal surface of the mammalian tongue is covered with four kinds of papillae:
circumvallate, foliate, fungiform, and filiform papillae. The fungiform, foliate and circumvallate papillae are known as the gustatory papillae, which contain taste buds and work as sensory organs. The gustatory papillae are distributed over the tongue surface in a distinct spatial pattern. [1,2]. As shown in Figure 1.1, taste buds exist in the soft palate, tongue, pharynx and larynx surrounding the oral region. About 5,000 taste buds cover the surface of the human tongue [3]. A single taste bud contains 50-100 taste cells that respond to compounds that elicit sweet, bitter, sour, salty, and umami tastes and transmit this information to cerebral cortex in the brain [4]. The receptor cells for each taste quality function as dedicated sensors wired to elicit stereotypic responses [5].
-2-
Figure 1.1: Taste-receptor cells, buds and papillae.
-3-
1.1.2 Basic tastes
In the human senses, the sense of taste is essential for the animals to identify which food is accepted or which food is unpalatable. To most mammals like human, taste consists of five basic taste qualities: saltiness, sourness, umami, sweetness, and bitterness. A study published in 2015 indicates that fat may be a sixth basic taste [6].
The taste system, or gustatory system provides valuable information about nutritive and hedonic values of foods and beverages. Taste also prevents us from consuming potentially harmful substances.
Saltiness
Saltiness is a taste produced by the presence of sodium chloride (and to a lesser degree other salts). Many studies have suggested that the ions of salt, especially Na+
can pass through Na+ channels on the apical surface of the cell and cause an action potential. Although the ENaC receptor for sodium detection was proposed in drosophila, the identity of the salt receptor for humans has not been fully revealed yet [7,8,9]. To humans, sense of saltiness is an important signal of the mineral source that affects the maintenance of the electrolytes balance and fluid balance in human body [10].
Sourness
Sourness is a signal of corruption, produced by hydrogen ions (H+) derived from acids. Many ion channels have been proposed to mediate sour taste transduction, including a transient receptor potential (TRP) channel PKD2L1 and its partner PKD1L3.
In 2015, scientist reported a potassium (K+) channel as a key component of sour taste transduction [11].
Bitterness
Bitterness serves as a warning signal against the ingestion of potentially harmful
-4-
substances. Bitter compounds are recognized by T2R receptors. Although the types of bitter substances are too diverse to find the consistency in the chemical structures of bitter substances, they have relatively strong hydrophobicity in common. The main interaction between bitter substances and the bitterness receptor sites involve hydrophobic interaction and electrostatic interaction. The bitter substances such as plant alkaloids, caffeine, denatonium, cyclohexamide cause bitterness stimulation when combining with the G protein coupled receptors (GPCRs) in taste bugs, which have seven transmembrane helices structures [12].
Sweetness
Sweetness indicates the presence of sugar or sweeteners as the energy source of the human body. There are many kinds of sweet substances in different chemical structures and sizes, such as sugar (sucrose, glucose etc.), sugar alcohol (xylitol etc.), peptides (aspartame etc.), sulfonylamide (saccharine sodium etc.) and so forth. Sweet taste receptor is heterocomplex receptor combined with T1R2 and T1R3 (GPCRs), which can widely accept various kinds of sweet substances [13,14].
Umami (or savory taste)
Umami was a basic taste since Kikunae Ikeda first proposed its existence in 1908.
It is a Japanese word meaning "savory" or "meaty" and thus applies to the sensation of savoriness. Umami taste is elicited by many small molecules, providing necessary amino acids (glutamate and aspartate) and nucleotides (monophosphates of inosinate or guanylate, inosine 5'-monophosphate and guanosine-5'-monophosphate) to livings.
These receptors include 2 glutamate-selective G protein-coupled receptors, mGluR4 and mGluR1, and the taste bud-expressed heterodimer T1R1+T1R3 have been proposed to underlie umami detection in taste buds [15].
-5-
1.2 Electronic tongue
Sensory test is often carried out by trained panelists to evaluate taste in food and pharmaceuticals. However, sensory test has some problems such as low objectivity, low reproducibility due to individual differences, physical conditions, and human fatigue.
Muramoto et al. [16] have proposed that people taste the chocolate with more delicious and weaker bitter when in a high-stress state. In addition to the mental state, the age also affects so-called five senses including taste. Cowart et al. [17] found that the taste threshold of the elders to quinine and isohumulone increased compared to young people.
In sensory test, the cost of selecting and training panelists with sharp sensation also cannot be ignored. Therefore, an objective method of evaluating taste using an electronic tongue has been expected. The research on taste sensing started in the mid-1990s, before the elucidation of the principle of vertebrate taste receptors [18-20].
Since then, many studies on electronic tongues (e-tongue) [21-27] and bioelectronic tongues [28,29] have been carried out for taste assessment. The sensitivity of traditional electronic tongues is higher than bioelectronics tongue on the whole. However, traditional electronic tongues consist of a number of sensors whose selectivity are lower than bioelectronic tongues, and uses advanced mathematical procedures for signal processing based on the pattern recognition (PARC) and /or multivariate data analysis [30]. In the multivariate data analysis, the meaning of each principal component has to be explained. Although there is a disadvantage that the taste of an unknown sample cannot be objectively evaluated, the current e-tongue is superior in comparison between control samples and the application to quality management has also been expected.
-6-
1.3 Taste sensor (TS-5000Z) 1.3.1 Characteristic
In 1989, Toko et al. proposed the prototype of the taste senor (SA401, Anritsu Co. Ltd.) using the lipid polymer membrane as taste receptors. In 2007, the evolved taste sensor in Figure 1.2 (TS-5000Z, Intelligent Sensor Technology Inc., Kanagawa, Japan) has been invented and could measure all five basic taste qualities and astringency, respectively. This sensor has an unique characteristic called ‘global selectivity’, which means that each sensor does not distinguish each chemical substance, but distinguishes taste quality and taste intensity [31,32]. For example, the bitter substances are strongly hydrophobic while the salty taste substances are hydrophilic and contain a metal cation or a chloride ion in solution. The sensing principle of the taste sensor utilizes these physicochemical properties of taste qualities in Figure 1.3. Although this type of taste sensor utilizes fundamentally different principle from the receptor principle in human taste cells, it has been used widely because of the advantage of better selectivity than other electronic tongues, as well as better sensitivity and durability than bioelectronic tongues in the objective evaluation of the taste of food and pharmaceutical products (e.g., beer, coffee, traditional Chinese medicines) [32-34].
The lipid polymer membrane is composed of three elements: lipid, plasticizer and support material. Each sensor membrane is designed using different types and amounts of lipids and plasticizers. The lipid molecules are amphiphilic and have the role of adjusting the density of electric charges on the surface and the hydrophobicity of the membrane. The plasticizers and PVC basically have no charge and are added to form the membrane with softness and toughness [22,35,36 ,37].
-7-
Figure 1.2: Taste sensor (TS-5000Z)
Figure 1.3: Physicochemical properties of the five basic taste substances
-8-
1.3.2 Mechanism of taste sensor response
It is well known that an electrical double layer is formed on a charged membrane in accordance with classical Gouy-Chapman theory [38,39]. When the lipid polymer membrane is immersed in an aqueous solution, an electrical double layer is formed on the membrane surface by dissociation of lipid molecules, causing membrane potential.
The higher the sample concentration, the shorter the distance between the bulk and membrane becomes [32,40]. As an example of a positively charged film in an aqueous solution (Figure 1.4), the electric field E in the solution and the potential difference V satisfy the following integral equation.
𝑉 = ∫ 𝐸𝑑𝑥0𝑑 ……… (1.1) Here, d is the distance from the surface of the membrane. As the amount of the taste substance contained in the sample is larger, the reduction in the potential difference due to the shielding effect becomes greater. Therefore, taste substances contained in the sample can be quantified.by using a certain solution as a reference and comparing the potential difference between the reference solution and each sample.
The substance exhibiting sour taste ionizes to hydrogen ions and other anions, so the aqueous solution shows the acidic property. When we immerse a negatively charged lipid polymer membrane in an acidic solution, the suppression effect of the dissociation of hydrogen ions from lipid molecules happens and causes a change in membrane potential (Figure 1.5). Therefore, since the dissociation of hydrogen ions is suppressed, the electric charge of the lipid polymer membrane decreases and the potential difference changes.
-9-
Figure 1.4: Shielding effect.
Figure 1.5: Dissociation by pH and suppression of dissociation.
-10-
In addition to electrostatic interaction, there is hydrophobic interaction between the taste substances and the lipid polymer membrane. Hydrophobicity means the property of (a part of) a substance or molecule that has low affinity for water and is difficult to dissolve in water or mix with water. Among the hydrophobic substances exhibiting tastes, there are quinine (bitter), iso-α-acid (bitter), and tannic acid (astringency). Since these substances are ionized in an aqueous solution, they are positively or negatively charged. When the hydrophobic membrane is immersed into a hydrophobic taste solution, the ionized hydrophobic substance causes physical adsorption due to hydrophobic interaction with the hydrophobic group of lipid or plasticizers in the lipid polymer membrane to change the charge state.
-11-
1.3.3 Measurement of taste sensor
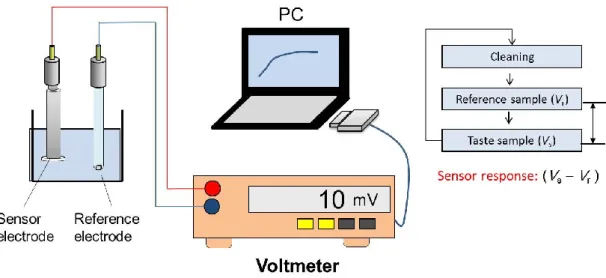
The difference of membrane potential between sensor electrode and reference electrode caused by the electrical and hydrophobic interactions is measured to evaluate the taste samples. Figure 1.6 shows the diagram of taste sensing system with sensor electrode and reference electrode. First, the sensor electrode and reference electrode are immersed in the reference solution of 30 mM KCl and 0.3 mM tartaric acid to obtain the membrane potential Vr after the membrane pretreatment. The reference solution has almost no taste and mimics human saliva. Second, the electrodes are moved to the sample solution to obtain the potential Vs. Third, the sensor electrodes are slightly rinsed by the reference solution and moved to a reference solution again to obtain Vr’.
As shown in Figure 1.7, the difference in potential (Vs – Vr) is called the relative value.
The difference in potential (Vr’ – Vr) is called CPA (change of membrane potential caused by adsorption) [41]. The relative value and CPA value (change of membrane potential caused by adsorption) are two outputs of the taste sensor used at the taste evaluation. The relative value approximates the initial taste derived from hydrophilic taste substances at sensory evaluation, including sourness, saltiness, and umami. On the other hand, the CPA value approximates the after taste derived from hydrophobic taste substances including bitter and astringent substances, providing change of membrane potential due to the adsorption on the lipid polymer membrane [42]. In recent years, as the relationship between CPA value and adsorption amount has been clarified, the evaluation of bitterness using the taste sensor has been placed great expectations in food and pharmaceutical industries.
-12-
Figure 1.7: Measurement procedure of taste sensor.
Figure 1.6: Diagram of taste sensing system.
-13-
1.4 The purpose of this study
The purpose of this paper is to enhance the performance of the taste sensor for education with a lipid-impregnated membrane as well as the taste sensor with a strongly hydrophobic lipid polymer membrane. We hope to promote the application of the taste sensor in the field of education, agriculture, and bitterness evaluation through this research.
First, we discussed about a simple taste sensor used for education, which uses a lipid-immersed Teflon filter as the sensing material. This sensor could be made easily by the students but has low selectivity. However, we thought the selectivity is important for the students to recognize the usefulness of the taste sensor. So in Chapter 2, we aimed to develop a do-it-yourself (DIY) taste sensor set for education with better sensor selectivity. As a result, we proposed a fabrication method of the taste sensor for education using cheap and commonly used materials which can be easily realized by the students of middle school or high school. The taste sensor for education was improved to respond selectively to salty and sour samples by adjusting the composition of lipids and plasticizers.
Second, we aimed to improve the performance of the taste sensor in sensitivity and durability. In Chapter 3, we discussed the influence of the pretreatment process on the taste sensor with the strongly hydrophobic membrane. As a result, we found that the sensor response has a great correlation with the pretreatment time and both the adsorption amount and the surface charge density of the lipid polymer membrane affect the CPA value. In Chapter 4, we investigated the reason for the deterioration in the response of the BT0 sensor by measuring the membrane potential, contact angle, and adsorption amount, as well as by performing gas chromatography-mass spectrometry
-14-
(GC-MS), liquid chromatography-tandem mass spectrometry (LC-MS/MS). We found that the change in the surface charge density caused by the hydrolysis of plasticizer led to the deterioration of the response. The acidic environment generated by lipid promoted plasticizer hydrolysis. Finally, we succeeded in fabricating a new membrane for sensing the bitterness of medicines with higher durability and sensitivity by adjusting the proportions of the lipid and plasticizers.
Third, we attempted to evaluate the interaction between two taste qualities with multiple sensor electrodes. In Chapter 5, we develop a quantitative prediction method to evaluate the bitterness of medicines suppressed by high-potency sweeteners using the taste sensor. As a result, we proposed a quantitative prediction method to evaluate the bitterness masking effect of high-potency sweeteners using the taste sensor. The quantitative prediction method showed a good correlation between the estimated bitterness scores and the sensory scores.
Finally, in Conclusion, we summarized the results of Chapter 2~5, and stated the future prospects.
-15-
Chapter 2
Taste Sensor for Education with Selectivity to Salt and Citric Acid [43]
2.1 Background
2.1.1 Attitudes towards science among students
According to the results of the Trends in International Mathematics and Science Study (TIMSS) conducted in 2015 by the International Association for the Evaluation of Educational Achievement (IEA), 37% of grade-two junior high school students in Japan do not like learning science, while the proportion of all the 29 participating countries is 19% in average. Japan ranked second to the last. Another investigation on students confident in science was also carried on these 29 countries. 68% of grade-two junior high school students in Japan do not confident in science, while the average is 40%.
Japan ranked the last. Not only Japan, many countries in Asia ranked behind. The result pointed out that lack of interest and confidence in science among students is still a serious problem in Asia, especially in Japan [44]. In addition, Programme for International Student Assessment (PISA) conducted in 2006 by the Organization for Economic Co-operation and Development (OECD), reported that only 42% of grade-one high school students in Japan clearly understood the contribution science could do to human life. While the proportion of all the 57 participating countries is 67%
in average, which showed lack of awareness of the close contact between science study and human life [45]. Therefore, it is significant to let the students recognize the usefulness of the science subjects such as physical, biological and chemistry.
-16-
Table 2.1: Relationship between taste sensor and science education.
Characteristics of Taste Sensor
Subjects Context of Science in High School
Context of Science in Junior High School Utilization of lipid membrane Biology Hydrophilic & hydrophobic Cell and cell membrane Interaction with taste substance Chemistry Ionization equilibrium Chemical change and ion Measurement of voltage Physics Current and electrical circuit Current and voltage
Figure 2.1: The electrode of taste sensor for education.
-17-
2.1.2 Problems of current taste sensor and purpose of this chapter
At this moment, many events on science education targeting high school students have been held in an attempt to solve the problem of lacking of interest and confidence in science [46]. In this study, we also attempted to apply the taste sensor into a Japanese science class, because the features of taste sensors are related to the science subjects of high school and junior high school, which are showed in Table 2.1.
The idea of taste sensor for education has been proposed to let the students make a taste sensor and use this sensor to measure taste qualities [47]. The fabrication and measuring process might help students to understand the related science knowledge and stimulate their enthusiasm for scientific experiments. However, it is unrealistic to make a commercial taste sensor in a science class, because the fabrication process takes 3 days in order to completely dry the solvents in the membrane. Moreover, the organic solvent, tetrahydrofuran (THF) used in the fabrication of the lipid polymer membrane, distributes a bad smell and may cause stimulus and nausea to human’s mucosa [48].
Therefore, the fabrication method of the do-it-yourself (DIY) taste sensor for students which can be made easily in a short time without THF is as follows [49].
The detailed method is as follows.
(1) Cut the Teflon membrane into about 1 cm2
(2) Paste the cut Teflon membrane onto the head of a hollow bar using an instant adhesive
(3) Dry the instant adhesive for 1 minute
(4) Immerse the attached Teflon membrane in the lipid solution (single lipid with ethanol) for 30 seconds
(5) Dry the solvent of lipid for 10 minute
-18-
(6) Inject the inner solution containing 3.3 M KCl and saturated AgCl into the PVC hollow rod by using a pipette
(7) Completed by attaching an Ag/AgCl electrode to the PVC hollow rod
The photo and structure of taste sensor electrode for education is shown in Figure 2.1. The above process takes about 20 minutes without using THF at all. In addition, the lipid solution was diluted by the ethanol, which reduces the risk during the fabrication.
We used this sensor to measure different concentrations of salt and citric acid solution.
The sensor response showed good concentration dependence to both salt and citric acid [49]. However, there is no sensor selectivity to salt or citric acid using this sensor. In order to let the students realize the usefulness of the educational taste sensor, we intended to improve the sensor selectivity to saltiness and sourness. Moreover, although the above fabrication method excludes the risk of THF, fixation of the Teflon membrane still needs an instant adhesive, which may cause danger to children. Therefore, we prefer a new method without using an instant adhesive. In order to increase the fun of the experiment and reduce the cost of production, the stationery around children is taken into consideration as much as possible [50].
In this chapter, we reported a simple taste sensor for education with the selectivity to saltiness and sourness as well as a new fabrication method which can be made easily in a short time without THF and instant adhesives. In the end, we carried out science classes using handmade taste sensors and evaluated the educational effect of the class [43].
-19-
2.2 Experiment 2.2.1 Materials
The Teflon membrane filter (80 µm thick) purchased from Advantec Co. Ltd., Tokyo, Japan is used as a lipid-holding membrane. The polyvinyl chloride hollow rod is replaced by a pencil cap, which can be easily available from a stationery store. The terminal cap purchased from Morigin Co. Ltd., Tokyo, Japan is used to fix the membrane onto the top of the hollow rod. TOMA (trioctylmethylammonium chloride) and PAEE (phosphoric acid di(2-ethylhexyl) ester) purchased from Tokyo Chemical Industry Co., Ltd. As shown in Figure 2.2, TOMA is positively charged in solution due to the hydrolysis of chloride ions; PAEE is negatively charged in solution owing to the ionization of phosphate group.
2.2.2 Selectivity improvement
Because TOMA and PAEE are ionized in solution and charged positively and
negatively, respectively, the charged state of the sensor membrane can be controlled by adjusting the amount of TOMA and PAEE. In this way, we considered that the balance of positive and negative charges is important for the response to saltiness and sourness.
In the electrostatic interaction, attraction or repulsive force expressed by Coulomb's law works between positive and negative charges. Therefore, in this experiment, TOMA and PAEE were mixed at a volume ratio of 3: 1, 2: 1, 1: 1, 1: 2, 1: 3 (corresponding to molar ratios: 2.16, 1.44, 0.72, 0.36, 0.24). The ethanol used for dilution accounts for 50% of the total lipid solution. The lipid mixed solution was stirred with a stirrer for 1 hour.
-20-
Figure 2.2: Chemical structures of TOMA and PAEE.
-21-
Figure 2.3: Design concept of the charged lipid membrane for salt.
Figure 2.4: Design concept of the charged lipid membrane for citric acid.
-22-
As shown in Figure 2.3, on the one hand, the membrane for saltiness is designed to be positively charged and attract chloride ions. The membrane potential decreases owing to the electrostatic interaction of negatively charged chloride ions. On the other hand, we want to find the balance of attractiveness to citrate ions and the suppression of ionization of phosphate group in the citric acid solutions. Therefore, the membrane is considered to respond to only salt but not to citric acid.
As shown in Figure 2.4, on the one hand, the membrane for sourness is designed to show electricity in nearly neutral. Therefore, the membrane is considered not to attract any sodium ions or chloride ions. On the other hand, the membrane potential increases because of the suppression of ionization of phosphate group in the citric acid solutions.
Therefore, the membrane is considered to respond to only citric acid but not to salt.
2.2.3 Sensory test
Six mixed samples #1 ~ #6 with salt and citric acid (# 1 salt 2.0 g / 500 mL, citric
acid 0.25 g / 500 mL; # 2 salt 4.0 g / 500 mL, citric acid 0.25 g / 500 mL, # 3 salt 8.0 g / 500mL, citric acid 0.25 g / 500 mL; # 4 salt 2.0 g / 500 mL, citric acid 0.5 g / 500 mL, # 5 salt 4.0 g / 500 mL, citric acid 0.5 g / 500 mL; # 6 salt 2.0 g / 500 mL, citric acid 1.0 g / 500 mL) were used in the sensory test. The concentration difference among these samples was set to close to 1.2 times, which is called the minimum concentration difference people can distinguish in taste. The panelists were general college students who have not received any special training on sensory testing. Based on sample #1, we randomly sorted the samples #2 to #6 and let the panelists map the results in the following two-dimensional answer sheet (Figure 2.5).
-23-
2.2.4 Improvement of fabrication procedure
In the fabrication of the conventional taste sensor for education, the sensor membrane can be completed in 20 minutes without using THF. However, in order to prevent the accidents such as mischief of children and gluing fingers caused by usage of the instant adhesive, we renewed the fabrication method by using a terminal protective cap instead of the instant adhesive. In the science class we conducted before, the students often failed to complete the sensor electrode because bubbles entered when inserting the inner solution. By using the transparent pencil cap instead of the PVC hollow rod, the students can make sure there is no bubble in during the fabrication of sensor electrode. First, a hole about 0.5 cm2 was cut in the head of two terminal protective caps. Then fix the smaller terminal protective cap to thread part of Ag/AgCl electrode. Cut the Teflon membrane filter into about 2×2 cm and sandwich the Teflon membrane between the pencil cap and the bigger terminal protective cap. (Expose the Teflon membrane through the hole). Make sure there was no gap between Teflon membrane and the pencil cap. Then drop a dropwise of lipid onto the exposed part of membrane using a pipette and naturally dry the membrane for 10 min. Next, inject the inner solution containing 3.3 M KCl and saturated AgCl into the pencil cap by using a pipette. Finally, fix an Ag/AgCl electrode to the pencil cap (Figure 2.6). The completed taste sensor for education is shown in Figure 2.7 [43].
-24-
Figure 2.5: The answer sheet for sensory test
Figure 2.6: The fabrication procedure of taste sensor used in science class [51].
-25-
Figure 2.7: The completed taste sensor for education.
-26-
2.2.5 Measurement method
As shown in Figure 2.8, to record the time to reach a stable membrane potential during the development of the sensor kit, we connected the sensor electrode to the positive terminal of the voltmeter and the reference electrode to the negative terminal of the voltmeter. We used a computer to observe the voltage between the electrode and the reference electrode. Firstly, we measured the membrane potential Vr in a reference solution comprising 30 mM KCl and 0.3 mM tartaric acid. Then the sensor electrodes were moved into a sample solution based on the reference solution and the potential Vs
is obtained. We defined value difference (Vs - Vr) as the sensor response. Finally, the electrodes are subsequently rinsed with a reference solution again for about 3 seconds before the next measurement.
-27-
Figure 2.8: Schematic of measurement system at developing stage.
Figure 2.9: Schematic of measurement system at science classes.
-28-
2.2.6 Application in Science class
In order to prove the usefulness of the improved taste sensor for education, we applied the sensor fabricated by the above method in a science class in Japan. In the science class, we use a small tester instead of a digital voltmeter, which was easier to carry. The objects of the science class were 28 high school students (11 boys and 17 girls). The students were divided into five groups with five or six students in every group. Five TA students from our lab were assigned to each group to guide the experiment.
The goal of each group was to fabricate one saltiness sensor and one sourness sensor using the method in section 2.2.4. Only the student volunteers participated in the sensory test. The method of the sensory test was the same to that of section 2.2.3 except for the adjustment in citric acid concentrations. Four mixed samples A ~ D with salt and citric acid were used in the sensory test. The concentrations were shown in Table 2.2.
The commercial mineral water was used as the reference solution. All the samples were made based on the reference solution (RS). At the end of the science class, we conducted a survey based on the following questions, which focus on student attitudes about fabricating the new taste sensor for education. Q1: Do you think today’s science class was a good opportunity to know more about the field of science subjects? Q2: Do you think it was difficult to fabricate a sensor by yourself? Q3: Do you like to make up something by yourself? Q4: What function do you want to improve the sensor?
-29-
Sample/500 mL #1 #2 #3 #4 RS
Salt 2 g 4 g 2 g 4 g 0 g
Citric acid 1 g 1 g 2 g 2 g 0 g
Table 2.2:Schematic of measurement system in science classes.
Figure 2.10: Response characteristics of saltiness and sourness [43].
-30-
2.3 Results and discussion
2.3.1 Improvement on sensor selectivity
In Figure 2.10, the vertical axis means the changes in the membrane potential (mV/dec) between high concentration sample and low concentration sample with ten times difference. The horizontal axis shows the volume ratio of TOMA: PAEE. The result showed that when TOMA and PAEE were mixed in the volume ratio of 1:1, the sensor response showed good selectivity for salty solution (saltiness sensor). When TOMA and PAEE were mixed in the volume ratio of 1:3, the sensor response showed good selectivity for citric acid solution (sourness sensor).
In Figure 2.11, the vertical axis means the relative value. Since the sensor response of the conventional taste sensor follows the Nernst equation, the logarithmic scale is adopted on the horizontal axis. From Figure 2.11, when TOMA : PAEE = 1: 1, the relative value was proportional to the logarithm of the sodium chloride sample concentration. On the other hand, when citric acid was added to the salt sample, the relative value kept almost unchanged. Therefore, when TOMA: PAEE = 1: 1, this sensor showed good selectivity to saltiness and can be used as saltiness sensor for science class. As shown in Figure 2.12, when TOMA: PAEE = 1: 3, the relative value was proportional to the logarithm of the citric acid sample concentration. On the other hand, when the sodium chloride was added to the citric acid sample, the relative value kept almost unchanged. Therefore, when TOMA: PAEE = 1: 3, the sensor showed good selectivity to sourness and can be used as sourness sensor for science class.
We considered the principle of the selectivity of saltiness and sourness sensor. The saltiness sensor has a positively charged membrane because TOMA was positively charged in a solution. Therefore, the sensor membrane attracts Cl- of NaCl and showed
-31-
a negative potential. However, the citric acid ions have little interaction with this positively membrane because of the repulsion. On the other hand, the sourness sensor has a neutrally charged membrane because the charge of both TOMA and PAEE were neutralized. Therefore, the sensor membrane cannot attract Na+ or Cl-. However, the pH decreased when the sensor membrane was put into a citric acid solution, which leads to a suppression of dissociation of H+ from PAEE. Therefore, the sensor membrane showed a positive potential in citric acid solutions.
-32-
Figure 2.11: The relative value with increasing sodium chloride (Mixing ratio, TOMA: PAEE = 1: 1) [43].
Figure 2.12: The relative value with increasing citric acid (Mixing ratio, TOMA: PAEE = 1:
3)[43].
-33-
2.3.2 Result of sensory test
The high standard deviation showed in Figure 2.13, indicated that different people have different sense of taste intensity. The Figure 2.14 shows the results of the taste sensor for education fabricated by the above method. The positional relationships in Figure 2.13 and Figure 2.14 are in good agreement. In addition, the standard deviation of the sensor response is much lower. By comparing the result of the sensory test and the result of the educational taste sensor, it is considered that the taste sensor could be a good experimental example that makes the students realize the ambiguity of human senses and the usefulness of the taste sensor.
2.3.3 Science class
As shown in Figure 2.15 and Figure 2.16, the relationship of the positions of the samples between sensory test and the sensor response were the same, which proved that both saltiness sensor and sourness sensor were successfully made by students themselves.
According to the result of questionnaire, more than 92% students thought the science class was a good opportunity to know more about the field of science subjects.
On the evaluation of the new fabrication method, half of the students thought it was difficult while half don’t think so. After the science class, more than 92% students thought they like making up something by themselves. The function the students most want to improve is to measure the commercial drinks using the taste sensors.
-34-
Figure 2.13: Result of sensory test [43].
Figure 2.14: Relative values of saltiness and sourness sensors [43]
-35-
Figure 2.15: Result of sensory test of students
Figure 2.16: Relative values of saltiness and sourness sensors of students
-36-
2.4 Conclusion
So far we have developed the sensor membrane by impregnating the Teflon membrane into a single lipid. In the chapter, we succeeded in providing selectivity to saltiness and sourness by adjusting the mixing ratio of lipid TOMA and PAEE.
Furthermore, we developed a method to fabricate taste sensors for education using more safe and normal stationeries.
To demonstrate the usefulness of this taste sensor for education, we applied this taste sensor into a science class for high school students. The students succeeded in the fabrication of the saltiness sensor and sourness sensor and used the sensors to measure mixture samples of salt and citric acid, which is proved a useful teaching material for science class.
-37-
Chapter 3
Preconditioning Process for Taste Sensor with a Strongly Hydrophobic Membrane [52]
3.1 Background
3.1.1 Hydrophobic membrane of taste sensor
As we introduced in Chapter 1, the membranes of the commercial taste sensor (TS-5000Z) consist of lipid, plasticizer and polymer. The lipid is used to adjust the charge density on membrane surface. The plasticizer is used to improve the softness and toughness of membrane. Both lipid and plasticizer can affect hydrophobicity of the membrane. Polyvinyl chloride is used to form the membrane as a supporting material [22].
Because the lipid has both hydrophobic and hydrophilic groups, the surface of the membrane shows hydrophilic when the lipids are arranged with the hydrophilic part facing the water. As shown in Figure 3.1, although saltiness sensor and bitterness sensor (-) for acidic bitterness adopted the same kind of lipid, they have different characteristics.
The bitterness sensor (-) has a hydrophobic membrane surface because the amount of lipid is relatively small while the saltiness sensor has a hydrophilic membrane because the amount of lipid is relatively large.
-38-
Figure 3.1: The lipid polymer membranes for saltiness and bitterness (-)
-39-
3.1.2 Detection of pesticide surfactants
As food safety issues attract more and more attentions, the sensor with a lipid polymer membrane has been used to detect agriculture chemicals [53], cyanide [54] and organic substances [55]. In agriculture production, pesticide residues have always been an important issue. As we know, pesticides consist of active ingredients (AIs) and pesticide adjuvant. The pesticide adjuvant is composed of carriers and surfactant. The carriers are used to carry AIs and facilitate pesticide handling while the surfactant is used to emulsify, disperse and spread AIs and diluents as well as increase their solubility.
Because there are too many types of AIs and the physiochemical properties are quite different from each other, the conventional methods can only detect very few kinds of pesticide species. There are 799 types of pesticides registered in total in Japan. For example, ELISA (enzyme-linked immunosorbent assay) targets about 30 types of pesticides [56]. Cholinesterase inhibition assay targets approximately 20% pesticides registered in Japan [57]. In 2012, a screening method for pesticide residues by detecting anionic surfactants used as pesticide adjuvants was examined by membrane measurement using a surfactant-sensing membrane composed of tridodecylmethylammonium chloride (TDAB). It is reported that the sulfonate anionic surfactant, sodium dodecyl sulfate (SDS), was detected under 10 ppb. The Chemical structures of TDAB and SDS are shown in Figure 3.2. The sensor showed a specific response to a coexisting surfactant, but no response to the AIs [58]. More pesticides could be detected by indirectly measuring the amount of SDS contained in pesticides because an anionic surfactant accounts for approximately 70% of registered pesticides.
[59].
-40-
Figure 3.2: Chemical structures of TDAB and SDS.
-41-
3.1.3 Preconditioning process of lipid polymer membrane
The sensor electrode and a reference electrode were used in the measurement of membrane potential. Before measuring the membrane potential, there is an important pretreatment step for the lipid polymer membrane. The bottom of the sensor electrode with the membrane and the reference electrode were immersed in a solution for several days. The immersion process in reference solution (30 mM KCl and 0.3 mM tartaric acid) is called reference preconditioning. The immersion process in monosodium glutamate (MSG) solution (10 mM MSG, 30 mM KCl and 0.3 mM tartaric acid) is called MSG preconditioning (usually for strongly hydrophobic membranes).
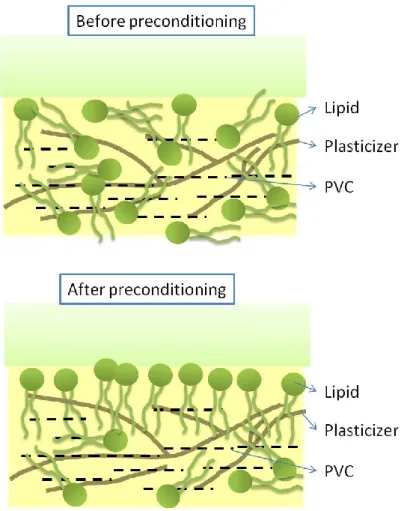
As shown in Figure 3.3, before the preconditioning, there is a messy distribution of lipids in the membrane. After the preconditioning, the lipids will arrange regularly on the surface of the membrane with the hydrophilic part facing to the solution, because of self-organization. The preconditioning process can help improve the membrane properties such as surface structure and charge density of the lipid polymer membrane.
The reference preconditioning is used for most of the taste sensor electrodes while the MSG preconditioning is used for a bitterness sensor (-) (for acidic bitterness), which equipped with a hydrophobic membrane [60].
-42-
Figure 3.3: The diagram of the preconditioning process
-43-
3.1.4 The current problem and the purpose of this chapter
Although the relative value of the pesticide sensor showed good concentration dependence on SDS concentration, the CPA did not respond to SDS even after a reference preconditioning. As shown in Figure 3.4, when the sensor membrane was pretreated by MSG preconditioning for one day, the CPA value showed good concentration dependence on SDS concentration. If you look at Figure 3.5 you will find that the reference potential kept stable with the measurement times after the MSG preconditioning. On the other hand, the reference potential decreased to minus without the reference preconditioning. We think the research will contribute to the development of high-sensitivity sensor for hydrophobic substances if we know the response properties during the MSG preconditioning. Therefore, the purpose of this chapter is to reveal the membrane properties during MSG preconditioning using a strongly hydrophobic membrane for SDS detection. In this chapter, we investigated the relationship between the CPA value of the sensor for SDS and period of MSG preconditioning. The amount of adsorbed SDS and MSG was also measured to figure out whether the CPA value is related to the amount of adsorption.
-44-
Figure 3.4: Relationship between CPA value and SDS concentration
Figure 3.5:Relationship between reference potential and SDS concentrtion
-45-
3.2 Experiment 3.2.1 Chemicals
TDAB was purchased from Sigma-Aldrich, Inc. (St. Louis, MO, USA).
2-Nitrophenyloctyl ether (NPOE) was purchased from Dojindo Laboratories (Kumamoto, Japan). Polyvinyl chloride (PVC) and SDS were purchased from Wako Pure Chemical, Ltd. (Osaka, Japan). MSG, KCl and tartaric acid were obtained from Kanto Chemical Co., Inc. (Tokyo, Japan). TDAB (log P = 15.55) shows strong hydrophobicity in the monomeric state. TDAB can be ionized into TDA+ and Br- in solutions. Therefore, the membrane with TDAB positively charges and can detect the negatively charged SDS in samples. All aqueous solutions were prepared with deionized water. The chemical structures of these substances are showed in Figure 3.6 PONALKIT-ABS was purchased from Dojindo Laboratories and YAMASA L-Glutamate Assay Kit was purchased from YAMASA Co., Ltd (Tokyo, Japan).
3.2.2 Fabrication of lipid polymer membrane
The fabrication steps are as follows. Firstly, TDAB, NPOE and 800 mg PVC were dissolved by 10 ml THF and stirred for one hour. Secondly, the above solution was poured into a 90 mm glass Petri dish and the THF volatized off and the membrane formed. Thirdly, the membrane was cut into about 1×1 cm and stuck to the sensor probe using an adhesive of 10 mL THF and 800 mg PVC. Fourthly, 0.2 mL inner solution of 3.3 M KCl and saturated AgCl was filled into the sensor probe using a syringe. Finally, the sensor electrode was completed by attaching an Ag/AgCl electrode to the sensor probe.
-46-
Figure 3.6: Chemical structures of NPOE and MSG
-47-
3.2.3 Membrane potential measurement
First, the sensor electrode was immersed in the MSG preconditioning solution (10 mM MSG, 30 mM KCl and 0.3 mM tartaric acid) from 0 to 5 days before the measurement. Second, the sensor electrode and reference electrode were immersed in the reference solution comprised of 30 mmol/L KCL and 0.3 mmol/L tartaric acid and obtain membrane potential Vr. Third, the sensors were immersed into a sample solution and obtain membrane potential Vs. Finally, the sensors were immersed into the reference solution again and obtain membrane potential Vr’ after being lightly rinsed by the reference solution. Here, we defined the difference between potential (Vs - Vr) the relative value and the difference between potential (Vr’ - Vr) the CPA (the Change in the membrane Potential caused by Adsorption) value [61,62]. Finally, the membrane potential retuned to Vr, when the membrane rinsed with a sensor-rinsing solution (30 vol% ethanol, 100 mM KCl and 10 mM KOH).
3.2.4 Measurement of adsorbed SDS
The lipid membrane used for measurement of adsorbed SDS was made in 45 mm glass Petri dish. Before the measurement, the MSG preconditioning solution was poured onto the membrane in 45 mm Petri dish for the certain days (0, 1, 2, 3, 4 or 5 days).
PONALKIT-ABS kit was used to measure the amount of adsorbed SDS. In PONALKIT-ABS kit, the ion pair of Co-5-Cl-PADAP and SDS is extracted to the organic phase, which made the organic phase colored. The SDS concentration can be calculated by measuring the absorbance of the organic phase. The chemical structure of Co-5-Cl-PADAP and organic solvents are shown in Figure 3.7 and Figure 3.8. The coloring principle of organic solvent is shown in Figure 3.9.
-48-
Figure 3.7: Chemical structure of Co-5-Cl-PADAP (colorimetric reagent)
Figure 3.8: Chemical structure of anisole and cyclohexane (organic solvent)
-49-
Figure 3.9:Coloring principle of organic solvent
Figure 3.10: Measurement procedure of adsorbed SDS
-50-
The measurement procedure of adsorbed SDS is shown in Figure 3.10. First, calibration curves were obtained by measuring the standard solutions of SDS in known concentrations. Second, 6 mL of SDS solution was dropped onto the lipid polymer membrane in the 45 mm glass Petri dish. SDS was allowed to absorb onto the membrane for 60 s. Then, 5 mL of SDS solution was taken from the Petri dish using a pipette. The absorbance of the extracted 5 mL of sample solutions was measured and the corresponding concentration was calculated using the calibration curve. The amount of the adsorbed substance by the membrane was calculated from the difference between the amounts of SDS before and after adsorption.
3.2.5 Measurement of adsorbed MSG
YAMASA L-Glutamate Assay Kit was used to measure the amount of adsorbed MSG. YAMASA L-Glutamate Assay Kit is a test kit for determination of L-glutamate using L- glutamate oxidase specific to L-glutamate.
Hydrogen peroxide is produced due to oxidation reaction of L-glutamic acid oxidase. The enzymatic reaction among peroxidase, 4-Aminoantipyrine (4-AA) and DAOS causes the blue dye. The MSG concentration can be calculated by measuring the absorbance of the blue dye. The measurement principle is shown below.
① Oxidation reaction of L-glutamic acid oxidase:
L-glutamic acid + H2O + O2 → α-ketoglutaric acid + NH3 + H2O2
② Blue dye formation by peroxidase:
H2O2 + DAOS + 4-AA → blue dye (600 nm)
-51-
The measurement procedure of MSG is similar to that of SDS. First, calibration curves were obtained by measuring the standard solutions of MSG in known concentrations. Second, 5 mL MSG were dropped onto the lipid polymer membrane in the 45 mm glass Petri dish. MSG was allowed to absorb onto the membrane for 30 s.
Then, 5 mL of MSG solution was taken from the Petri dish using a pipette. The absorbance of the extracted 5 mL sample solutions was measured and the corresponding concentration was calculated using the calibration curve. The amount of the adsorbed substance by the membrane was calculated from the difference between the amounts of MSG before and after adsorption.

![Figure 2.6: The fabrication procedure of taste sensor used in science class [51].](https://thumb-ap.123doks.com/thumbv2/123deta/9916752.1918820/35.892.224.654.547.998/figure-fabrication-procedure-taste-sensor-used-science-class.webp)


![Figure 3.11: The relationship between the CPA value and preconditioning time [52]](https://thumb-ap.123doks.com/thumbv2/123deta/9916752.1918820/64.892.192.694.154.515/figure-relationship-cpa-value-preconditioning-time.webp)
![Figure 3.13: The relationship between the amount of adsorbed MSG and preconditioning time [52]](https://thumb-ap.123doks.com/thumbv2/123deta/9916752.1918820/66.892.216.694.186.537/figure-relationship-adsorbed-msg-preconditioning-time.webp)
![Figure 4.4: The response ratio with the preservation time (45 ºC and different humid condition) [65]](https://thumb-ap.123doks.com/thumbv2/123deta/9916752.1918820/82.892.182.707.164.612/figure-response-ratio-preservation-time-different-humid-condition.webp)
