Applying Rasch Measurement to the Analysis of Entrance Exam Item Types
Eton Churchill and David Aline
Introduction
Even though entrance examinations in Japan are used for making major decisions about the lives of examinees, little published research is conducted on these tests. Moreover, the practice of publishing previously administered exams places constraints on piloting and reusing items. In this paper, we suggest that an analysis of item types can inform test writers in their decision making process particularly regarding the inclusion and deletion of specific item types (e.g.,
identifying the correct accent, true-false questions, vocabulary
questions, sequencing questions, fill-in the article questions) as they
develop future tests. We illustrate this point through an analysis of a 2003 Kanagawa University Entrance exam in which we explore the comparative performance of item types involving different components of English proficiency, such as reading comprehension, grammatical knowledge and lexical knowledge.
Purpose of the Research
We began this research to improve the quality of Kanagawa University's entrance examination under the constraints of (a) not being able to reuse items, (b) having no test writing structure or guidelines beyond the format of previous tests, and (c) having no
specific information about the performance of previous tests based on principles of test analysis. Our broad research questions were:
1) What is the reliability of the 2003 March Exam?
2) How well is the difficulty of the items matching the ability of
the examinees?
3) What item types are performing well?
4) What item types, if any, are not performing well?
Based on an exploration of these questions, we hope to arrive at some recommendations for future entrance exams at Kanagawa University .
Method
Background
The first step in our project was to gain access to the entrance exam data. This was surprisingly easy as the Entrance Exam Center was interested in analysis that would go beyond the descriptive level that was then being performed. Following our request, the Entrance Exam Center provided us with Excel files of examinees and their individual responses to items for all of the 2003 Entrance Exams. We drew from this data for our analysis of the Listening Exam (Aline &
Churchill, 2004a), and the February B Form Exam (Churchill & Aline, 2004b). In this paper, we present the analysis of the March Exam
(Aline & Churchill, 2004b; Churchill & Aline, 2004a).
The March test is unique in that the examinees are taking the test most likely because they have not passed the test for the regular entrance exams given by most universities in February. Therefore, it is their last chance to enter Kanagawa University for that academic year.
Additionally, some students may be taking the exam as a practice test for the March entrance examination at other universities. It is also the entrance test for evening students.
Participants
There were 1,892 examinees sitting this exam: of those, 99 were
Applying Rasch Measurement to the Analysis of Entrance Exam Item Types 87
applicants to the Spanish and English departments, taking the test to enter the evening program.
and 182 were
Materials
Our analysis was conducted on the 2003 March Exam using WINSTEPS software. In this section, we outline the March Exam and briefly describe some features of the statistical package used in the analysis.
The 2003 March exam.
The exam consisted of five sections and 75 items as outlined in Figure 1. Section 1 has a reading text about bear cubs with 13 items: six vocabulary questions, two questions on phrases, one sequencing of
Section 1 (Reading text: Bear Cubs) 13 items (1.1-1.13) 6 vocabulary questions (1.1-1.6)
2 synonymous phrase questions (1.7-1.8) 1 sequencing question (1.9)
4 true-false questions (1.10-1.13)
Section 2 (Reading text: Carrier Pigeons) 14 items (2.1-2.14) 7 vocabulary questions (2.1-2.7)
2 comprehension questions (2.8-2.9) 1 sequencing question (2.10)
4 true-false questions (2.11-2.14)
Section 3 (4 turn conversations) 10 items (3.1-3.10) 10 conversation completion questions
Section 4 (Reading text: Olympics) 19 items (4.1-4.19) 6 vocabulary questions (4.1-4.6)
4 synonymous phrase questions (4.7-4.10) 4 true-false questions (4.11-4.14)
5 accent on word syllable questions (4.15-4.19) Section 5 (Grammar) 19 items (5.1-5.19)
9 fill-in the article questions (5.1-5.9)
5 choose the missing word questions (5.10-5.14) 5 ungrammatical sentence questions (5.15-5.19) All Questions are multible choice excebt for the true-false auestions
Figure 1. Test Structure
story events question, and four true-false questions. Section 2 consists of a reading passage on pigeons, followed by seven vocabulary questions, two comprehension questions, one sequencing question and four true- false questions. Section 3 has ten 3-5 turn conversations with a line or phrase missing from the conversation. The examinees select the phrase that best fits in the conversation. The format of Section 4 is similar to that of Sections 1 and 2 with a reading text followed by six vocabulary questions, four questions on phrases, a four item true-false section, and four items on placing the accent on the correct syllable of a word.
Section 5 focuses on grammar with a nine item fill-in-the-correct-article doze passage, six questions in which examinees select the best word for a blank in a sentence, and five questions in which they select the sentence with incorrect grammar. All of these items are multiple-choice except for the true-false questions, which have ten statements from which the examinees select the four true statements.
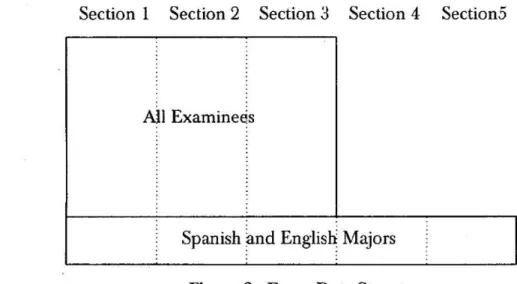
As the test is administered, only the Spanish and English majors take all five sections of the test. All of the other applicants only take the first three sections of the test. In other words, the test is simultaneously given to two different groups of students with the Spanish and English
majors given more time to take more items.
Section 1 Section 2 Section 3 Section 4 Section5
All Examinee s
Spanish and English Majors
Figure 2. Exam Data Structure
Applying Rasch Measurement to the Analysis of Entrance Exam Item Types 89
WINSTEPS and Rasch measurement.
Our analysis was performed using WINSTEPS version 3.47, a statistical package used to perform Rasch Analysis. Rasch measurement, developed by the Danish mathematician Georg Rasch, is one of a number of statistics falling under the heading of latent trait
theory or item response theory (Bond & Fox, 2001). Item response
theory includes a one-parameter model, a two-parameter model, and a three-parameter model. Although the Rasch model is often used in the field of applied linguistics to analyze language tests, it has also been criticized for measuring language because of its assumption of
unidimensionality (Choi, 1992). As Choi suggests, language does not fit
a single dimension and is perhaps better measured with the two or three parameter model.
One of the most important aspects of Rasch measurement for our purposes is that it constructs a linear model out of ordinal data.
Classical Testing Theory (CTT) bases outcomes on the population of
the initial examinees, but Rasch measurement looks at probability as an interaction between examinees and test items. Rasch places those calibrations on a unidimensional and hierarchical interval scale which allows one to simultaneously compare the ability of examinees and difficulty of items. For the . purpose of test analysis, this allows the researcher to look at the relative difficulty of specific test items on a person item map. It also makes it possible to compare the average ability of examinees that have chosen different distractors on a given item. As we will see later in this paper, this feature provides a powerful tool to evaluate how specific items are performing.
Analysis
Given that the test was a different length for the subgroups of examinees 75 items for the 99 Spanish and English majors and 37 items (only Sections 1 through 3) for the other majors, the data did not include responses for Sections 4 and 5 for a majority of the students (See Figure 2). As a result, we analyzed the data as two distinct tests:
first we present the data on all examinees together, including the Spanish and English majors, for the first three sections, and then we present the data for Sections 1 through 5 for just the Spanish and English majors. The reason for this approach to our analysis is that we are attempting to make a better test within the structure of the exam and the existing administration procedures used by the university.
In our presentation of the results below, we first present the analysis of Sections 1 through 3 taken by all examinees and then we discuss the performance of Sections 4 and 5 taken by the Spanish and English majors.
Results
Sections 1-3 for all Examinees: Reliability, Item Difficulty and
Discrimination
In the analysis of the first three sections of the test (37 items) for all examinees (N = 1,892), the Rasch analysis revealed a person reliability of .63. The mean ability of the examinees (M=54.28) was slightly higher than the mean difficulty of the items (M=50) suggesting that
Sections 1 through 3 were a little easy.
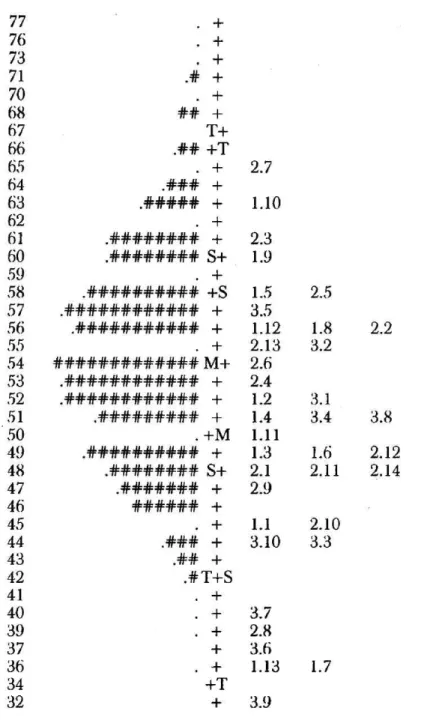
As mentioned in the description of WINSTEPS and Rasch measurement above, Rasch allows you to simultaneously look at the ability of persons and the difficulty of items on a single interval scale called a person item map. Figure 3 is the person item map illustrating the performance of all examinees on Sections 1 through 3 of the exam.
Before proceeding with the analysis, a brief description of the person item map may be helpful.
The person item map combines the performance of the examinees and items together on a single scale. On the left of the vertical axis are
placed the examinees, with each # (pound sign) representing 12
examinees. The examinees are located on the scale in increasing ability according to their average performance on all items. Examinees with lower average performance are placed near the bottom, with an
Applying Rasch Measurement to the Analysis of Entrance Exam Item Types 91
77 76 73 71 70 68 67 66 65 64 63 62 61 60 59 58 57 56 55 54 53 52 51 50 49 48 47 46 45 44 43 42 41 40 39 37 36 34 32
. + . + . +
.# +
+
##. + T+
.## +T .### +
.##### +
.
.######## + .######## S+
.
.########## +S
.############ +
.########### +
. ############# M+
.############ +
.############ +
.######### +
. +M
.########## +
.######## S+
.####### +
###### +
.
.### + .## +
.# T+S . + . + . + . + +T
2.7 1.10 2.3
1.9 1.5 3.5
1.12 2.13 2.6 2.4 1.2 1.4 1.11 1.3 2.1 2.9 1.1 3.10
3.7 2.8 3.6 1.13 3.9
2.5 1.8 3.2
3.1 3.4 1.6 2.11
2.10 3.3
1.7
2.2
3.8 2.12 2.14
Figure 3. Person Item Map for All Examinees
increasing order of ability toward the top of the scale. As we can see on the person item map, the average ability of the examinees, indicated by an M on the examinee side of the scale, is about 54. On the right side are placed the test items numbered according to their section and order. For example 3.4 is the fourth item in Section 3, and 2.10 is the tenth item in Section 2. The test items are placed on this scale according to their increasing level of difficulty. Items that are easy are at
the bottom and more difficult items are closer toward the top. Running up the left side is an interval scale, centered at 50 for the mean item difficulty. Because it is an interval scale, each unit is equal to any other unit on the scale so that, for example, the quality of the distance between 32 and 33 is equal to the quality of the distance between 58 and 59. This allows us to make equal comparisons. The examinees and items are related through probabilities such that an examinee placed at a specific point on the scale say 61 for example, indicating the examinees ability has a 50% likelihood of getting an item with the same level of difficulty in this case, item 2.3 correct. Examinees are less likely to score correctly on an item higher on the scale than their ability, and more likely to correctly answer an item lower on the scale.
On both the item and person side of the scale, one standard deviation away from the mean is indicated in the WINSTEPS generated table with an "S," and two standard deviations is indicated with a "T."
Looking at the person item map in Figure 3, Sections 1 through 3 appear to be functioning well as most of the items are not too difficult or too easy, and are measuring various examinee ability levels.
However, some questions in Section 3, those related to the three to five- turn conversation, are too easy as these items do not match the
examinees abilities. Items 3.6, 3.7, 3.9, and 3.10 are beyond or just about equal in difficulty to the second standard deviation from the mean ability of the examinees. Therefore, we need to examine why these particular items are not performing well when the other items in Section 3 appear to be matching the ability of the examinees. In our discussion of specific items below, we will discuss these conversation items.
In addition to allowing one to examine the comparative ability of examinees and difficulty of items, Rasch can provide an indication of how well individual items are discriminating. In the Rasch model, the expected discrimination index is 1.00, with scores considerably lower than this indicating that an item is under-discriminating and higher indices suggesting that the item is over-discriminating. Most of the
Applying Rasch Measurement to the Analysis of Entrance Exam Item Types 93
items in Sections 1 through 3 appear to be discriminating well with the exception of a few vocabulary items. Items 1.2, 1.5 and 1.8 had low discrimination indices of .59, .72, and .67 respectively, while Item 2.5 had a high discrimination index of 1.52. In our analysis of specific items, we will take a closer look at these items.
Sections 1 through 5 for the language majors: Reliability, Examinee Ability, and Item Difficulty
Before turning our attention to the analysis of specific items, we ran an analysis of the Spanish and English major's performance on all five sections (75 items) of the test. This was done to evaluate the reliability
of the test for this sub-group of examinees and to ascertain how they were performing on the test. It also allowed us to identify other items that deserved further scrutiny.
The person reliability of this exam was .80, much higher than the .63 for all the examinees on Sections 1 through 3. This difference may
be largely attributed to the larger number of items (75) taken by a smaller number of examinees (99 Spanish and English majors). It is also
a trend that we have observed in our analysis of two February 2003
exams (Churchill & Aline, 2004b; Churchill & Aline, 2004c). This suggests that the reliability for Sections 1 through 3 could be improved by adding more items to the test taken by the majority of examinees.
The mean ability of the language majors was 57.47, as compared to the mean item difficulty of 50, indicating that the test as composed of all five sections was a little too easy for the language majors.
Figure 4 shows the person item map of Sections 1 through 5 for only the Spanish and English majors. In this map, since there are fewer examinees, each pound mark represents one examinee. This map illustrates that many of the test items were too easy for most of the language majors as many of the items fall below the second standard
deviation from the mean examinee ability. While one might expect to see some of the items from Sections 1 through 3 to fall below the ability of the language majors, it is noteworthy that several items from
Sections 4 and 5 i.e., items designed for the language majors are also too easy. It would be preferable to see these items matching the ability of the language majors.
These results are an artifact of the test construction organization in our university. In the past, it has been assumed that a longer test will
79
70
60
50
41
30 21
XX T X T+
X XX XXX XXX
XXXX S
XXXXXXXX XXXX
XXXXXX S
XXXXXX +
XX XXXXXXXX
XX M XXXXXXX XXXXXXXXXX
XXXXX XXXX XXXXX
X S
XXXXXX +M
XX XX XXX
T X
X S
IT
4.11 5.19
4.2
2.7 4.4
1.10 2.3
1.12 1.5 2.13 2.2 4.15
1.2 2.4 2.6 1.4 2.12
1.6 3.5 1.11 1.3 2.10 2.9 1.1 4.8 5.8 1.13 3.7 1.7 2.8 3.9
5.7
4.6
5.18 4.5
1.9 4.16 4.10 4.14 5.1 4.13
1.8 2.5 2.1 3.8 4.19 5.3 2.14 2.11 3.10 4.9
3.6
5.15 5.9
5.13
3.1 4.1 4.17 4.3 5.17 5.5 3.3 5.11 4.18
5.16
3.2 5.10 5.4 4.7 5.6 4.12 5.12 5.2
3.4
5.14
Figure 4. Person Item Map for English and Spanish Majors Only
Applying Rasch Measurement to the Analysis of Entrance Exam Item Types 95
equal greater difficulty. However, as we see here, some of the items in Sections 4 and 5 are less difficult for the language majors than some items in Sections 1 through 3. This is clear evidence that we need more difficult reading passages for Sections 4 and 5, and that more difficult questions types need to be added. Added is the key word here as some of the questions from Sections 4 and 5 are functioning well. So, we need to take a closer look at the differences between the more
difficult questions and the easier questions. Along these same lines, there are a lot of questions that are measuring students at the same level of ability, for example there are several items (e. g., 1.3, 2.11, 5.11, 5.12, 5.14) at a difficulty level of 44. Since enough questions from Sections 1-3 are falling in this area, we may want different item types in Sections 4 and 5 that will measure other aspects of the examinees language abilities. Furthermore, as we are constrained in the vocabulary level we can test for the first three sections of the test, we may want to remove this constraint, that is test higher-level vocabulary, in sections
designed for the language majors.
Item Analysis
In the first half of this paper we gave an overview of the exam and explained the importance of the number of items in an exam to increasing its reliability. We will now go over specific sections of the exam and discuss how specific items types are performing. We will look at five different items types, beginning with items that were identified as potentially problematic in the initial analysis of item difficulty and discrimination. These are the easiest conversation items in Section 3, some questions in Section 5 on the article system, questions in Section 4 on identifying the accent, and questions in Section 5 requiring examinees to identify the incorrect sentence. Finally, we will discuss a few examples of items that were performing well both in terms of matching the ability of the examinees and in terms of discrimination.
Conversation items.
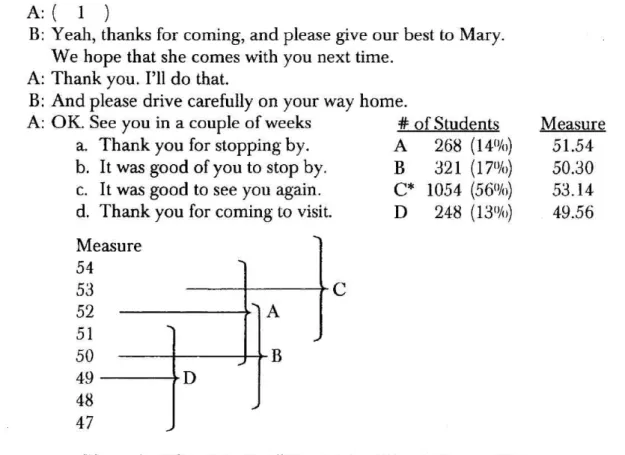
Beginning with the written conversation items on our exam, these consisted of three to five turn dialogs with one of the turns omitted. The examinees had to select the utterance from four choices that best completed the conversation. In our analysis we found that some of these items were very easy for our examinees while others were comparably more difficult. Upon further examination we found that the items that discriminated well and had a level of difficulty that better matched the examinees were items that entailed situational pragmatic utterances like the example in Figure 5. Here, only 56% of the
examinees had the correct answer while each of the other three distractors were attracting a little more than 14% of the examinees. One nice thing about Rasch analysis is that it also provides an average measure of the ability of the students who chose each answer. As we
can see, in this example, the mean ability level of the students who
chose the correct answer was higher (at 53.14) than the mean ability
A: ( 1 )
B: Yeah, thanks for coming, and please give our best to Mary.
We hope that she comes with you next time.
A: Thank you. I'll do that.
B: And please drive carefully on your way home.
A OK. See you in a couple of weeks a. Thank you for stopping by.
b. It was good of you to stop by.
c. It was good to see you again.
d. Thank you for coming to visit.
Measure
54
53
521 A
51
50 ---, B 49--- D
48 47
C
# of Students
(14%) (17%) (56°/°) (13%)
Measure A
B C*
D
268 321 1054 248
51.54 50.30 53.14 49.56
Figure 5. "Conversation" Items That Discriminated Well
Applying Rasch Measurement to the Analysis of Entrance Exam Item Types 97
level of students who chose the incorrect distractors. This is exactly what you want to have happen with an item. Graphically, this looks like the display in Figure 5 where a subgroup of 56°/0 of the population represented by the curve with a mean ability of 53 chose the right
answer C. A comparatively smaller group (about 14% of the students)
chose the incorrect answer A and the average ability of these students was at 51.5. As we can see, students with a lower average ability chose the other two distractors B and D, with students choosing D having the lowest average ability. This is the type of pattern that we like to see for our distractors. Conversely, we can begin to suspect that something is not working as planned when students choosing the wrong answer have a higher average ability than students who select that option coded as being correct. We will see some examples of this later in other sections of the test. For now, the point is that conversation items that tested utterances related to contextual appropriateness performed well in this section.
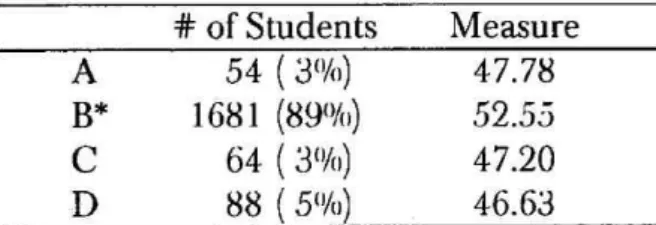
In contrast, we found that the items that were too easy tended to
entail wh-questions like the next example (See Figure 6). As we can see,
in this example close to 90% of the students got the correct answer and the distractors were not very good at attracting students. We believe
A B A B
Hey John, that's a good-looking tie!
Do you like it! My son gave it to me for Father's Day.
Oh, that's so sweet. ( 9 )
I'm not sure, but I think that he got it at the local department store.
a) When did he get it?
b) Where did he buy it?
c) Why did he buy it?
d) How did he buy it?
# of Students Measure A
B*
C D
54 (3%) 1681 (89%)
64 (3%) 88 (5%)
47.78 52.55 47.20 46.63
Figure 6. "Conversation" Items That Were Too Easy
that this is because of the nature of the wh-questions which can be fairly easily answered by simply reading the two turns concerned in the conversation, the question and the response. Thus, in the future, if we continue working with these "conversation" items, we will probably want to focus on questions that test pragmatic knowledge rather than items that deal with question-answer adjacency pairs.
The article system.
One item type was designed to test student knowledge of the article system. This question type occurred in Section 5 of the exam, so it was only taken by the 99 Spanish and English majors. As can be seen in Figure 7, students were given a short text in which they had to decide which was the appropriate article in nine instances. While some of these items performed well, three of these items did not. In order to see what is happening with some of these items, we have included the distractor frequencies and average measures for Items 4 and 7. In Item 4, we can see that 68% of the examinees chose the correct answer D,
Complete the following paragraph with the correct articles.
"a"=A
, "an" = B, "the"=C, null = D
My aunt lived on (1) ground floor of ( 2) old house on (3) River Thames.
She was very much afraid of ( 4) burglars and always locked up (5) house very carefully before she went to (6) bed. She also took ( 7) precaution of looking under (8) bed to see if ( 9) burglar was hiding there.
# of Students Measure
(4). A
B
C*
D
(7) A
B
C*
D
19 (19%) 1 (1 %) 11 (11%) 67 (68%) 67 (68%) 2 (2%) 12 (12%) 18 (18%)
57.77 40.52 56.89 57.63 57.99 61.30 56.50 55.74
Figure 7. Article Usage
Applying Rasch Measurement to the Analysis of Entrance Exam Item Types 99
while the remaining students selected mainly A and C. At first glance, we might think that this item is performing nicely, but when we look closer at the measures for the distractors, we can see that students with
a higher average ability (based on their performance on the rest of the test) were choosing the incorrect answer A. This tells us that the
item was not discriminating well between higher and lower level proficiency learners. The case is even more dramatic for Item 7 where over 70% of the examinees with a higher ability were choosing the incorrect answer while students with a lower ability selected the correct answer. With 3 out of the 9 items in this question having a similar problem in discriminating between better and less able students, we cannot have too much confidence in this item type. In a perfect world, if we were able to pilot test our items or reuse items that were working well, we could discard these 3 items and keep the other items.
However, since we cannot reuse items, we might be better served by staying away from this question type altogether. As a result, one of our recommendations is to avoid using questions that are based on the article system. However, before we discard this item type we will need to see how it performs on other tests. We may find through a more fine- grained analysis of questions involving the article system that some items, for example those involving post-modified nouns such as Item 7, do not discriminate well between examinees while other uses of the article do.
Identifying the accent.
Other items that did not do very well were questions that asked students to indicate where the stressed syllable was in isolated lexical
items (Figure 8). Three items in this question, "athletic," "competitors,"
and "marathon" did not do a particularly good job of discriminating between learners. Looking first at the results for number 1 (Item 4.15),
"athletic
," we can see that examinees incorrectly indicating that the stress was on the third syllable, distractor C, had a higher average
ability (58.18) than students who correctly noted that the stress was on
the second syllable (57.79). As with our discussion of items involving
the article system, this item was not discriminating well between the learners. With the second question, there is a slightly better story as
46% of the students with a higher ability (58.43) selected the correct answer B. However, one of the distractors (C) also attracted students with virtually the same ability. As three out of the five items in this question type did not do a very good job of discriminating between the
examinees, it is difficult for us to recommend that we continue writing such items in the absence of piloting or the opportunity to weed out items that are not functioning as designed.
Identify the accent in the following words. If the accent is on the first syllable, mark A. If the accent is on second syllable, mark B. The third syllable, mark C. If the accent is on any other syllable, mark D.
(1) athletic (2) competitors (3) original (4) marathon (5) unfortunately
# of Students Measure
(1) A
B*
C D
(2) A
B*
C D
28 (29%) 56 (57%) 13 (13%) 1 ( 1%) 28 (29%) 45 (46%) 22 (22%)
3(3%)
56.76 57.79 58.18 43.60 55.53 58.43 58.25 53.35
Figure 8. Identifying the Accent
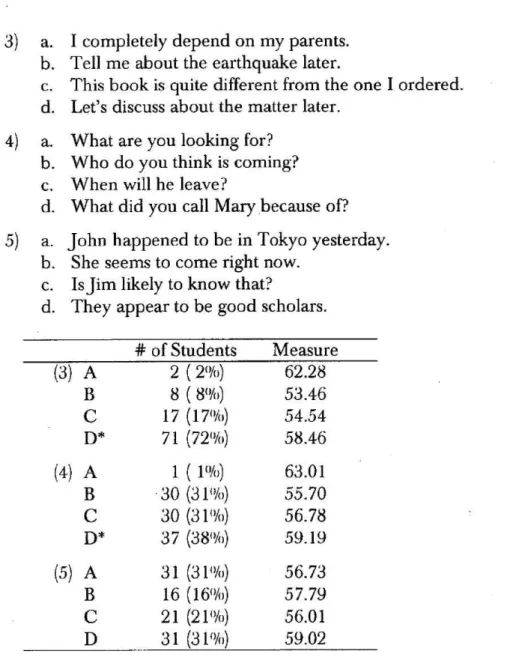
Identifying the incorrect sentence.
A final item type that exhibited problems in discriminating between students occurred in the last section of the test. In this section, the examinees were asked to read four sentences and select the one sentence that was grammatically incorrect. Three of the five items in this question format showed discrimination problems with higher average ability measures for students choosing the incorrect answers
Applying Rasch Measurement to the Analysis of Entrance Exam Item Types 101
(Figure 9). However, it should be noted that in Questions 3 and 4,
there were very few students with higher abilities choosing the incorrect
answer. Nevertheless, with Question 5 we can see that nearly one third
of the students chose the incorrect distractor D, and yet their average ability was higher than the students who chose the correct answer B. In the absence of preliminary testing of these item types, we will recommend that our exam committee avoid this item type.
3) a.
b.
c.
d.
4) a.
b.
c.
d.
5) a.
b.
c.
d.
I completely depend on my parents.
Tell me about the earthquake later.
This book is quite different from the one I ordered.
Let's discuss about the matter later.
What are you looking for?
Who do you think is coming?
When will he leave?
What did you call Mary because of?
John happened to be in Tokyo yesterday.
She seems to come right now.
Is Jim likely to know that?
They appear to be good scholars.
# of Students Measure
(3) A
B C D*
(4) A
B C D*
(5) A
B C D
2(2%) 8 (8%) 17 (17%) 71 (72%) 1 (1 %) 30 (31%) 30 (31%) 37 (38%) 31 (31%) 16 (16%) 21 (21%) 31 (31%)
62.28 53.46 54.54 58.46 63.01 55.70 56.78 59.19 56.73 57.79 56.01 59.02
Figure 9. Identifying the Incorrect Sentence
Items that performed well.
While the above items either did not discriminate well between the examinees or were not a good match in terms of difficulty, many of the items types performed well throughout the exam. Isolated vocabulary items involving synonyms and paraphrasing did consistently well on the exam as did most of the fill-in-the-blank sentence-long items testing grammatical knowledge and idiomatic expressions. In other words, items similar to those that commonly appear on the Eiken Step exams did well. As previously mentioned, conversation items that tested pragmatically appropriate responses also did well.
One point to note about these item types, however, is that their difficulty level fell mostly between 40 and 70, as illustrated by the scale on the right of Figure 10. To help see what kinds of lexical items were being tested, we have written the word being tested with its item
Isolated Vocabulary items involving synonyms and paraphrasing
One sentence long items testing grammatical
knowledge and idiomatic expressions
"Conversation" items th at tested situationally
appropriate language vs.
content
Figure 10.
Difficulty measures for vocabulary and idiomatic expressions
72 70 68 66 64 62 60 58 56 54 52 50 48 46 44 42 40 38
humble (4.6) carved (4.2)
for a glimpse of (2.7)
destination (4.4), desperate (4.5) to train (2.3)
become nuisances (1.5)
to witness (2.5), to be on good terms (5.13) isolated (2.2), overcast (2.6)
smell (1.2), eager (2.4), thought highly of (4.1)
to fare (1.4), took control of (4.3)
made it through (1.3), an approach (1.6) invented (2.1), clients (5.11)
on all fours (1.1), make sense (5.12), figure out (5.14)
Item Types That Performed Well
Applying Rasch Measurement to the Analysis of Entrance Exam Item Types 103
number in parentheses. There are two points that we would like to make about this graphic. The first is that this constitutes the beginning of an item bank based on the lexical type questions that performed well on this test. While our university does not allow us to use identical items from year to year, we could put together a bank of words with their difficulty levels over time and then eventually write future items borrowing from the database of target words that we have put together.
This might be one way for us to negotiate our exam making constraints in an informed manner over time. Another point that we think is worth making is that lexical items and items focusing on expressions seem to peak in difficulty a little under 70. Ideally, we would like to have some more difficult items on our test to help discriminate more accurately between the better students. However, it is quite likely that the limitations placed on our exams by the word list put together by
Monbukagakusho (MEXT) is such that items based on lexical terms
and expressions alone will not lead to higher difficulty levels. Under such constraints, the challenge is to write more difficult items with the limited vocabulary lists that we are given. It may very well be that the best way to do this is by using reading questions that ask learners to infer or require examinees to look at the sequential cohesion of texts and the use of discourse level markers. This will be the direction of our future research.
Conclusions
In this study, we set out to investigate how our 2003 March Entrance Exam was performing in the interest of making better- informed decisions in the construction of future exams. It was found that the reliability for all examinees taking the 37 items in Sections 1
through 3 was considerably lower, at .63, than the reliability (.80) for the 99 language majors taking all five sections (75 items). If we hope to increase the reliability on future entrance exams, we will need to find ways to have the majority of examinees take more items. It was also
found that the 2003 March Exam was slightly too easy for the examinees and even easier for the Spanish and English majors. To have a better match between item difficulty and examinee ability, we will need to find ways to add some more challenging items to future tests, particularly to Sections 4 and 5 if the current administration practice continues.
While the majority of items were discriminating well between examinees and were matching examinee ability, a few item types should be either avoided in future exams or further investigated. In particular, the analysis revealed that questions on short conversations that tested wh-adjacency pairs were too easy for the majority of the examinees. Furthermore, some items on the article system and on identifying accents exhibited problems in discriminating between examinees. Similarly, items requiring examinees to identify the incorrect sentence were not performing well. On the other hand, items testing lexical knowledge and grammatical items tended to match the ability of the examinees and also discriminate well.
Based on this analysis, it would appear that there are two challenges facing the writers of future entrance exams at Kanagawa University. On the one hand, in order to get a better reliability for the prospective non-language majors taking the exams, more items should be added to their exam. One way to do this might be to reduce the length of the reading passages to allow more time for examinees to answer more questions. Another challenge is to find ways to increase the difficulty of the exam, particularly for the English and Spanish majors, so that it better matches the ability of the students. As we have mentioned, this could be particularly challenging given the constraints that are placed by Monbukagakusho (MEXT) on vocabulary that can
be used on the exams. Some of the ways that we may want to consider increasing the difficulty of the exam are to include more inferencing questions and questions that require students to work with larger
stretches of discourse (e.g., sequencing sentences in a paragraph,
identification of topic sentences, and questions involving the use of
Applying Rasch Measurement to the Analysis of Entrance Exam Item Types 105
discourse markers). As we continue our analysis of the 2003 Entrance
Exams and investigate how subsequent exams are performing, we hope to add to and refine our recommendations for the writers of future exams. We may also find more evidence suggesting that, in order to increase the reliability of our exams while better matching the ability of prospective students, some structural changes to our exam format may be advisable. In the meantime, we hope to continue sharing our analysis in the interest of improving future exams.
References
Aline, D., & Churchill, E. (2004a, February). Item analysis of a university entrance
examination listening test. Paper presented at the annual meeting of the
Temple University Applied Linguistics Colloquium 2004, Tokyo, Japan.
Aline, D., & Churchill, E. (2004b, July). Item analysis of entrance exam item types:
An application of Rasch measurement. Paper presented at a meeting of the
Kanagawa University Comparative Linguistics Research Group, Kanagawa
University, Yokohama, Japan.
Bond, T. G., & Fox, C. M. (2001). Applying the Rasch model: Fundamental
measurement in the human sciences. London: Lawrence Erlbaum Associates.
Choi, I. (1992). An application of item response theory to language testing New
York: Peter Lang.
Churchill, E., & Aline, D. (2004a, May). Contrasting entrance exam item types.
Paper presented at the annual Pan-SIG meeting of the Japan Association of
Language Teaching, Tokyo, Japan.
Churchill, E., & Aline, D. (2004b, September). Applying Rasch measurement to entrance exams. Paper presented at the annual meeting of the Japan
Language Testing Association, Hikarigaoka, Chiba, Japan.
Churchill, E., & Aline, D. (2004c, November). Using item analysis to improve
entrance exams. Paper presented at the annual meeting of the Japan Association for Language Teaching, Nara, Japan.