in Solar Flares
JSak ·l TT . ru , . a] una , .. 2 HNaka.. J 1ma , 3 T.Koougi3, F.Brunel4, E.Zaidman2 1 Faculty of Engineering, Toyama University, Toyama 930 JAPAN 2 Department of Physics, University of Texas, Austin, Texas U.S.A 3 Nobeyama Solar Radio Observatory, University of Tokyo, JAPAN
4 National Research Council, Ottawa, CANADA Abstract
The nonlinear coalescence instability of current carrying solar loops can explain many of the characteristics of the solar flares such as their impulsive nature, heating and high energy particle acceleration, amplitude oscillations of electromagnetic emission as well as the characteristics of 2- D microwave images obtained during a solar flare. The physical characteristics of the explosive coalescence of currents are presented in detail through computer simulation and theory.
Canonical characteristics of the explosive coalescence are :
( 1) a large amount of impulsive increase of kinetic energies of electrons and ions,
(2) simultaneous heating and acceleration of electrons and ions in high and low energy spectra, (3) ensuing quasi-periodic amplitude oscillations in fields and particle quantities,
( 4) the double peak (or triple peak) structure in these profiles, and (5) characteristic break in energy spectra of electrons and ions.
A single pair of currents as well as multiple currents may participate in the coalescence process, yielding varieties of phenomena. These physical properties seem to underlie in some of impulsive solar flares.
In particular, double sub-peak structures in the quasi-periodic oscillations found in the time profiles of two solar flares on June 7, 1980 and November 26, 1982 are well explained in terms of the coalescence instability of two current loops. This interpretation is supported by the observa
tions of two microwave sources and their interaction for the November 26, 1982 flare.
Some more details as well as a generalization of the present model to solar flares with the coales
cence as an elementary process in the flare phenomenon are presented.
1 . Introduction
The solar flare phenomenon is a manifestation of an explosive release process of energy stored in the lower corona, involving the plasma heating up to 5x1 07 K, the acceleration of charged particles up to the order of the rest mass energy of electrons and ions, as well as the production of electromagnetic radiatim from the radio band to r-ray wavelengths. (for a previous summary of solar flares, see
� 44-
Svestka, 1976; Sturrock, ed., 1980; Priest, 1982) .
After launching of the Solar Maximum Mission (SMM) and Hinotori satellites, it becomes clear from the observations of hard X-rays and r-rays that the electrons with energies up to MeV as well as ions with energies up to Ge V can be simultaneously accelerated within a second during the impulsive phase of a solar flare. In a particular flare ( 03: 12UT of June 7, 1980) the y-rays showed a quasi-perio
dic amplitude oscillation which closely correlated with the quasi-periodicity in both microwave bursts and hard X-ray bursts.
Direct observations in soft X-rays (Howard and Svestka, 1977) showed that in the active regions there exist multiple coronal loops which might carry plasma currents. The interamnecting coronal loop might be a quite important physical process for energy release in the solar corona.
Recently, the observations of the interacting coronal loops which lead to solar flares have increased in various kinds of observations from Ha ( Kurokawa et a!., 1985) , radio (Nakaj ima et a!., 1984) as well as hard Y-ray ( Machado, 1985) .
In order to explain the rapid quasi-periodic particle acceleration of both electrons and ions observed in the ]illle 7, 1980 flare, Tajima et a!., (1982, 1985) showed that the most likely mechanism for the impulsive energy release in solar flares is the current loop coalescence instability (Finn and Kaw, 1977, Pritchett and Wu, 1979) .
It has been shown that by simulation and theory ( Taj ima and Sakai, 1985) that dring the coales
cence of two current loops, the magnetic energy stored by the plasma current can be explosively trans
formed to the plasma heating as well as the production of high energy particles within a transit Alfven time across the current loop (which is about 1 � 10 seconds for appropriate radius of the loop) through the magnetic reconnection process. Furthermore, the energy release can be achieved with quasi-periodic fashion whose periodicity depends on plasma parameters such as plasma beta ratio ((3), the ratio BP/BT between the magnetic field, BP produced by the plasma current and BT the pntential magnetic field, as well as the colliding velocity of two current loops that is determined mostly from the initial total plasma loop current.
The plasma can be heated up to 60 times of the initial temperature and the electrons and ions can be accelerated simultaneously by the transverse electrostatic field which can be produced during the ex
plosive coalescence process.
The present paper is to show results obtained from current loop coalescence plasma dynamics with applications to solar flares. The current loop coalescence itself is similar with Gold and Hoyle model
(1960) and emerging flux model (Hayverts et a!., 1977) in its morphological spirit of the model.
However, the details are quite different from each other. In particular, Taj ima and Sakai (1985) presented the physical basis of such a morphological model , i.e., the physics of magnetic reconnec
tion process, as well as particle acceleration mechanism. We found basically two types of magnetic reconnection, namely, slow and explosive processes: the reconnected magnetic flux <1 ¢ is propor
tional to tm (m >1) in the slow reconnection process and <1¢ is proportional to (to -t)-m (m >O) , in the explosive process. We also found in the ensuing stage the quasi-periodic reconnection with quasi
periodic acceleration during the coalescence of current loops.
-45 -
2. Physical Characteristics of Current Loop Coalescence
In the problem of solar flares, the reconnection of field-lines is believed to take place due to finite resistivity. The paper based on a boundary layer analysis by Furth, Killeen, and Rosenbluth found an instability (the tearing instability) which grows at a growth rate y=Cr;:315 rP.215 oc r;315•
Sweet and Parker, on the other hand, obtained a steady-state solution which has a narrow x-point angle; the time scale rsp of reconnection is characterized by rsJ =� (n;/ne) 112 (V A/L) 112 x01 ocJ;/,
where 2L is the length of the impinged plasma, and n; and ne are the densities inside and outside of the singular layer. Petschek similarly obtained a steady-state solution which has a large x-point angle; the reconnection time scale rp is independent of resistivity, rp1 oc r;0• The time scale of reconnection due to the mechanism of the Sweet-Parker process is characterized by e:-2 (e: 1 =<AI rr), while that of Petschek is by e:0• It may be said that the paper by Furth et al. is appropriate for situa
tions of spontaneously growing tearing modes, while the papers by Sweet et al. are for problems of driven reconnection, although the distinction is yet to be clarified in more precise scientific terms.
Since the paper by Furth et al. was published, a considerable amount of literatures have been written which further investigate the nonlinear processes of the tearing instability. A paper by Rutherford discussed nonlinear secular growth of a single tearing mode, while a paper by Drake and Lee found the collisionless equivalent to the Rutherford regime. The Rutherford time scale
rR1 is characterized by <R1 �C r; L1' (By t/J) 112, where C is a constant less than unity, the shear field, and tjJ the reconnecting flux. Carreras, Rosenbluth, Diamond et al.
cussed.nonlinear stages of many tearing modes with different helicities (i. e., on different nal surf aces) , emphasizing mode couplings. With more than one helicity, the coupling herently three dimensional .
BY is dis
ratio
is in- It has been recognized that the processes of magnetic reconnection are quite different depen
ding upon whether reconnection is driven or spontaneous. For the spontaneous cases, as we briefly reviewed in the above paragraph, the current sheet becomes unstable against the tearing instability evolving from the unstable magnetic configuration. It is customary to argue that the Rutherford regime follows the linear stage and then the highly nonlinear mode coupling stages come into play. There are natural disturbances such as solar flares and geomagnetic storms, in which some of the observed time scales of the entire process of explosive phenomena are as small as the Alfven time. The scenario for reconnection based on spontaneous tearing has to confront the observed rapid reconnection psocesses, although the nonlinear stages of spontaneous reconnection can be quite rapid, as reviewed in the preceding paragraph. In this case, one has to maintain the unstable configuration in equilibrium long enough to reach the disruptive stage.
On the other hand, driven reconnection is much faster and therefore quickly enters the nonlinear stage. This is one of the reasons why the driven reconnection has been studied by many authors.
In order to rapidly convert magnetic energy into kinetic one by a substantial amount, it seems necessary that the bulk of magnetic energy has to participate in the conversion process: the resistive heating at the x-point alone is to meager. This is because the available magnetic energy at the x-point is small by itself. On the other hand, the ideal MHD instabilities such as the kink instability and the coalescence instability are the processes that involve the bulk current
- 46-
redistribution in a matter of the Alfven time scale.
In the present paper we pick the coalescence instability as the primary instability to inves
tigate its nonlinear consequences. we do so because ( 1) although it is an ideal MHD in
stability for drive in the linear sense, it would not nonlinearly evolve if there is no resi stive (non-ideal MHD) effcect; ( 2 ) therefore, it can involve a large amount of conversion of magnetic to kinetic energies in a short time; ( 3 ) it is essentially a tw<Xiimensional m
stability, thus more amenable to thorough analysis of the fundamental processes of the insta
bility. It is interesting to observe that with this two-dimensionality restriction we still find an explosive process as we shall see. The coalescence instability starts from the Faddeev equilibrium, which is characterized by the current localization parameter e c : The equili
brium toroidal current ( in the zdirection) is given as Jz =BaKk( 1 -e�) ( cosh kh + ec
cos kx ) . The parameter e c varies from 0 to 1 with small e: c corresponding to a weak loca
lization and e:c close to unity corresponding to a peaked localization; in the limit of ec ----> 1 the current distribution becomes delta function-like. The rate of reconnection was that of S weet
Parker for small ec, while the reconnection rate experiences two phases for larger ec ( but smaller than 0. 8 ) . This emergence of two phases is similar to the case of the driven recon
nection. The intensity of coalescence and the rate of subsequent reconnection are controlled by j ust one parameter, the current localization ( ec ). In this problem there is no ambiguity as to the nature of the driver in contrast to the reconngection driven by external boundary con
ditions. For the case with e:c =0 . 7 , the second phase showed the reconnected flux increa
sing as ta with 1 < a<2 . ( Brunel-Taj ima scaling) This indicates that the more the current localizes, the faster the reconnection becomes.
As seen in the next section, for the case with e: c = 0 . 85 we found more rapid reconnection called explosive reconnection, in which the reconnected flux increases as ( to - t ) -413• ( Tajima- Sakai scaling)
2.1 Summary of Simulati on Results
We combine both a MHD model and a kinetic model of simulation. The results these two different models are consistent in basic points, but are complementary in detailed aspects. The kinetic simulation model we adopt here is the electromagnetic code with 2� dimensions.
from many particle
The MHD simulation model we use is the MHD particle code with 2� dimensions. The MHD particle code is robust in applications to problems even with strong turbulence, flows, convections, and density depression. This is helpful because the present problem involves fast ( explosive) reconnection, strong density depression and compression, and strong flows.
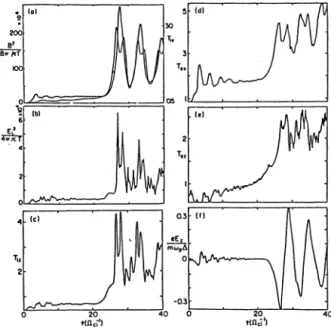
Results from the electromagnetic particle model are now discussed. Figure 1 displays the typical time history of various field and particle quantities observed in our simulation in which after the initial transient ( up to t = 4 Qi 1 in the code unit to be explained in the following section) the phase of coalescence of two magnetic islands commences. It is seen in Figs. 1 ( a) -( c) that around t = 27 the magnetic and electrostatic field energies shoot up explosively as well as the ion temperature in the direction of coalescence ( the x-direction) . The unit of com
putational time is omitted hereafter whenever it is unambiguous. It is also seen in Figs. 1 (a)
-(c) that ( 1) after the explosive increase of the field energies and temperature this overshooting results in synchronous amplitude oscillations of all these quantities with the period being approxi
mately the compresS.onal Alfven period; and ( 2) superimposed on these overall amplitude osci
llations is a distinct double-peak structure in the electrostatic field energy and the ion temperature.
Although we are interested in analyzing the entire epirodo of the run including the initial phase and the post-explosive phase, we focus particularly on the explosive phase of the coalescence. We replot Figs· 1 (a) -(c) into Figs. 1 (d) -(f) to find the way in which these quantities in
crease toward the catastrophic point. We find from Figs. 1 (d) -( f ) that ( 1) the magnetic
xto• (a)
B' 200 e;r;;r
t I
0 .JO' (b)
6
_h._ 417'�e:T '4
I 2
20 li:l
I 10
0 (c)
20
20
• • \ (f)
T�� \
\
t \
n�-vl
20 21 23 25 27
t<nj') t<ni'l
Fig. 1 . Explosive increase of field energies and temperature during the coalescence of two magnetic islands: EM particle simulation results. For the case !Jet = 0 . 2 . Other p arameters are given in Sec. II. Toward the same explosion time t = to= 27( !Ji1 ) , the magnetic energy B' ( a ) , electrostati c energy E"i ( b) , and the ion temperature in the x-direction T;x ( c) diyerge as Uo-t)-813, Uo -t) -•, an d Uo -t) -813, as
shown in ( d ) , ( e ) , and ( f) , respectively. (We took B�- 1 . 6 Xl 0 5, E"io-7.5Xl 0 3, and T;xo - 0 .85 for the pre-explosive phase values; see Figs. l ( a ) - ( c ) ) .
energy explodes a s (to - t) -813; ( 2) the electrostatic energy explodes a s (to - t) - 4 ; and ( 3) the ion temperature in the coalescing direction explodes as (to - t) -813 until saturation due to overshooting sets in, where to is the explosion time measured here to be to -27 ( Jli1 ) in this
run. Figure 2 presents the time history of various field quantities and temperatures in the course of the early formation and the coalescence with the toroidal field being such that eBz/
me c=!Jet =0.2 Wpe. In Fig. 2(a) both the magnetic field energy and the ion temprerature in the direction of coalescence ( x) show that after the early ( t � 3 1J i 1 ) rise which corresponds to the magnetic islands formation by tearing a long relatively dormant period ( t = 3-22) sets in, followed by a stage (t=22-27) rapid and huge increase in these quantities. It is also evident that after the rapid increase (t ;:;:;27) salient amplitude oscillations ensue due to ovgershooting.
-48 -
• lol
• 200
100
��,.,������==� 6
4 (cl
0
Fig. 2. Temporal profiles of particle and field quantities for the coalescence process ob·
tained from the EM particle silll.llation . .Qet=0. 2. ( a ) The thick line reprerents
the magnetic energy, the thin one the ion temperature in the x -direction. ( T;x at t = 0 was 0.5). ( b ) Electrostatic field energy in time. ( c ) Ion temperature in the z·direction. ( d ) Electron tem perature in the x -direction. ( e ) Electron temperature in the z-direction ( f) Inductive electric field ( Ez) in time.
It is to be remarked that all the other quantities shown in Fig. 2 (a) -(e) closely follow the pattern of Fig. 2 (a) with their characteristic events simultaneously occurring. It is also noted that the amplitude oscillations of the temperatures ( T�x and T.z as well as Tex and Tez) and the electrostatic field en ergy have a structure of marked double peaks. The valley of the double -peak structure coincides with the peak of the magnetic field energy amplitude. As mentioned in Sec. 1, it is important to notice that the rapidness of the increase of each quantity differs and and that each quantity explosively increases characterized by a certain definite, but different, index of explosion (i. e., the exponent to the time measured backward from the point of explosion time) until the saturation stage sets in. The stop of rise ( t �3) of each quantity in Fig. 2 ( a) - (e) corresponds to the completion of islands formation. The following quiescent period (3 <t <20) corresponds to the stage where the formed islands slowly attract each other. The rapid explosive rise ( t � 20) marks the commencement of the explosive coalescence. The following stage of am
amplitude oscillations correspond to the "breathing" (or pulsations) of coalesced islands ( compre
ssional Alfven oscillations) . The induced electric field Ez explosively increases when there is rapid flux reconnection during the explosive coalescence and then oscillates as the magnetic flux in the coalesced island is compressed and decompressed.
S ome of the above findings can be given by a qualitative explanation. S ince we shall discuss the explosive phase in greater detalil later, we try to pay attention to the amplitude oscillation phase in particular here. Once two current blobs coalesce, they are bound by common magnetic flux. The larger coalesced island continues to vibrate. Within the coalesced island the colliding
two plasma blobs cause turbulent flows which dissipate their energy quickly into heat, thereby reducing the amplitude oscillations of temperatures and field. As a result as we shall see, the momentum distribution of plasma electrons and ions exhibit an intense bulk heating and accelera
tion of the tail . The heating in the poloidal direction ( x) is due to adiabatic compression and decompression of the coalesced current blobs. The eventual bulk heating is a result of turbulent dissipation of counterstreaming instabilities. The heating in the toroidal direction is due to hea
ting/acceleration by the inductive toroidal electric field which is several times the classical Drei
cer field and the VP xB acceleration. The double peak in the time development of the tempera
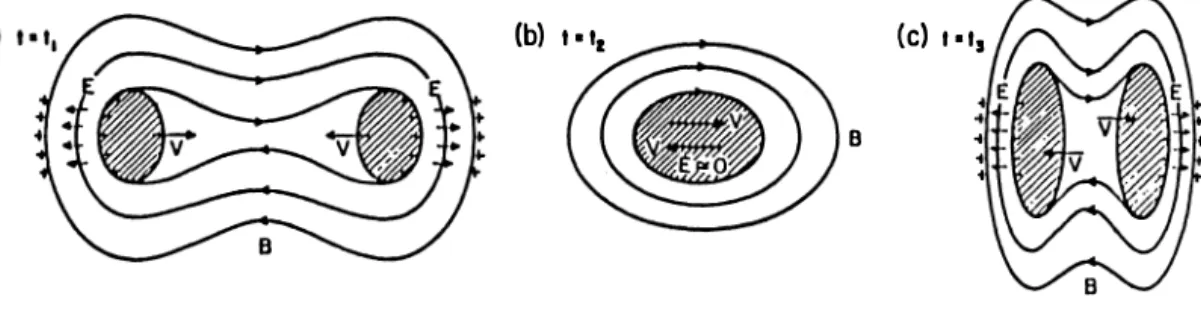
tures occur j ust before ( t = t 1 -27) and after ( t = t 3 -29) the maxima of magnetic field ( t = t 2 -28) . In Fig. 3 schematic sequential pictures of plasma dynamical behavior during coales-
(b) I • 11
B
(c)t•t,
"'"��
.. !•EUE
� �� -� v --�· � - .. 0 �Fig. 3. Schematic sequence of snapshots of the plasma and electric and magnetic fields during the coales::ence process.
cence are shown. At t = t 1 the magnetic (] xB) acceleration of ions becomes maximum so that the magnetic flux the behind the colliding plasma blobs as well as the plasma blobs are them
selves strongly compressed. This plasma compression causes the first temperature peak at t = t1.
After this maximum acceleration phase ions aguire substantial velocities along the direction of collision so that they detach from the magnetic flux against which ions have bceen compressed.
This result in an expansion phase (t =tz) of ions, and hence in an adiabatic cooli ng of the plasma as the magnetic fields obtain maximum values. Tlhe process reverses after the maxim
um of the magnetic fields at t = t3-29 Q i1, which gives rise to the second peak of the tem
perature.
The high energy tail particle acceleration of ions and electrons may be qualitatively discussed here. The tail formation is probably due to a combination of localized electrostatic field accele
ration across the poloidal magnetic field aund magnetic acceleration of the poloidal to toroidal directions.
Electrons are magnetized and are carried away with the accelerating magnetic flux, while bulk ions are accelerated by the JxB force. On the other hand, the high energy ions are pro
duced and dragged by the charge separation created near the compressed flux. The difference of motions between ions and electrons around t = t1 causes a strong localized shock-like electrostatic field, Ex , which propagates with a phase velocity of the structure Vp =vx . This YP xB accele
ration causes the formation of high energy particle in the toroidal direction. By this acceleration process, ions and electrons are accelerated to relativistic energies in opposite directions along the
- 50 -
toroidal magnetic field.
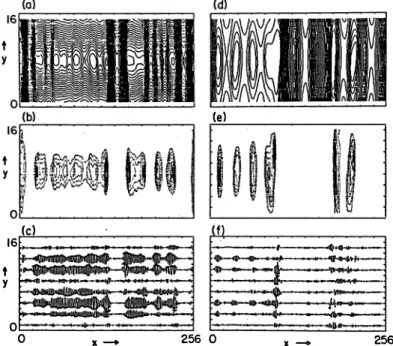
Next we present the simulation results of the case of multiple coalescence process (Fig. 4 ) . A number of islands are induced as the crowbar current is turned on. An interesting phenomenon
(el
0�---�
16 (c) f)
y t
.. ••
�XX
:-:;-�� - .. ., .! ,_.;:;..::..._. . -1\1·
-...
: '!".:11' :.---- •.
0 0
---
·- 256 0 X- 256
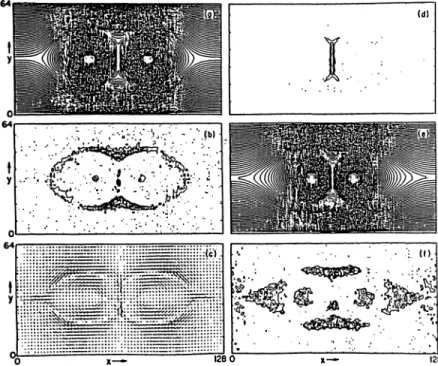
Fig. 4. Multi-loop coalescence; ( a ) ( d ) ;magnetic field line, ( b ) ( e ) ;density ( c ) ( f) ; electrootatic field.
( a ) ( b ) ( c ) correspond to the same time, and ( d ) ( e ) ( f) follow.
here is that these islands begin to coalesce one by one to form slightly larger ones. In ttnn, these larger islands coalesce further into still larger islands. Finally, we are l eft with only two (big) islands that more resembles two sheets of plasma.
into but one. In this multiple coalescence process, spiky time profiles of fields and particle quantities.
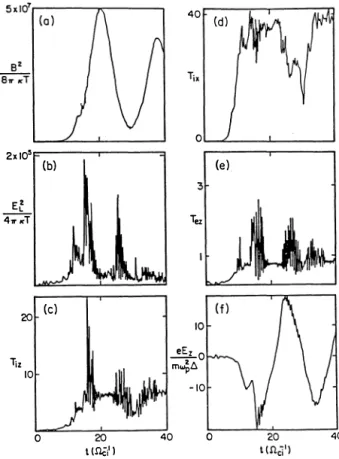
Eventually these two islands also coalesce into the early stage presents many less regular or As time goes on, larger and more organized time profiles of these quantities come to dominate. Eventually, large scale oscillations are o bser
ved in Fig. 5, which are set off after the final two islands coalesce into one. This is, there
fore, a similar procerss to the previous two islands coalescence process. In this particular choice of parameters heating and acceleration of particles are more intense than the previous case. Corres
ponding energy distributions (spectrum) show a longer and more populous tail , indicating a harder spectrum. However, the basic feature of two (for perpendicul ar) and three (for the z-directio
nal distribution) distinct distribution regimes is still unchanged, implying the same heating/ace acceleration mechanism at work. When we inspect the electron z-direction distribution, the hi
ghest energy of the tail oscillates as the overall coalesced island vibrates. On the other hand, the maximum ion energy of the tail in the z-direction, although also oscillating., is less sensitive to the island vibrbation.
Results from the magnetohydrodynamic particle models are presented hence. Fig. 6 shows
2xl0°
(b) E�
4, "T
20 (c)
Tiz 10
0
t (n.ci')
40 (d)
0
3
Tez
�0 m��
-10
40
(e)
0
Fig. 5 . Time hisroty of physical quantities in the case of multi-loop coalescence.
Ekt 1000
··· ..
0
···· .. ....
.......
40 80
t(LlC�'l-
(a) Lllj!
100
.. ··· ...... :
50 10
120 t(LlC�'l-
40
(b)
Fig. 6. Temporal profiles of the fluid energy ( a ) and the reconnected flux ( b ) for Ec =0.85 obtained from the MHO particle simulation. A solid line in ( b ) is a theoretical curve discussed in Sec. III.
kinetic energy and the reconnected flux upon coalescence as a function of time for the case with
ec =0.85. A theoretical curve (to -t)-413 is superimposed on the simulation result. During the phase of the rapid increase of reconnected flux (t=50-90 .d c51) the simul ation result matches reasonably with the theoretical curve. Beyond t = 90 .d c51 the increase begins to be mitigated due to a saturation effect (the flux depletion).
Figre 7 displays the case with e c =0.7. The reconnected flux increases rapidly with .d ¢; cc tm ( m = 1 . 9 ) . It is, however, less rapid than the case with e c = 0 . 85 . The released energy is
-52-
(a)
0o��--�40�-L�B�O���I2�0���16�0--��200
t(6c;')
(b)
10
t·to 100
Fig. 7. Temporal profiles of the fluid energy ( a ) and the reconnected flux ( b ) for e c = 0. 7
obtained from the MHD particle simulation. A &>lid line in ( b ) is a fit to the observation.
also less in present case. The case with ec =0. 3 was treated, where ..c1 ¢ r.x tm with m =l.
Thus, i t is clear that a s ec increases, the process of reconnection becomes faster, changing from the Sweet-Parker rate to the Brunel-Tajima rate to the explosive rate. It is also remarkable that the explosive increase of reconnected flux during the coalescence is observed in the MHD simula
tion as well as in the kinetic simulation discussed earlier.
The structure and its evolution of the plasma and magnetic fields during the coalescence are examined.
These signatures are consistent with our hypothesis (a) that the reconnection takes place by the mechanism of Sweet and Parker for coalescence with ec =0. 3 . The signatures found in
ec =0. 3, on the other hand, imply that the reconnection process is not that of Sweet and Par
Parker. It shows instead that ( 1 ) the reconnection angle at the x-point has enlarged ; ( 2) a high density spot near the x-point is formed ; (3 ) the reconnected flux increases faster than the Sweet-parker process ( ..c1 ¢ r.x t m with m -2 ) . These are consistent with our further hy
potheses (b) that the reconnection is through the process of Brunei, Tajima and Dawson for coalescence with e c =0. 7 . Later ( t = 160) , the system approaches saturation when most of the the flux available has reconnected as seen in ec =0. 7 (at t = 140 for this frame) and the high density region shifted from the x-point to the coalesced island hedge. The flow is randomized.
To supplement our kinetic simulation in order to make comparison with the MHD particle si
mulation, we present a run starting from the Faddeev equilibrium. In this case the equilibrium
is the same as the MHD particle run, although the parameters such as the collisionless skin depth are different because of the difference in model.
Figure 8 presents the pattern of the plasma and fields of the case ec =0 .85, where we see faster and explosive reconnection (Fig. 6 ) . We are advancing our third hypothesis (c) that the coalescence with e c = 0. 85 is explosive whose reconnection process is to be characterized 'by the present paper. In frames of Figs. 8 ( a) - (d) ( t =50) one sees the coalescence behavior be-·
fore it becomes explosive. Although, in Figs. 8 ( a) and (b) , in particul ar, one can detect some deviation from the Sweet-Parker type for ec =0 . 3, it is qualitatively similar to the ec =0.3 case
(d)
. ::.
,·. �k·:.
Y ... · • •=V,-·. .·!&. • ··t> . . . Jr .. :
0
·�. -�· ·'· -'.:,. ·1w :·
.: · .. .·:�,.,··�··· : . . . :·. '-: .
;:.; lo-."•: • ' , ·
x- 128 0 x- 126
Fig. 8. Spatial structure of plasma and fields "before" and "during" coalescence with
<c =0.85. ( a ) Magnetic field lines. ( b ) Plasma density contours. ( c ) Plasma flow velocities. ( d ) Current density ( ]z) contours. ( a ) - ( d ) at t =50.:1 cs-1• ( e ) Magnetic field lines. ( f) Plasma density contours. ( e ) and ( f) at t =87. 5 .:1 c5·1•
and the € c = 0. 7 case at this stage. In Figs. 8 (e) and (f) ( t = 75) , we now see significant deviations in pattern from the cases with less ec =0.7. A much wider reconnectigon angle than the previous ones is observed in Fig. 8 (e) . From these observations it can be argued that the WI·
dening of the reconnection angle has to be accmopanied by fast or explosive coalescence.
2, 2, Theoretical Model of Explosive Coalescence
As shown in the previous section, the current sheet of nearly one-dimensional structure is formed in the explosive stage of the coalescence instability. As the coalescence proceeds further, the magnetic field structure approaches an x-type ( Petsheck type) configuration. We assume that ajax>> ajay, ajaz, in which X iS the direction of coalescence, while y is the direction of poloidal magnetic field line and z is the direction of plasma current. We treat the external plasma dynamics of the explosive stage as a one-dimensional problem.
As we shall see in our separate paper ( Tajima and Sakai , 1 985) , in one-dimensional limi
ting case of two-dimensions, we get essentially the same results as we obtain in this section.
w e start from the two-fluid model equations of plasma and the Maxwell equations, neglec- ting the displacement current. We assume the adiabatic law of states for both electrons and Ions. The basic equations read as follows:
at (1)
- 54 -
m·n·--dvj
J J dt
Vj
=njej ( E+- XB) -vpj,
c
41!"
v XB =- :2:: nj CjVj,
c j
V· E =411":2:: njej, j 1 aB v XE =--
c at '
+vj · v Pj + ypjdivvj = 0 ,
where j denotes the species of particles and r is the ratio of heat the degree of freedom of the system f as r = 1 + 2 /f.
capacity which is
(2)
(3)
( 4) (5)
(6) related to During coalescence, there is no specific scale length. The scale length characterizing the current sheet varies continuously in time without deformation of global structure of current sheet.
If one looks at the evolution of the system locally in time ( in the neighborhood of t = t s ) , the system undergoes the rapid field and temperature swelling, compression of plasma and the size of the current sheet, change of the reconnection angle etc. in a certain specific fashion which was detailed in Sec. 2 . If one looks at the same system locally in time a little later (in the neighbor
hood of t = t s + t � ) , the system undergoes these changes with differrent magnitudes, but still in the same specific fashion. That is, the relations (laws) that govern the explosive coalescen
ce themselves are invariant under the change of time scale. This was the manifestation of the presence of self-similarity in the system during explosive coalescence.
Such a physical situation may best be described by self-similar soulutions in which scale vary continuously. We introduce scale factors a ( t) and b( t) as follows,
factors Vex =- x , a
a (7)
(8) where a dot represents the time derivative. An ansatz is imposed here that the velocities are linear in x. The linear dependence on x of the velocity implies that ions and electrons stream in the opposite direction around the center of current sheet, x = 0. The scale factors a and b will be determined from the above basic equations. From the continuity equations of electrons and ions, Eq. ( 1) , we obtain
ne =no /a, (9)
n; =no/b , (IO)
where no is a constant. Equations ( 9) and ( 10) show that the densities of ions rons are nearly homogeneous in space and vary only in time during coalescence. The solutions obtained here are local solutions in space whose physical process dominates
and elect
self -similar near the current sheet. We therefore neglect the higher order terms in space proportional to x3 and higher hereafter. The current Jz in the sheet is nearly constant. This means that as nj is nearly
constant, Vzj is also approximately constant in space. Neglecting the term with x3 in Eq. ( 3 ), we obtain
Bo(t) _41l"eno ( vW v�0) )
-A- - --c-
--b- - -a- ' (11)
where we assumed the magnetic-field Bu varies as Bu = Bo ( t )f, where A is the magne
tic field scale length. This ansatz is consistent with the assumption that the sheet current is constant in space.
From the y-component of Eq. ( 5 ) and the z-component of the equation of motion for electrons Eq. (2) we obtain
where
Bo =2c -Ez1 A- , x2 a Bo ( t ) Ez1 ---;--2 + -1\ a ---A c
e at
Ez =Ezo(t) Equations (12) and (13) yield
Bo (t) = -2-Boo a ,
(12) x2 =0 ,
(13) (14)
(15) where Boo is a constant. From the z-component of the equation of motion for ions, we get
From Eqs.
From Eqs.
= -- Ezo . e
at mi
( 14) and ( 16) we have
(15) ,
Ez =-
v (0) tZ me (OJ --- Vez
mi
( 17) and ( 1 1) , we get for v�0) aund Ez v(oJ ez
BooaX2 ca3 A
cBoo b
41l"enoAa2 ( � +�� ) ,
+me cBoo 41l"noe2A -dt d ( a 2 ( '_ b Q + me ) m I )
Assuming that the electrostatic field Ex varies like Ex = E0 ( t ) xj A , Poisson's equation ( 4)
Eo =41l"enoA 0 - � ) .
Furthermore, the equations of state for electrons and ions give rise to Pe
b r 2 b r+2 A 2
(16)
(17)
(18)
(19) we obtain from
(20)
(21)
(22) We now go back to the x-component of the equations of motions for electrons and ions in order to obtain the basic equations for a ( t ) and b ( t ). If we neglect the small terms of the order
- 56 -
of the mass ratio me/m;, we obtain
(23)
(24) Furthermore, assuming that the plasma is quasi-neutral n; =ne, i . e., a =b, by adding Eqs.
(23) and ( 24)
where
2 B� o d 2 ( Poe + Po;)
VA = an Cs =
41Cno ( m;+me) ( me+m;) n o
(25)
In Eg. (25) the first term of the R HS corresponds to the J x B term. T his is the term that drives magnetic collapse. The secound term corresponds to the pressure gradient term.
This term may eventually be able to balance the magnetic compression (collapse) when r=3.
The condition r =3 means that the plasma compression takes place in a nearly one-dimensional fashion so that the degree of freedom of the system becomes unity. Wben r =3 , we obtain
.. v� d
a = ---+--
A2 a2 A2 aa
When r = 2 (f =2) , on the other hand, we obtain
(26) ( v� -d)
i =- A2 a2 �
Once the behavior of the scale factor a( t) is determined from the above equations, we obtain various kirrls of physical quantities as fllows, in the quasi-neutral plasmas, and ne
glecting the mass ratio (me /m; --+0) ,
Bo o m eCt:i 41Cno e2 Aa2 cBo o
Vez =-----
41Ce no Aa V;x =vex =-a X
a n; = ne =no
a
(28) (29) (30) (31) (32)
(33) where the electrostatic field Ex in the quasi-neutral plasmas is determined from the equation of motion for ions, not from Poisson's equations.
Frgom Egs. (28) and (29) we find the important result that in the explosive phase (a--+0) the electrostatic field Ex ex: (a-3+a-4) grows more rapidly than the magnetic field (By ex: a-2) does. This effect plays a pivotal role for high energy particle production.
Now we investigate the global time bcehavior of coal escence by making use of the first integral of Eq. (26) . Equation (26) may be rewritten as
a V( a)
� =- a a 00
where the effective (Sagdeev) potential V ( a) is given by
vi d
V ( a) =-A2 a + 2A2 a2 ' (35)
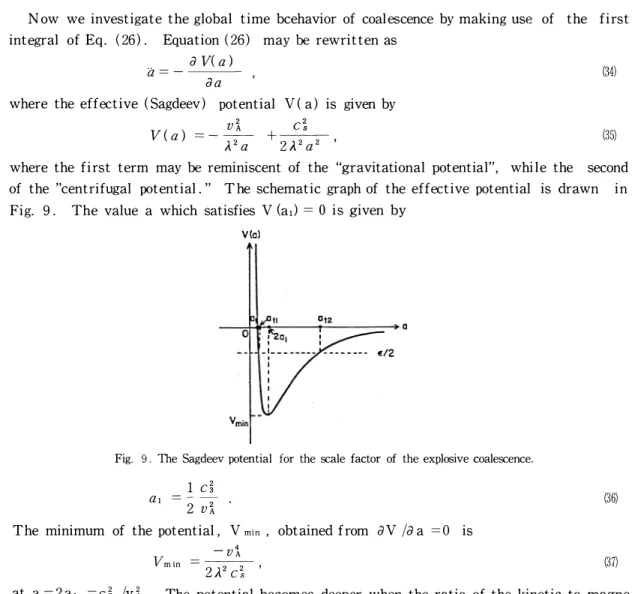
where the first term may be reminiscent of the "gravitational potential", while the second of the "centrifugal potential . " T he schematic graph of the effective potential is drawn in Fig. 9. The value a which satisfies V (at) = 0 is given by
VIol
Fig. 9 . The Sagdeev potential for the scale factor of the explosive coalescence.
a 1 - 2 ---ld vi
The minimum of the potential , V min , obtained from a V /a a =0 is - vi
Vmin = 2A2 c� ,
(36)
(37) at a =2at =d /vi. The potential becomes deeper when the ratio of the kinetic to magne
tic energy densities f3 = d /vi approaches zero. T his means that the driving force JX B is dominant compared wi th the pressure term. The first intgegral of Eq. (3 4) is given by
2 2 2
tf = ___!!_!___ - � + e
A 2 a A 2 a2 ' (38)
where e is the initial (Sagdeev) "energy" (dimension: 1/time 2) in space of stretching factor a.
2 vi d
+ _2_ 2_. A ao (39)
As seen from Fig. 9 , the explosive magnetic compression corresponds that the scal e factor a (t) rapidly changes in time by orders of magnitude and vanishes. We may cal l this an ex
explosive magnetic collapse. Such an explosive collapse can be realized ( 1 ) when the effec
tive potential has a sharp and deep potential well and this means that f3 = d /vi is very smal l; ( 2 ) when the initial total energy e /2 is nearl y zero. On the other hand, when e /2 is close to - vmln, we have oscillations near the potential minimum and no explosive
- 58 -
collapse.
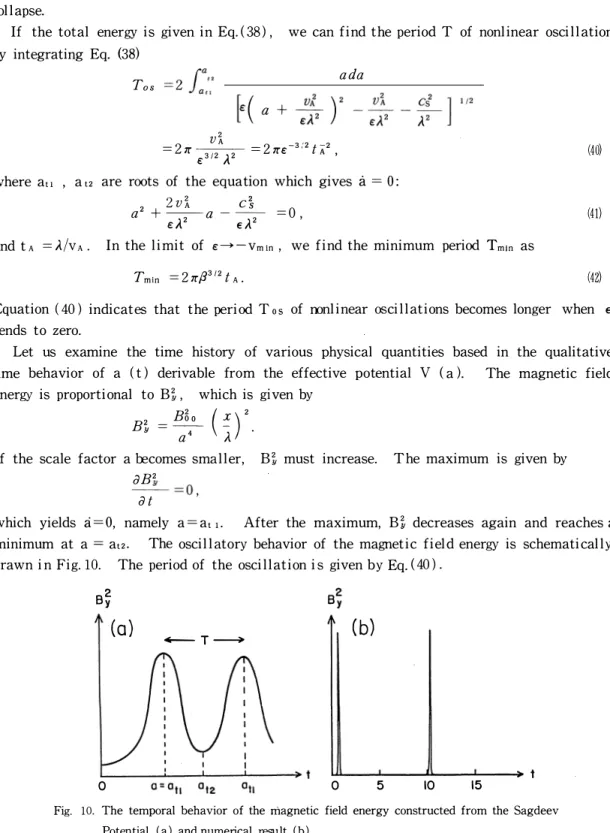
If the total energy is given in Eq. (38) , we can find the period T of nonlinear oscillations by integrating Eq. (38)
Tos
=27r 3/2 2 =27re-3-'2t"A2 , vi e A
ada
where au , a 12 are roots of the equation which gives a = 0:
2 2vi d
a +--a--- =0 ,
t::..\2 EA2
and tA =A./VA. In the limit of �;;�-Vmin, we find the minimum period Tmtn as Tmtn =27r/3312fA.
(40)
(41)
(42) Equation ( 40) indicates that the period T o s of mnlinear oscillations becomes longer when E tends to zero.
Let us examine the time history of various physical quantities based in the qualitative time behavior of a ( t) derivable from the effective potential V (a ). The magnetic field
energy is proportional to Bt , which is gi ven by B 2 = B6o y a• ( !) ,.\ 2
If the scale factor a l:ecomes smaller, Bt must increase. T he maximum is given by aB 2
__ Y_ =0 at
which yields a=O, namely a=at 1. After the maximum, B� decreases again and reaches a minimum at a = a12 . The oscillatory behavior of the magnetic field energy is schematicall y drawn i n Fig. lO. The period of the oscillation i s given b y Eq. ( 40).
B�
(a) -T� (b)
0 0 5 10 15
Fig. 10. The temporal behavior of the magnetic field energy constructed from the Sagdeev Potential ( a ) and numerical result ( b ) .
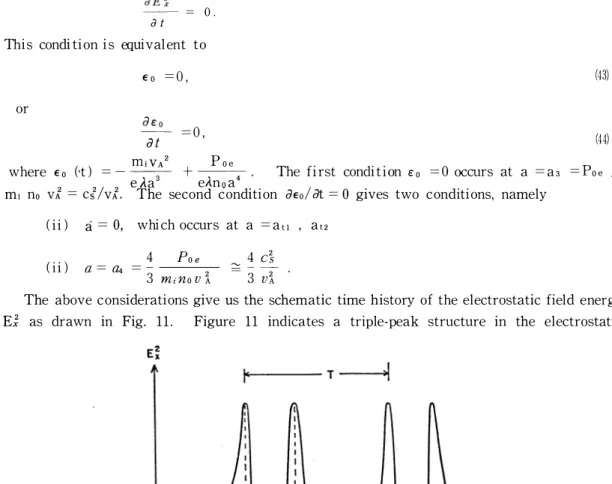
The electrostatic field Ex is given by Eq. (29). The time history of the electrostatic field energy, which is proportional to E�, is analyzed by investigating
= 0.
at This condi tion is aiUivalent to
€o =0, (43)
or
at =0, (44)
( ) miVA2 Poe Th f" di . O p /
where eo 't = - --s- + 4 e trst con t10n eo = occurs at a =as = oe e..\a e.Anoa
m1 no vi = ci /vi. T he second condition aeo/ at = 0 gives two conditions, namely (ii) a= 0, which occurs at a =a u ' at2
(i i) 4 Poe 4d
::::
3 m;no v i 3 vi a= a.
T he above c onsiderations give us the schematic time history of the electrostatic field energy E; as drawn in Fig. 11. Figure 11 indicates a triple-peak structure in the electrostatic
Fig. 11. The temporal behavior of the electrostatic field energy constructed from the Sagdeev potential.
field energy. When the plasma f3 is small, as, au are close. In this case, the tri ple-peak structure in the electrostatic field energy would become double-peak structure. The maximum value of the electrostatic field, Emax, achieved at a = a. is given by
E max _ _ -4 4 1( -3)s _CA m; vi d _x Y �0.1 -C A m; vi -f3s Y x (45) The induced elecstric field Ez is given by Eq. (30), which shows that Ez becomes zero, when a = 0. Ez changes its sign around a = 0 because a = 0 is the point where the magnetic field achieves maximum or minimum.
Next, the time behavior of ion temperrature T;x is examined. In the earl y stage of coa
l escence, the plasma should be adiabatically compressed. However, as the magneti c f i eld energy increases near the peak and approaches the peak, the ion flow energy becomes domi nant
- 60 -
over the thermal energy. From the consideration that vi. gives maximum or minimum, namely --avx =0, we find two conditions for the extrema; (i ) Vx =0, which gives a =
a t avx
0, (ii) =0, which gives at
When the explosive coalescence takes place ( c: = 0) , we estimate the conditigon ( 46) as a =as �� d .
3vi
(46)
After a = as, the kinetic energy must decrease, which means that the plasma is in the state of the colliding phase. The above considerations give us the schematic time history of the ion temperature, which is shown in Fig. 12. Figure 12 shows a double-peak structure in the ion
Tix T
�--�----��----�----�---+ t 0
Fig. 12. The temporal behavior of the ion-temperature in the x-direction ( in the direction of coalescence) constructed from the Sagdeev potential.
temperature. In the limit of quasi-neutrality, we can estimate the dominant term governing the explosive phase where the adiabatic compression is predominant. The temperature T is given by T =P / n, while the dominant term in prerssure changes in time as P-a-s when y =3 , P -a-• when y =2 , while n-a -'. Therefore we find
T = P/n�-. (y =3) 1 (47)
a
� 1/a3 (y =2) . (48)
We investigate in more detail the explosive phase of the coalescence in the case where we can neglect the effect of plasma pressure: it only acts as a saturation mechanism. However, if we take y = 2 , the pressure does not take the role of a saturation mechanism as seen in Eg.
(27). In the explosive phase, therefore, we can neglect the second term in the right-hand side of Eq. (26) ;
a =-��vi }.2a2
Furthermore, we need a second condition for explosive collapse, namely
(49) the initial total