An Empirical Analysis of Odd Pricing Using PSM Data
Yoshiyuki Okuse
Professor of Marketing,
An Empirical Analysis of Odd Pricing Using PSM Data
1Yoshiyuki Okuse2 Professor of Marketing,
School of Commerce, Senshu University
Abstract
It is evident in our daily lives that most consumer goods are not sold at the just price, but rather at the just-below price. To examine the effect of odd pricing, including just-below pricing, numerous empirical studies have been conducted. In spite of these efforts, a consistent conclusion has not been obtained so far.
The goals of this research are: (1) to examine the existence of the effect of odd pricing on consumers’ price acceptance using PSM analysis, and (2) to examine the mechanisms of the effect: the level and image effects. To do so, questionnaire data for PSM are used.
INTRODUCTION
It is evident in our daily lives that most consumer goods are sold not at the just price but at the just-below price. Store managers believe that odd pricing makes the price level appear lower than it actually is, and influences consumer behaviors such as purchase, preference, and price recall. This is why they apply odd pricing to their offering. To examine the effect of odd pricing, many empirical studies have been conducted (Ginzberg 1936; Schindler and Wiman 1989; Schindler and Kirby 1997; Gendall et al. 1997, 1998; Simmons and Schindler 2003; Guéguen and Legoherel 2004; Suri et al. 2004; Coulter 2007; Coulter and Coulter 2007; Harris and Bray 2007; Nguyen et al. 2007; Stiving and Winer 2007; Schindler 2006, 2009; Franz et al. 2010; Choi and Coulter 2012; Kinard et al. 2013; Choi at al. 2014; Wadhwa and Zhang 2015). However, in spite of these efforts, no consistent conclusion has been obtained so far. Therefore, although price ending is one of the most important issues for managers, the effect of odd pricing on consumer behavior is still inconclusive.
The goals of this research are: (1) to examine the existence of the effect of odd pricing on consumers’ price acceptance, and (2) to examine the mechanisms of the effect: the level and image effects. To do so, a questionnaire survey including Price Sensitivity Meter (PSM) items is conducted, and PSM and binomial logistic regression analyses are applied to the obtained data.
THEORETICAL BACKGROUND
Examination of the effect of odd pricing on consumer behavior
Many empirical studies have been conducted (Ginzberg 1936; Schindler and Wiman 1989; Schindler and Kirby 1997; Gendall et al. 1997, 1998; Simmons and Schindler 2003; Guéguen and Legoherel 2004; Suri et al. 2004; Coulter 2007; Coulter and Coulter 2007; Harris and Bray 2007; Nguyen et al. 2007; Stiving and Winer 2007; Schindler 2006, 2009; Franz et al. 2010; Kinard et al. 2013) to examine the effect of odd pricing.
Gedenk and Sattler (1999) reviewed the studies, as shown in Table 1. It is clear that earlier research does not reach a consistent conclusion about the effect of odd pricing.
Table 1
Review about existent research on odd pricing
Dependent variable Negative Effect of
9-Ending Prices
No Effect of 9-Ending Prices
Positive Effect of 9-Ending Prices
Purchases Ginzberg(1936) Ginzberg (1936) Ginzberg (1936)
Dean (1951) Dalrymple and Haines (1970) Dean (1951) Stiving and Winer (1997) Georgoff( (1972) Wasson (1965)
Kucher (1985) Georgoff( (1972) Blattberg and Wisniewski (1987) Muller and Bruns (1984) Diller and Brielmaier (1996) Blattberg and Wisniewski (1987) Schindler and Kibarian (1996) Schindler and Kibarian (1996) Stiving and Winer (1997) Stiving and Winer (1997) Kalyanam and Shively (1998) Kalyanam and Shively (1998)
Stated Preference Gabor and Granger (1964) Gabor and Granger (1964)
Muller, Brucken and Heuer-Potthast (1982)
Schindler and Warren (1988) Dodd and Monroe (1985) Wedel and Leeflang (1998) Wedel and Leeflang (1998) Choi et al.(2014)
Wadhwa and Zhang (2015)
Price Perceptions Diller and Brielmaier (1996) Kaas and Hay (1984)
Price Recall Lambert(1975) Lambert(1975) Lambert(1975)
Muller and Hoenig (1983) Muller, Brucken and Heuer-Potthast (1982)
Diller and Brielmaier (1996) Kaas and Hay (1984) Schindler (1984)
¥9 80
Image effect
• Price Image effect: Consumers view 9‐ending prices as a signal of a price discount. • Quality Image effect: Consumers view 9‐ending prices as a signal of inferior quality.Level effect
• Consumers round price down. • Consumers compare prices from left to right. • Consumers have limited memory capacity.Mechanisms of the effect of odd pricing
Some of the former studies related to odd pricing attempted to illustrate not only its effectiveness, but also the mechanisms of its effect. Most of those studies explain that the effect of odd pricing is caused by the level effect and by the image effect.
The level effect is the effect of the leftmost digit of the price on consumers’ price perception. It is said to be caused by the consumer’s tendency to read multiple-digit numbers from left to right (Poltrock and Schwartz 1984) or by his/her limited memory capacity (Schindler and Kibarian 1996; Guéguen and Legoherel 2004; Thomas and Morwitz 2005). The consumer compares prices from left to right, and the leftmost digit is easy to keep in his/her memory because it is more important than the rightmost one.
The image effect is the effect of price on the consumer’s image for product evaluation. It is said that there are two types of image effect: price image effect and quality image effect. The price
image effect is due to consumers viewing the rightmost digit of the price as a signal of a price
discount. For example, the ending of “8” in “¥98” makes consumers perceive the offering as being “on sale.” Sometimes, the consumer’s culture is related to the effectiveness of the price image effect. For example, Schindler (2009) pointed out that the number “8” is more effective than “9” in Japan, because it is associated with happiness.
On the other hand, the quality image effect is due to consumers viewing the rightmost digit of the price as a signal of inferior quality. Therefore, odd pricing for luxury brands may have a negative effect on the quality image, though for commodity goods, it may have a positive effect.
Figure 1
Some of the empirical studies on the mechanisms of odd pricing attempted to clarify the existence of both level and image effects. For example, Stiving and Winer (1997), who attempted to examine the two effects, applied a binomial logit model to the scanner panel data for supermarket items (tuna and ketchup), and confirmed their existence.
STUDY 1
Method
The purpose of study 1 is to confirm the effect of the price ending from the PSM analysis. Some field studies (Kalyanam and Shively 1998; Anderson and Simester 2003) have found evidence for demand-curve peaks or “spikes” at places ending in “9.” Dazai (2008) claims that PSM analysis is suitable in examining the existence of an odd pricing effect. Therefore, a PSM analysis was conducted first in this research.
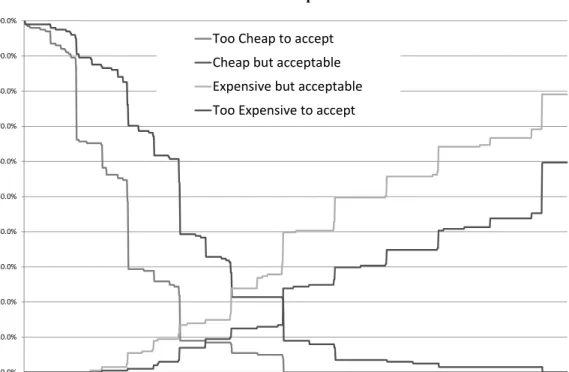
PSM
PSM (Price Sensitivity Meter or Price Sensitivity Measurement) is one of the most popular price research methods. Developed by van Westendorp for estimating consumers’ acceptable price range, it requires asking respondents only four questions (as shown in APPENDIX).
By cumulating responses by price for each of the questions, PSM estimates consumers’ acceptable price range. Because it is quite easy to collect and analyze such data, PSM is widely used for marketing management, particularly for pricing decisions.
Results
Discussion
From the results of study 1, the effect of price ending was confirmed through PSM analysis in all categories. However, the results are tentative, as they are not tested statistically.
STUDY 2
Methods
The purpose of study 2 is to examine the existence of two price-ending mechanisms mentioned in other studies. To examine them in this research, binomial logistic regression analyses were conducted, in which the consumer’s price acceptance was used as the dependent variable.
Model estimation
Stiving and Winer (1997), who attempted to examine the two mechanisms, applied the binomial logit model to the scanner panel data and confirmed the existence of both level and image effects. The utility function in their model is the following:
U
In this model, δ is defined as a dummy variable that takes on the value of 1 only when the dime variables of the two brands under consideration are equal; otherwise, it is 0. Variables and
take on the value of 1 if the rightmost digit of the price is 0 or 9, respectively.
Based on Stiving and Winer’s (1997) model, a binomial logistic regression was conducted in this research as well, in order to confirm the level and image effects. The model was constructed as follows:
1|
Table 2
Logistic Regression: Yogurt
Table 3
Logistic Regression: Shampoo Category: Yogurt
Coefficients:
Estimate Std. Error z value Pr(>|z|)
(Intercept) 1.1116 0.1828 6.0800 1.2E-09 *** PRICE -0.0021 0.0007 -2.9380 3.3E-03 ** RIGHTDIGIT 0.1227 0.0269 4.5570 5.2E-06 *** RIGHTNINE n.s. RIGHTZERO n.s. LEFTDIGIT -0.3350 0.0392 -8.5420 2.0E-16 *** LEFTONE n.s. LEFTNINE 1.8163 0.3758 4.8330 1.3E-06 *** ---Signif. codes: 0 ‘***’ 0.001 ‘**’ 0.01 ‘*’ 0.05 ‘.’ 0.1 ‘ ’ 1 Null deviance: 1103.49 on 795 degrees of freedom
Residual deviance: 989.54 on 791 degrees of freedom AIC: 999.54
Number of Fisher Scoring iterations: 4
Category: Shampoo Coefficients:
Estimate Std. Error z value Pr(>|z|)
(Intercept) 1.0640 0.2125 5.0040 5.6E-07 *** PRICE -0.0002 0.0001 -2.7180 6.6E-03 ** RIGHTDIGIT n.s. RIGHTNINE -1.6060 0.5888 -2.7280 6.4E-03 ** RIGHTZERO -0.7771 0.2187 -3.5520 3.8E-04 *** LEFTDIGIT n.s. LEFTONE -0.8298 0.1654 -5.0180 5.2E-07 *** LEFTNINE n.s. ---Signif. codes: 0 ‘***’ 0.001 ‘**’ 0.01 ‘*’ 0.05 ‘.’ 0.1 ‘ Null deviance: 1114.6 on 803 degrees of freedom Residual deviance: 1064.3 on 799 degrees of freedom AIC: 1074.3
Table 4
Logistic Regression: snack
Table 5
Logistic Regression: jeans
Category: Snack
Coefficients:
Estimate Std. Error z value Pr(>|z|)
(Intercept) -1.4497 0.2400 -6.0410 1.5E-09 *** PRICE n.s. RIGHTDIGIT 0.1077 0.0328 3.2860 1.0E-03 ** RIGHTNINE n.s. RIGHTZERO n.s. LEFTDIGIT 0.1981 0.0478 4.1410 3.5E-05 *** LEFTONE 1.9645 0.2413 8.1400 3.9E-16 *** LEFTNINE 1.0923 0.5925 1.8440 6.5E-02 . ---Signif. codes: 0 ‘***’ 0.001 ‘**’ 0.01 ‘*’ 0.05 ‘.’ 0.1 Null deviance: 1092.40 on 787 degrees of freedom Residual deviance: 981.52 on 783 degrees of freedom AIC: 991.52
Category: Jeans Coefficients:
Estimate Std. Error z value Pr(>|z|)
(Intercept) 0.4030 0.1157 3.4820 0.00050 *** PRICE -0.00003 0.0000 -3.4210 0.00063 *** RIGHTDIGIT n.s. RIGHTNINE n.s. RIGHTZERO n.s. LEFTDIGIT n.s. LEFTONE -0.4077 0.1544 -2.6400 0.00830 ** LEFTNINE -0.5761 0.2933 -1.9650 0.04947 * ---Signif. codes: 0 ‘***’ 0.001 ‘**’ 0.01 ‘*’ 0.05 ‘.’ 0.1 ‘ ’ 1 Null deviance: 1086.9 on 783 degrees of freedom
Residual deviance: 1066.4 on 780 degrees of freedom AIC: 1074.4
Table 6:
Results of logistic regression analyses
Results
All the results of the binomial regression analyses are shown in Tables 2 through 5. Table 6 shows the summary of all analyses. In this last table, the dark gray cells indicate that the hypothesis was supported statistically, while the light gray cells indicate that the opposite hypothesis was obtained in the logistic regression analysis.
In all categories, the level effect, related to the variables LEFTDIGIT, LEFTONE, and
LEFTNINE, was almost confirmed, though some unexpected signs were obtained. On the other
hand, the image effect, related to the variables RIGHTDIGIT, RIGHTNINE, and RIGHTZERO, was confirmed in only one category, namely shampoo.
Discussion
In study 2, which examined the mechanisms of the odd pricing effect, the level effect was confirmed in all categories, while the image effect was confirmed in only one category and some of the signs were opposite to the hypotheses.
GENERAL DISCUSSION
Conclusions
In study 1, which examined the existence of the effect of odd pricing, the effect was confirmed, though it was not tested statistically.
In study 2, which examined the existence of the level and image effects, the level effect was confirmed in all categories, and the image effect was confirmed in only one category. Therefore, the result is weak to support the existence of the image effect.
Limitations
The findings of this research are tentative, because there are at least two limitations. First, no statistical test was conducted in study 1. Second, it might not be appropriate to use PSM data in
(Intercept) PRICE RIGHTDIGIT RIGHTNINE RIGHTZERO DIGITLEFT LEFTONE NINELEFT
Categories: Hypothesis (sign) - + - - +
yogurt *** ** *** *** *** snack *** ** *** *** . shampoo *** ** ** *** *** jeans *** *** ** *
study 2. In essence, PSM data is collected not to examine the effectiveness of odd pricing, but rather to estimate consumers’ acceptable price range. Therefore, research with appropriate data for the purpose should be performed in the future.
DATA COLLECTION INFORMATION
To collect data for this research, a questionnaire survey was conducted through the monitor panel website of Macro Mill Inc. in March 2013. The four PSM items were included in the questionnaire survey. The product categories were shampoo, yogurt, jeans, and snack. They were chosen because they were also used in other studies. The sample size was 155 for each category. Data over 3 S.D. were considered outliers and deleted.
APPENDIX: PSM ITEMS
The PSM (Price Sensitivity Meter) suggested by van Westendorp (1976) consists of four items, as follows:
Q1. At what price would you consider this [product and/or brand] to be so inexpensive that you would have doubts about its quality? (too low to accept)
Q2. At what price would you still feel this product is inexpensive yet have no doubts as to its quality? (very low but barely accept)
Q3. At what price would you begin to feel this product is expensive but still worth buying because of its quality? (very expensive but barely accept)
REFERENCES
Anderson, Eric. T. and Duncan I. Simester(2003), “Effects of $9 Price Endings on Retail Sales: Evidence from Field Experiments,” Quantitative Marketing and Economics, 1(1), 93-110 Balan, Carmen(2013), “Research on Odd Prices: Dead End or Field of Potential Innovation,” in
Innovation in Pricing: Contemporary Theories and Best Practices, edited by Andreas
Hinterhuber and Stephan Liozu, Routledge Taylor & Francis Group
Bizer G. Y. and Robert M. Schindler (2005), “Direct Evidence of Ending-Digit Drop-Off in Price Information Processing,” Psychology & Marketing, 22(10), 771-783
Boyes, William J., Allen K. Lynch and Wm. Stewart Mounts Jr.(2007), “Why Odd Pricing?,”
Journal of Applied Social Psychology, 37(5), 1130-1140
Coulter, Keith S.(2001), “Odd-Ending Price Underestimation: An Experimental Examination of Left-to-Right Processing Effects,” Journal of Product and Brand Management, 10(5), 276-292 Coulter, Keith S.(2007), “The Effects of Digit-Direction on Eye Movement Bias and
Price-Rounding Behavior,” Journal of Product and Brand Management, 16(7), 501-508 Coulter, Keith S. and Robin A. Coulter (2007), “Distortion of Price Discount Perceptions: The
Right Digit Effect,” Journal of Consumer Research, 34(2), 162-173
Choi, Pilsik and Keith S. Coulter (2012), “It’s Not All Relative: The Effects of Mental and Physical Positioning of Comparative Prices on Absolute versus Relative Discount Assessment,”
Journal of Retailing, 88(4), 512-527
Choi, Jungsil, Yexin Jessica Li, Priyamvadha Rangan, Promothesh Chatterjee, and Surendra N. Singh (2014), “The Odd-Ending Price Justification Effect: The Influence of Price-endings on Hedonic and Utilitarian Consumption,” Journal of the Academy of Marketing Science, 42, 545-557
Dalrymple, D. and G. J. Haines (1970), “A Study of the Predictive Ability of Market Period Demand-Supply Relations for a Firm Selling Fashion Products,” Applied Economics, 1, 277-285.
Dazai, Ushio(2008), “Is Consumer Response to Price Balanced?: Monograph of Distribution of Price Acceptance” Advances in Consumer Studies, 14(1/2), 43-66, (in Japanese)
Estelami, H.(1999), “The Computational Effect of Price Endings in Multi-Dimensional Price Advertising,” Journal of Product and Brand Management, 8(3), 244-256
Fortin, D., S. Cleland, and A. Jenkins (2008), “Effects of Advertised Pricing on Brand Image for an On-Line Retailer,” Proceedings of the 2008 Conference of the American Academy of
Advertising, 263-275
Franz, Hackl, Michael E. Kummer, and Rudolf Winter-Ebmer (2010), “99 Cent: Price Points in E-Commerce,” ZEW Discussion Paper, 10-022, Leibniz Information Centre for Economics Friedman, Lawrence (1967), “Psychological Pricing in the Food Industry,” in Prices: Issues in
Theory, Practice, and Public Policy, ed. Almarin Philips and Oliver E. Williamson, Philadelphia: University of Pennsylvania Press, 187-201
– Should Retailers Set 9-Ending Prices,” Journal of Retailing, 75(1), 33-57
Gendall, P., Fox, M. and Wilton P. (1998), “Estimating the Effect of Odd Pricing,” Journal of
Product and Brand Management, 7(5), 421-32
Gendall, P., Holdershaw, J. and Garland, R. (1997), “The Effect of Odd Pricing on Demand,”
European Journal of Marketing, 31(11/12), 799-813
Georgoff, David M.(1972), “Odd-Even Retail Price Endings,” East Lancing: Bureau of Business and Economic Research, Graduate School of Business Administration , Michigan State University
Ginzberg, Eli(1936), “Customary Prices,” The American Economic Review, 26 (June), 296 Guéguen, Nicolas and Patrick Legoherel(2004), “Numerical Encoding and Odd-Ending Prices: The
Effect of a Contrast in Discount Perception,” European Journal of Marketing, 38(1/2), 194-208
Harris, Christine and Jeffery Bray(2007), “Price Endings and Consumer Segmentation,” Journal of
Product and Brand Management, 16(3), 200-205
Holdershaw, J., P. Gendall and R. Garland (1997), “The Widespread Use of Odd Pricing in the Retail Sector,” Marketing Bulletin, 8, 53-58
Kalyanam, K. and T. S. Shivley(1998), “Estimating Irregular Pricing Effects: A Stochastic Spline Regression Approach,” Journal of Marketing Research, 35(1), 16-29
Kleinsasser, S. and U. Wagner (2011), “Price Endings and Tourism Consumers’ Price Perceptions,”
Journal of Retailing and Consumer Services, 18(1), 58-63
Kinard, Brian R. Michael L. Capella Greg Bonner, (2013), “Odd Pricing Effects: An Examination using Adaptation-level Theory,” Journal of Product and Brand Management, 22(1), 87-94 Lambert, Zarrel V.(1975), “Perceived Prices as Related to Odd and Even Price Endings, ” Journal
of Retailing, 51(Fall), 13-22
Liang, Jianping, and Vinay Kanetkar (2006), “Price Endings: Magic and Myth,” Journal of Product
and Brand Management, 15, 377-385
Lyon, David W. (2002), “The Price is Right or is It?,” Marketing Research, Winter, 9-13.
Macé, S. (2012), “The Impact and Determinants of Nine-ending Pricing in Grocery Retailing,”
Journal of Retailing, 88(1), 115-130
Manning K. C. and D. E. Sprott (2009), “Price Endings Left-Digit Effects, and Choice,” Journal of
Consumer Research, 36(2), 328-335
MarketVision Research (2003), “van Westerndorp: Price Sensitivity Meter,” MarketVision Research, www.mv-research.com
Monroe, Kent B. (1990), Pricing: Making Profitable Decisions, 2nd ed., New York: McGraw-Hill. Naipaul, Sandra and H.G Parsa(2001), “Menu Price Endings that Communicate Value and Quality,”
The Cornell Hotel and Restaurant Administration Quarterly, 42(1), February, 26-37
Nguyen, Adam, Roger M. Heeler and Zinaida Taran(2007), “High-Low Context Cultures and Price-Ending Practices,” Journal of Product and Brand Management, 16(3), 206-214
Quigley, Charles J., Jr. and Elaine M. Notarantonio (1982), “An Exploratory Investigation of Perceptions of Odd and Even Pricing,” in Developments in Marketing Science, ed. Victoria L. Crittenden, Chestnut Hill, MA, Academy of Marketing Science.
Schindler, Robert M. and Thomas Kibarian(1996), “Increased Consumer Sales Responses through Use of 99-Ending Prices,” Journal of Retailing, 72(2), 187-199
Schindler, Robert M. and Patrick N. Kirby (1997), “Pattern s of Rightmost Digits Used in Advertised Prices: Implications for Nine-Ending Effects,” Journal of Consumer Research, 24 (September), 192-201
Schindler, Robert M. (2001). "Relative Price Level of 99-Ending Prices: Image Versus Reality," Marketing Letters, 12 (3), 239–247.
Schindler, Robert M. and Thomas M. Kibarian (2001), “Image Communicated by the Use of 99 Endings in Advertised Price,” Journal of Advertising, 30(4), 95-99
Schindler, Robert M.(2009), “Pattern of Price Endings Used in US and Japanese Price Advertising,”
International Marketing Review, 26(1), 17-29
Schindler, Robert M. (1991), “Symbolic Meanings of a Price Ending,” Advances in Consumer
Research, 18, 794-801
Simmons and Schindler (2003), “Cultural Superstitions and the Price Endings Used in Chinese Advertising,” Journal of International Marketing, 11(2), 101-111
Schindler, Robert M. and Alan R. Wiman(1989), “Effects of Odd Pricing on Price Recall,” Journal
of Business Research, 19 (November), 165-177.
Schindler, Robert M. (2006), “The 99 Price Ending as a Signal of a Low-Price Appeal,” Journal of
Retailing, 82 (1), 71–77
Schindler, Robert M. and Lori S. Warren (1988), "Effect of Odd Pricing on Choice of Items from a Menu," in Advances in Consumer Research, 15, ed. Michael J. Houston, Provo, UT: Association for Consumer Research. 348-353.
Stiving, Mark and Russell S. Winer(1997), “An Empirical Analysis of Price Endings with Scanner Panel Data,” Journal of Consumer Research, 24(June), 57-67
Suri, Rajneesh, Rolph E. Anderson and Vassili Kotlov (2004), “The Use of 9-Ending Prices: Contrasting the USA with Poland,” European Journal of Marketing, 38(1/2), 56-72
Thomas, M. and V. Morwitz(2005), “Penny Wise and Pound Foolish: The Left-Digit Effect in Price Cognition,” Journal of Consumer Research, 32(1), 54-64
van Westendorp, P. H. (1976), “Price Sensitivity Meter(PSM) -A New Approach to Study Consumer Perception of Prices-,” Proceedings of a Congress in Venice September 1976:
Main Sessions, ESOMAR Congress, 139-167
Varki, Sajeev, Sanjiv Sabherwal, Albert Della Bitta, and Keith M. Moore(2006), “Price-end Biases in Financial Products,” Journal of Product & Brand Management, 15(6), 394-401