An empirical analysis on the efficiency of the microfinance investment market
著者 Inoue Takeshi, Hamori Shigeyuki
権利 Copyrights 日本貿易振興機構(ジェトロ)アジア
経済研究所 / Institute of Developing
Economies, Japan External Trade Organization (IDE‑JETRO) http://www.ide.go.jp
journal or
publication title
IDE Discussion Paper
volume 271
year 2010‑12
URL http://hdl.handle.net/2344/934
INSTITUTE OF DEVELOPING ECONOMIES
IDE Discussion Papers are preliminary materials circulated to stimulate discussions and critical comments
IDE DISCUSSION PAPER No.271
An Empirical Analysis on the Efficiency of the Microfinance Investment Market
Takeshi INOUE* and Shigeyuki HAMORI**
December 2010
Abstract
This paper empirically analyzes the market efficiency of microfinance investment funds. For the empirical analysis, we use an index of the microfinance investment funds and apply two kinds of variance ratio tests to examine whether or not this index follows a random walk. We use the entire sample period from December 2003 to June 2010 as well as two sub-samples which divide the entire period before and after January 2007. The empirical evidence demonstrates that the index does not follow a random walk, suggesting that the market of the microfinance investment funds is not efficient. This result is not affected by changes in either empirical techniques or sample periods.
JEL classification: G14, G21
Keywords: efficient market hypothesis, microfinance investment, variance ratio test
*Associate Senior Research Fellow, Institute of Developing Economies ([email protected]).
** Professor of Economics, Faculty of Economics, Kobe University ([email protected]).
The Institute of Developing Economies (IDE) is a semigovernmental, nonpartisan, nonprofit research institute, founded in 1958. The Institute merged with the Japan External Trade Organization (JETRO) on July 1, 1998.
The Institute conducts basic and comprehensive studies on economic and related affairs in all developing countries and regions, including Asia, the Middle East, Africa, Latin America, Oceania, and Eastern Europe.
The views expressed in this publication are those of the author(s). Publication does not imply endorsement by the Institute of Developing Economies of any of the views expressed within.
INSTITUTE OF DEVELOPING ECONOMIES (IDE), JETRO 3-2-2, WAKABA,MIHAMA-KU,CHIBA-SHI
CHIBA 261-8545, JAPAN
©2010 by Institute of Developing Economies, JETRO
No part of this publication may be reproduced without the prior permission of the IDE-JETRO.
An Empirical Analysis on the Efficiency of the Microfinance Investment Market
Takeshi INOUE
Associate Senior Research Fellow, Area Studies Center, Institute of Developing Economies,
3-2-2, Wakaba, Mihama-Ku, Chiba 261-8545 JAPAN Email: [email protected]
and
Shigeyuki HAMORI
Professor of Economics, Faculty of Economics, Kobe University, 2-1, Rokkodai, Nada-Ku, Kobe 657-8501 JAPAN
Email: [email protected]
Abstract
This paper empirically analyzes the market efficiency of microfinance investment funds.
For the empirical analysis, we use an index of the microfinance investment funds and apply two kinds of variance ratio tests to examine whether or not this index follows a random walk. We use the entire sample period from December 2003 to June 2010 as well as two sub-samples which divide the entire period before and after January 2007.
The empirical evidence demonstrates that the index does not follow a random walk, suggesting that the market of the microfinance investment funds is not efficient. This result is not affected by changes in either empirical techniques or sample periods.
JEL classification: G14, G21
Keywords: efficient market hypothesis, microfinance investment, variance ratio test
1. Introduction
Recently, microfinance has been increasingly seen as the new investment opportunity by global investors. Microfinance started as small non-collateral credit to rural poor in South Asia and Latin America in the 1970s, and initially it was implemented by microfinance institutions (MFIs) mainly through grants and donations from development agencies.1 Since the mid-1990s, however, some leading MFIs facing the necessity of raising more capital due to rapid loan growth have sought to transform into commercial organizations in order to attract the money they need. Meanwhile, international private investors have increasingly focused on microfinance because of its high repayment rates and stable returns, and they have significantly increased investment in MFIs, especially large-scale MFIs.
Foreign capital investment in microfinance is estimated at US$12 billion as of 2009, and more than half of it is managed by the investment funds that invest primarily in microfinance, known as microfinance investment vehicles (MIVs) (Reille et al., 2009, p. 1; Glisovic-Mezieres and Reille, 2010, p. 1).2 The early MIVs were mostly created by public organizations, such as development agencies and international financial institutions. Thereafter, private investors also expanded their investment in MIVs, and now institutional investors have become the main funding source for MIVs. In the past decade, MIVs have significantly grown in terms of both number and scale, albeit at slower growth rates during the recent global recession (Figure 1). Focusing on these growing MIVs, this paper aims to analyze the market efficiency from an empirical viewpoint.
Roberts (1967) and Fama (1970) proposed to classify market efficiency into three categories: weak form efficiency, semi-strong form efficiency, and strong form efficiency. The weak form efficiency indicates that the information of all past prices is reflected in today’s prices. The semi-strong efficiency implies that all public information is calculated into current prices. The strong form efficiency indicates that all information in a market, whether public or private, is accounted for in prices. This paper empirically analyzes the weak form efficiency for microfinance investment funds.
Hereafter in this paper, "the efficiency" refers to the weak form efficiency.
1 Microfinance typically consists of basic financial services such as credit, savings, insurance and remittance to low-income people, while small non-collateral credit to the poor is specifically called microcredit. In this paper, we use the term microfinance interchangeably with microcredit.
2 According to CGAP (2010), MIVs are defined as independent investment entities with more than 50% of their non-cash assets invested in microfinance.
1
Analysis of market efficiency in microfinance investment funds is considered an important issue. For example, unless the market is sufficiently efficient, it is not likely to allow a flow of funds to each MFI in an appropriate manner, which might prevent MFIs from reaching their major clients, that is, the poor borrowers. In our empirical analysis, we use MIV index data from Microfinance Investment Intelligence that indicates the growth of microfinance assets held by the publicly listed microfinance investment funds, and we apply two kinds of variance ratio (VR) tests to examine whether this index follows a random walk, thereby signifying that the market is efficient.
We use the entire sample period from December 2003 to June 2010 as well as two sub-sample periods which divide the entire period before and after January 2007. To the best of our knowledge, this is the first empirical study to analyze the efficient market hypothesis (EMH) in relation to microfinance investment funds.
The paper is organized as follows. The next section presents a brief explanation of the empirical techniques. Section 3 provides the definition, sources, and properties of the data, and Section 4 reveals the empirical results. The final section summarizes the main findings of this study and educes several interpretations.
2. Empirical Techniques 2.1 Variance Ratio Test
Denote by Pt the asset price at time and define t Xt as the natural logarithm of (
Pt
t ln( t)
X = P ). Our maintained hypothesis is given by the recursive relationship as follows:
1 ,
t t
X = +μ X − +εt , t=1, 2,L,T (1)
or
t t,
X μ ε
Δ = + t=1, 2,L,T (2)
where ΔXt =Xt −Xt−1 and [ ]E εt =0.
The VR test of Lo and MacKinlay (1988) is based on the property that the variance of (Xt −Xt q− ) is q times the variance of (Xt−Xt−1) . Therefore, the random walk hypothesis (RWH) can be checked by comparing 1q times the variance of (Xt−Xt q− ) to the variance of (Xt −Xt−1). Then, the VR, VR q)( , is defined as
2
2 2
( ) ( )
(1) VR q σ q
= σ (3)
where σ2( )q is 1q times the variance of (Xt −Xt q− ) and is the variance of . The null hypothesis is that is equal to one.
2(1) σ
t−1
(Xt −X ) VR(q)
Consider the following estimators for the unknown parameters μ, , and :
2(1) σ
2( )q σ
1 1
ˆ 1 T ( t t )
t X X
μ =T
∑
= − − , (4)2 2
1 1
ˆ (1) 1 T ( t t ˆ) ,
t X X
σ =T
∑
= − − −μ (5)2 2
1
ˆ ( )q 1 Tt (Xt Xt q ˆ) .
qT q
σ =
∑
= − − − μ (6)Thus, the corresponding VR estimator is given by
^ 2
2
ˆ ( )
( ) .
ˆ (1) VR q σ q
= σ (7)
Lo and MacKinlay show that the VR test statistic given by
^
2
( ) 1 ( )
ˆ ( ) Z q VR q
s q
= − (8)
is asymptotically N(0,1). Note that we have 3
2
1 1
1 1
2
1 2
1
ˆ ˆ
( )(
2( )
ˆ ( ) .
( ˆ)
T
t j t j t t
q t j
j T
t t j
t j
X X X X
q j
s q q X X
μ μ)
μ
− − − −
− = +
=
= + −
− − − −
⎛ − ⎞
= ⎜ ⎟
− −
⎝ ⎠
∑ ∑ ∑
(9)
3 Under the assumption that εt is iid, we have 2 2(2 1)( 1) ˆ ( )
3
q q
s q qT
− −
= .
3
2.2 Multiple Variance Ratio Test
Chow and Denning (1993) extend the conventional VR test introduced by Lo and MacKinlay (1988) and propose a multiple VR test. Consider a set of VR estimates,
{
VR q( ) |i i=1, 2,L,L} {
, corresponding to a set of predefined number of lags
}
| 1, 2, ,
q ii = L L . Chow and Denning (1988) propose a multivariate VR (MVR) test for the joint null hypothesis H0:VR q( )i =1 for i=1, 2,L,L.
qi
against the alternative hypothesis that HA:VR q( )i ≠1 for some . The test statistic is of the form:
* 1
( ) max | ( ) | .i
i L
Z q Z q
= ≤ ≤ (10)
The null hypothesis is rejected at α level of significance if Z q*( ) is greater than the [1−α* 2]th percentile of the standard normal distribution where . In this research, are used to calculate VR estimates and test statistics. Thus,
such that and
* 1
1 (1 ) L α = − −α / 2, 4,8,16
q= , 4}
{q ii| =1, 2, 3 q1 =2,q2 =4,q3=8, q4 =16.
Kim (2006) proposed a wild bootstrap approach to improve the small sample properties of VR tests. His approach involves computing the Lo-MacKinlay and Chow-Denning test statistics on samples of T observations formed by weighting the original data by mean 0 and variance 1 random variables and using the bootstrap distribution of the test statistics.4
3. Data
For empirical analysis, we need the data of microfinance investment index. For this purpose, we use the monthly data of Symbiotics Microfinance Index, which is expressed in US dollars. The data source is Microfinance Investment Intelligence (http://www.syminvest.com/microfinance-investment-vehicle/symbiotics-microfinance-i ndexes) [accessed July 20 2010]. The sample period is December 2003 through June 2010. For the empirical analysis, we use the following three periods:
Sample A: December 2003 through June 2010 Sample B: December 2003 through December 2006 Sample C: January 2007 through June 2010.
Sample A corresponds to the total sample. We carried out the sub-sample analysis to see
4 See Charles and Darne (2009) for the recent developments of variance ratio tests.
4
if there is any difference in the market structure of the microfinance investment index.
Sample A and sample B correspond to the first sub-sample and the second sub-sample, respectively. For each sample, we analyze the efficiency of each market using variance ratio tests.
4. Empirical Results 4.1 Total Sample
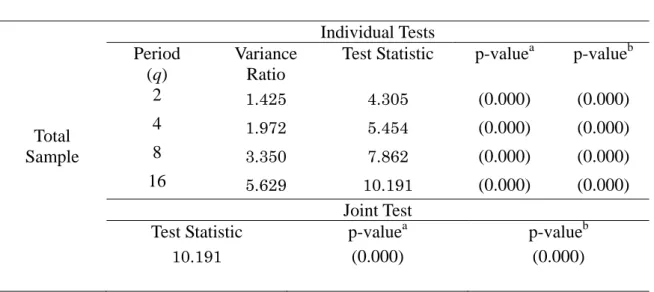
Table 1 demonstrates the VR estimates and test statistics of the RWH for the entire period based on the methodology of the conventional VR test by Lo and MacKinlay (1988). Note that we report two p-values; one is based on the asymptotic normality and the other is based on the wild bootstrap developed by Kim (2006). Kim (2006) demonstrates that the wild bootstrap tests have desirable size properties and exhibit higher power than their alternatives.
According to Table 1, the null hypothesis that the VR is equal to one is statistically rejected at all number of ’s at the 1% significance level. Thus, the RWH is rejected for the MIV (microfinance investment vehicle) index.
q
Test statistics based on the methodology of the multiple VR test by Chow and Denning (1993) are also reported in Table 1. The null hypothesis that the VR is equal to one is statistically rejected. Thus, the empirical results of the individual VR tests are reinforced by the empirical results of the multiple VR tests.
4.2 Sub-Sample Analysis
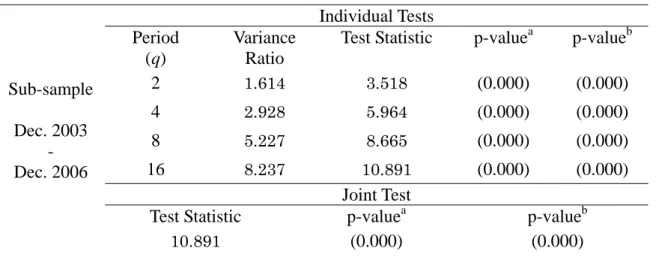
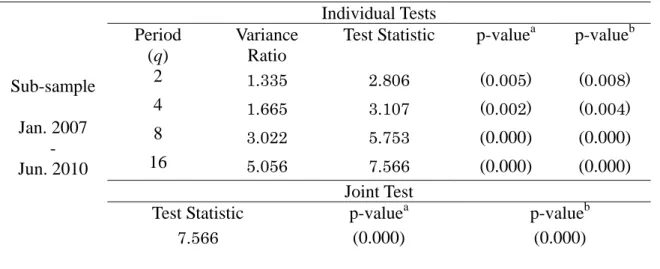
The results of the conventional VR test after dividing the entire study period into two sub-sample periods are presented in Tables 2 and 3. Table 2 shows the empirical results up to the end of 2006, while Table 3 shows the empirical results from the beginning of 2007.
For the first sub-sample, the empirical results of Table 2 are consistent with the results of Table 1. The null hypothesis that the VR is equal to one is statistically rejected at all number of ’s at the 1% significance level. Thus, the RWH is rejected for the MIV index for the first sub-sample.
q
For the second sub-sample, the empirical results of Table 3 are consistent with the results of Table 1 as well. The null hypothesis that the VR is equal to one is statistically rejected at all number of ’s at the 1% significance level. Thus, the RWH is rejected for the second sub-sample.
q
Test statistics based on the methodology of the multiple VR test by Chow and Denning (1993) are also reported in Tables 2 and 3. The null hypothesis that the VR is
5
equal to one is statistically rejected for both sub-periods. Thus, the empirical results of the individual VR tests are reinforced by the empirical results of the multiple VR tests.
We find that the microfinance investment market was not efficient during the sample period.
5. Conclusion
Microfinance investment vehicles (MIVs) have significantly grown especially since the early 2000s, mainly led by microfinance institutions (MFIs) searching for a wide and diversified range of funding sources and by private investors seeking both a financial return and a social return. In this paper, we empirically analyzed the market efficiency of these growing microfinance investment funds. For the empirical analysis, we use the MIV index data provided by Microfinance Investment Intelligence and apply the variance ratio test by Lo and MacKinlay (1988) as well as a multiple variance ratio test by Chow and Denning (1993) to examine whether or not the MIV index follows a random walk. Here, we use the three sample periods: the entire period from December 2003 to June 2006 and two sub-periods which divide the entire period before and after January 2007. The main results of the empirical analysis are as follow.
(1) The results of the analysis for the entire period show that the MIV index did not follow a random walk and thus the market was not efficient.
(2) The results of the analysis for both the first and second sub-periods show that the EMH was not satisfied because the MIV index did not follow a random walk.
The above results are robust to changes in empirical techniques, namely the variance ratio test or a multiple variance ratio test.
It is thought that this market inefficiency is probably caused by the market concentration of microfinance investment funds in several respects. To offer a specific example, MIV investments tend to be concentrated in a few large MFIs; on average, 25% of each MIV’s portfolio is invested in just five MFIs (Glisovic-Mezieres and Reille, 2010, p. 2).5 As a result, a few leading MFIs are likely to raise adequate funds in the investment market, while others may be constrained from fundraising in the market.
Accordingly, in order to reduce such market concentration and improve market efficiency, it is necessary to encourage all MFIs to increase the transparency of their financial and social performance and create an environment in which global investors can invest more in small- and medium-scale MFIs.
5 The market of microfinance investment funds is also concentrated in that the top 10 funds hold about 60% of the asset base (Reille and Glisovic-Mezieres, 2009, p. 1).
6
References
CGAP (2010) CGAP 2010 MIV survey report: market data & peer group analysis, Washington, D.C.: CGAP.
Charles, A. and O. Darne (2009) "Variance-ratio tests of random walk: An overview,"
Journal of Economic Surveys 23, 503–527.
Chow, K. V. and K. C. Denning (1993) "A simple multiple variance ratio test," Journal of Econometrics 58, 385-401.
Fama, E. F. (1970) "Efficient capital markets: A review of theory and empirical work,"
Journal of Finance 25, 382-417.
Glisovic-Mezieres, J. and X. Reille (2010) "Microfinance investors adjust strategy in tougher market conditions," CGAP Brief, October.
Kim, J. H. (2006) "Wild bootstrapping variance ratio test," Economics Letters 92, 38-43.
Lo, A. W. and A. C. MacKinlay (1988) "Stock market prices do not follow random walks: Evidence from a simple specification test," Review of Financial Studies 1, 41-66.
MicroRate (2010) State of microfinance investment: the MicroRate 2010 MIV survey, July.
Reille, X. and J. Glisovic-Mezieres (2009) "Microfinance funds continue to grow despite the crisis," CGAP Brief, April.
Reille, X., J. Glisovic-Mezieres, and Y. Berthouzoz (2009) "MIV performance and prospects: highlights from the CGAP 2009 MIV benchmark survey," CGAP Brief, September.
Roberts, H. (1967). Statistical versus clinical prediction of the stock market.
Unpublished manuscript, CRSP, University of Chicago.
7
Table 1 Results of Variance Ratio Tests Total Sample
Total Sample
Individual Tests Period
(q)
Variance Ratio
Test Statistic p-valuea p-valueb
2 1.425 4.305 (0.000) (0.000)
4 1.972 5.454 (0.000) (0.000)
8 3.350 7.862 (0.000) (0.000)
16 5.629 10.191 (0.000) (0.000)
Joint Test
Test Statistic p-valuea p-valueb
10.191 (0.000) (0.000)
Note:
p-valuea: probability value based on the asymptotic normality.
p-valueb: probability value based on the wild bootstrap.
8
Table 2 Results of Variance Ratio Tests 1st Sub-Sample
Sub-sample Dec. 2003
- Dec. 2006
Individual Tests Period
(q)
Variance Ratio
Test Statistic p-valuea p-valueb
2 1.614 3.518 (0.000) (0.000)
4 2.928 5.964 (0.000) (0.000)
8 5.227 8.665 (0.000) (0.000)
16 8.237 10.891 (0.000) (0.000)
Joint Test
Test Statistic p-valuea p-valueb
10.891 (0.000) (0.000)
Note:
p-valuea: probability value based on the asymptotic normality.
p-valueb: probability value based on the wild bootstrap.
9
Table 3 Results of Variance Ratio Tests 2nd Sub-Sample
Sub-sample Jan. 2007
- Jun. 2010
Individual Tests Period
(q)
Variance Ratio
Test Statistic p-valuea p-valueb
2 1.335 2.806 (0.005) (0.008)
4 1.665 3.107 (0.002) (0.004)
8 3.022 5.753 (0.000) (0.000)
16 5.056 7.566 (0.000) (0.000)
Joint Test
Test Statistic p-valuea p-valueb
7.566 (0.000) (0.000)
Note:
p-valuea: probability value based on the asymptotic normality.
p-valueb: probability value based on the wild bootstrap.
10
Source: Glisovic-Mezieres and Reille (2010) and MicroRate (2010).
11