Structure and Phase Characterization of Triacylglycerols by Raman Spectroscopy
Michiyo MOTOYAMA
Animal Products Research Division,
NARO Institute of Livestock and Grassland Science, Tsukuba, 305-0901 Japan
Abstract
Triacylglycerols (TAGs) are one of the main forms of energy storage in living organisms. Natural fats, which are nothing but the multicomponent TAG systems, are widely used in industrial products such as food, medicine and cosmetics. Industrial demands promote the studies on thermophysical properties of the multicomponent TAG systems for a long time; however, the whole picture of their phase behavior is yet to be drawn. With a view to understand the complicated phase behavior of natural fats, I have investigated on the physical mixtures of TAGs by Raman spectroscopy.
Firstly, the background of this study is introduced (Chapter 1). Raman spectroscopy is the appropriate method to characterize TAGs, particularly when they exist in multicomponent systems. The structure and phase behavior of TAGs are then summarized with emphasis on the recent developments (Chapter 2). The interesting phase properties of TAGs, polymorphism and “molecular compound” formations, are introduced. The factors affecting these phase properties, such as crystallization conditions, are also mentioned. Next, the spectral features of TAGs are described in relation to their phase specific structures (Chapter 3). On the basis of the accumulated spectroscopic data, Raman spectroscopy has contributed to reveal the detailed structure of TAG polymorphs. Based on the knowledge described in these chapters, two TAG systems are studied. They include a TAG binary system that is known to form a molecular compound (Chapter 4) and several natural fats that are widely used in industrial products (Chapter 5).
The results of the present study indicate that a third component, a molecular compound, is formed in the TAG binary system and its structure seems to be influenced decisively by crystallizing procedures. The molecular compound may be the phase dynamically formed by crystallization, rather than existing stationary in the liquid phase as previously considered (Chapter 4). In addition, the present study implies that the molecular compound may exist not only in a model binary system but also in real multicomponent systems. It is also shown that one can differentiate the origin of natural fats by detecting the difference in their polymorphic phases by using Raman spectroscopy (Chapter 5).
Finally, future prospects of Raman spectroscopic studies on TAG systems for deepening the present understanding are presented (Chapter 6). Recent developments on the spectrometer offer bright future prospects for Raman spectroscopic studies on multicomponent TAG systems. Raman spectroscopy helps us to draw the whole picture of the phase behavior of natural fats.
Key words: polymorphism, triacylglycerol multicomponent system, porcine fat, bovine fat, discrimination technique
Received 2011. 8. 1. Conferring University: The University of Tokyo
Chapter 1 Introduction
Triacylglycerols (TAGs) possess ideal properties for the energy storage in living organisms. They have high oxidation energy that is more than twice as high as those of sugars or proteins. Their hydrophobicity enables TAGs to self-assemble and exist without raising the osmotic pressure in a cell. They are one of the most important constituent of the life system. Despite these facts, TAGs have been put to the marginal area of biological studies, presumably because of their varying chemical structures and complex phase behaviors.
TAGs are familiar to anybody. They are used widely in many industrial products. Natural fats, which are nothing but the multicomponent TAG systems, are the major components of food as well as those of the matrices of cosmetics and medicine. 23) They are made up of more than 30 TAG species 32) with major constituent fatty acid generally being oleic acid. 78) Oleic acid is a representative unsaturated fatty acid that has one cis C=C double bond.
Industrial demands, especially those for better chocolate production, have promoted the studies on thermophysical properties of TAGs in the past 100 years. 21,93) By the use of differential scanning calorimetry and pulse nuclear magnetic resonance, the crystallization and polymorphism of natural fats have been studied. 115) It is widely known today that TAG crystal polymorphism has considerable influence on the texture, fluidity and appearance of the final fat products. 28) However, the whole picture of polymorphic phase behavior of natural fats is yet to be drawn.
In order to study the polymorphic behavior of natural fats in more detail, TAG binary-systems as well as single- TAG systems are important as model systems. In fact, these systems have been investigated extensively by X-ray diffraction (XRD). XRD is powerful for TAG polymorph identification since each polymorph has its own wide angle and small angle XRD patterns derived from their particular subcell and layer structures. Furthermore, introduction of high flux X-ray beam by synchrotron radiation enables time resolved measurements (~10 s) 118) of polymorphic transformations of TAGs. This makes it possible to detect and measure transient phases which
were often difficult to study because of their thermal instability. 34) Thanks to these XRD studies, a number of interesting phenomena occurring in TAG model systems have been elucidated.
The formation of“molecular compounds”is one of these interesting phenomena. 18,48) When two TAG species that have specific interactions with each other are mixed, they form a molecular compound at a fixed mixing ratio. A molecular compound behaves like a new, pure TAG species with unique phase behavior that differs from those of its component TAGs. All TAG species that have so far been reported to form molecular compounds have the oleic acyl moieties. The formation of molecular compounds is thought to mediated by the incompatible interaction between oleic and saturated acyl moieties and the compatible interactions between the oleic acyl moieties of the component TAGs. 33)
Another interesting phenomenon is the polymorphism. It has been suggested that the structure of the polymorph that appears first on crystallization determines the structure of the subsequently formed polymorphs and therefore the phase behavior. 24) The TAG species having both unsaturated and saturated acyl moieties shows this first-appearing polymorph whose structure can be distinguished from those of the other TAGs. 70) It is suggested that this may be one of the causes for the complicated polymorphic behavior of natural TAGs containing both saturated and unsaturated acyls.
Despite the above mentioned interesting indications, no precise structural data of the TAGs containing unsaturated acyls are available from single-crystal XRD analysis. The primary reason for this is the difficulty in obtaining the single crystals of TAGs. Crystals with adequate size for single-crystal XRD are difficult to be obtained. Even though they are obtained, the crystals are too soft to handle. Also, the crystal quality is often low especially for the TAGs which contain unsaturated acyls.
Single-crystal XRD data have been reported so far only for three on TAGs and they are TAGs having saturated acyls only. 22,30,51)
Vibrational spectroscopies, namely Raman spectroscopy and infrared absorption spectroscopy, have contributed to reveal the detailed TAG structures on the basis of the accumulated spectroscopic data
of basic molecules such as polyethylene, 97-99,108,110-114)
paraffins, 43,95,96) n-alkanes 42,101,103,105,130) and fatty acids. 40,41,47,54) The oleoyl acyl conformation, 16,106) the alkyl-chain-plane orientation 45) and the length of trans C-C chain 126) of TAG polymorphs have been studied in detail using these methods. The vibrational bands reflecting the alkyl-chain-plane orientation have been used to distinguish the TAG polymorphs. 4,12,13,90,127) Though it has not been fully appreciated, vibrational spectroscopy has a distinct advantage when one tries to deal with multicomponent TAG systems. A vibrational spectrum as a whole is often called“molecular finger print”. By using this characteristic of vibrational spectra, one can extract information on the phases existing in complex TAG systems.
Within the context of“metabolic syndrome”in recent years, it can be said that Raman spectroscopy is a promised method to study TAGs. It has been used to study the status of TAGs in cells. 107) Raman spectroscopy is most suitable to study TAGs in the aqueous systems because it is not too sensitive to the presence of water.
Even when the system contains more than 90w/w%
of water, well resolved spectral features of lipids are obtainable. 54) The large polarizability of lipids gives strong Raman scattering; lipids are therefore tractable molecules for Raman spectroscopy. Their structural changes are reflected with high sensitivity in the spectra even though they are in aqueous systems. For example, Raman spectroscopy has been applied to monitor the breakdown of TAG complex in lipoprotein particles in an aqueous system. 9)
I have used Raman spectroscopy to study several selected binary/multi- component TAG systems, with a view to clarify the complicated phase behavior of natural fats. In the present thesis, the structure and phase behavior of TAGs are summarized with emphasis placed on recent developments (Chapter 2). The spectral features of TAGs are then described in relation to their phase specific structures (Chapter 3). On the basis of these, two TAG systems are studied. They include a TAG binary system that is known to form a molecular compound (Chapter 4) and several natural fats that are widely used in industrial products (Chapter 5). Future prospects of Raman spectroscopic studies on TAG systems for
deepening the present understanding are also presented (Chapter 6).
Chapter 2
Structure and Phase Behavior of Triacylglycerols
Abstract
TAGs possess the basic structure of lipids: a glycerol backbone and acyl chains attached to it. They are the biological molecules, and oleoyls are the major constituent acyls of the TAGs observed in natural fats.
TAGs form crystals with layer structure just like other long chain molecules, and exhibit a complex polymorphic phase behavior. Three polymorphs with different subcell structure, α, β’and β, are generally observed. Polymorphic transformation goes monotropically in this order in accord with thermal conditions. It is also known that TAGs form“molecular compound”in their binary systems.
A molecular compound behaves like a new, pure TAG species with unique phase behavior that differs from those of its component TAGs. The formation of a molecular compound is thought to occur in terms of the specific intermolecular interactions between oleic acyl moieties of the component TAG molecules. In this chapter, the factors affecting TAG structures and phase behavior are summarized with emphasis on the recent developments.
Structure of TAGs
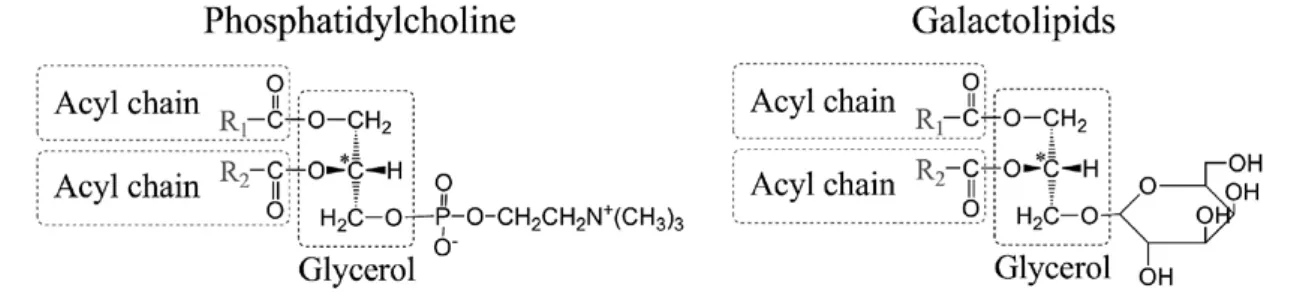
TAGs possess the basic structure of lipids: a glycerol backbone and acyl chains attached to it (Fig. 1). This basic structure is also conserved in the other important lipids, such as the main classes of phospholipids and glycolipids (Fig. 2).
In order to designate the stereochemistry of TAGs, the“sn”notation which stands for‘stereochemical numbering’is used in a manner similar to that used for the other glycerol containing lipids. When the glycerol molecule is drawn in a Fisher projection with the secondary hydroxyl group to the left of the central prochiral carbon atom, the carbons are numbered 1, 2 and 3 from top to bottom. Molecules that are stereospecifically numbered in this fashion have the prefix“sn” immediately preceding the term“glycerol”in the name
of the compound. The TAG molecule in Fig. 3 is therefore called“1, 2-dioleoyl-3-palmitoyl-sn-glycerol”. This TAG molecule is also called“OOP”for short:“O”being the abbreviation for“oleic acyl”and“P”being for“palmitic acyl”wherein they are arranged in sn order.
The shape of a TAG molecule in solid phase is often compared to a“tuning fork”or the alphabet“h”(Fig. 4).
To achieve these shapes, dihedral angles different from 180° which is normally expected are introduced along the skeletal bonds of the glycerol and of the acyl chains approximated to the glycerol. Generally, sn-1 and -3 acyl chains are oriented in one direction and sn-2 in the opposite direction as shown in Figs. 1 and 3. When the chain placed in sn-1 and -3 position are very different in their structure (e.g. short or unsaturated), this configuration (sn-1 and -3 opposed to -2) is not possible.
There is an X-ray diffraction study which indicates that, in
some crystal forms of PPO and SSO (S: stearic acyl), sn-1 and -2 chains point same direction. 92) Such a conformation is common in glycerophospholipids and glyceroglycolipids (Fig. 2).
The major factors that influence the physical properties of TAGs are the chemical structure of each acyl
Fig. 4. Shapes of a triacylglycerol molecule Fig. 4. Shapes of a triacylglycerol molecule Fig. 1. Structure of a triacylglycerol (TAG). TAGs are esters of a glycerol (propane-1,2,3-triol) and three fatty acids.
Fig. 2. A phospholipid and a glycolipid: The basic structure is widely observed in lipids
Fig. 3. 1,2-Dioleoyl-3-palmitoyl-sn-glycerol (OOP).
chain and its sn position. They are described in detail in the next section.
Mechanism deciding TAG composition
TAGs are the biological molecules and the major constituents of natural fats and oils. 87) All types of eukaryotes and a small group of prokaryotes accumulate TAGs as their energy source. 74,131)
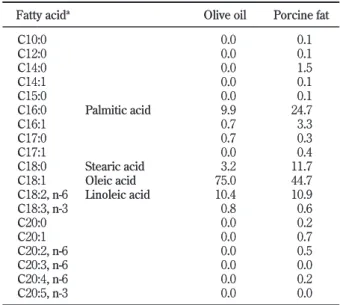
Table 1 shows the fatty acid composition of natural fats. Oleic acid (C18:1), palmitic acid (C16:0), stearic acid (C18:0) and linoleic acid (C18:2) are the main constituents of TAGs. The fatty acid chains occurring in nature generally have even numbers of carbon atoms.
This is because of the units of fatty acid synthesis. The de novo synthesis of fatty acids begins with introducing two carbons from malonil coenzyme A, and the fatty acid chain elongation proceeds with adopting also two carbons from malonil coenzyme A and acyl coenzyme A (Fig. 5).
The melting points of saturated fatty acids are shown in Fig. 6. The longer acids show the higher melting points.
They show the odd-even-chain length effects: even numbered fatty acids have higher melting points than odd numbered ones. This trend is consistent with common knowledge of the odd-even-chain length effects on melting point observed in n-alkanes. 52)
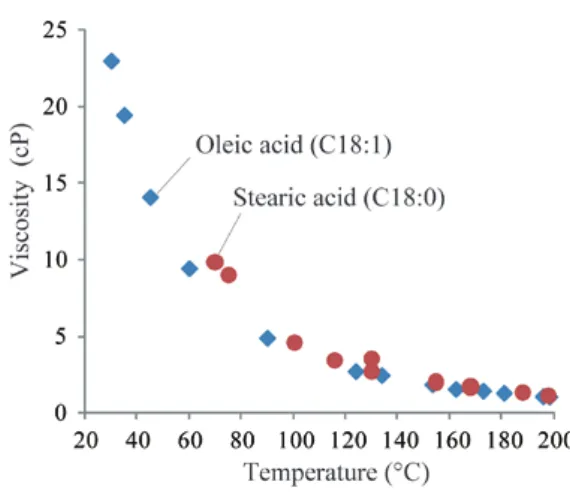
Fig. 7 shows the viscosities of stearic acid (C18:0) and oleic acid (C18:1). 91) Both fatty acids have the same number of carbons while oleic acid has one cis C=C bond. Oleic acid show lower viscosity than stearic acid due to the cis C=C which introduces a bent conformation to the molecule. This conformation prevents the fatty acids from packing tightly and alters the van der Waals force existing among the molecules.
The fatty acids are esterified to the glycerol sn- carbons in accord with enzyme substrate specificities. 89) The difference in sn-specific fatty acid composition is thus genetic in origin and it leads to the differences in physical properties (Table 2). These sets of fatty acids in Table 2, e.g. POP and PPO, have the same fatty acid composition, two palmitic acids and one oleic acid; however, there is a difference in their melting points which is derived from the difference in sn positions.
By using above mentioned mechanisms, living organisms control TAG physical properties in order to accommodate environmental temperature change. When the temperature becomes lower, the composition of TAGs becomes the one with higher unsaturated fatty acids in order to maintain the TAG fluidity. If TAGs are completely crystallized due to the low temperature, the cells are probably not able to use TAGs as the energy source. Homeoviscous adaptation, the term which is often used for cell membrane, can be also applied for TAGs in living organisms.
Table 1. Fatty acid composition of a plant oil and an animal fat (w/w%) 78)
Fatty acida Olive oil Porcine fat
C10:0 C12:0 C14:0 C14:1 C15:0 C16:0 C16:1 C17:0 C17:1 C18:0 C18:1 C18:2, n-6 C18:3, n-3 C20:0 C20:1 C20:2, n-6 C20:3, n-6 C20:4, n-6 C20:5, n-3
Palmitic acid
Stearic acid Oleic acid Linoleic acid
0.00.0 0.00.0 0.09.9 0.70.7 0.03.2 75.010.4 0.80.0 0.00.0 0.00.0 0.0
0.10.1 1.50.1 24.70.1 3.30.3 11.70.4 44.710.9 0.60.2 0.70.5 0.00.2 0.0
a Number of carbon atoms: number of C=C double bonds, position of C=C bonds
Table 2. Comparison of melting points between the TAGs consisting of same fatty acids 24)
TAG speciesa Melting point(℃)b
POPPPO
SOSSSO
PSPSPP
SPSPSS
37 35 43 41 67 62 68 64
a P, palmitic acyl; O, oleic acyl; S, stearic acyl
b Average values of the experimental data shown in the reference Table 2. Comparison of melting points between the TAGs
consisting of same fatty acids 24)
TAG speciesa Melting point(℃)b
POPPPO
SOSSSO
PSPSPP
SPSPSS
37 35 43 41 67 62 68 64
a P, palmitic acyl; O, oleic acyl; S, stearic acyl
b Average values of the experimental data shown in the reference
Fig. 5. TAG synthetic and metabolic pathways in a mammalian cell 29)
Polymorphic phase in TAG crystals
TAG crystals show polymorphism. Just like other long chain molecules, TAGs also form crystals with layer structures. These crystal structures of TAGs are usually classified by two distinctive features: the number of acyl- chain-length structures participating in a layer (Fig. 8a) and the type of subcell structure within the acyl-chain- length structures dictated by the inter-chain orientation (Fig. 8b). The stable crystal of TAGs has double-chain lengths or triple-chain lengths type of structure (Fig.
8a). The common subcell structure within a chain-length structure is known to be hexagonal with no ordered arrangement of the chain planes (H), orthorhombic with every second chain plane is perpendicular to the plane of the rest (O⊥) or triclinic with all chain planes are parallel (T//) (Fig. 8b).
The possible combination number of the chain-length structures and the subcell structures is large. A given TAG species has at least 36 possible packing manners in theory. In practice, however, only three structures called α, β’and β-polymorphs generally exist due to the packing preference which is brought by intermolecular interactions and thermodynamic conditions.
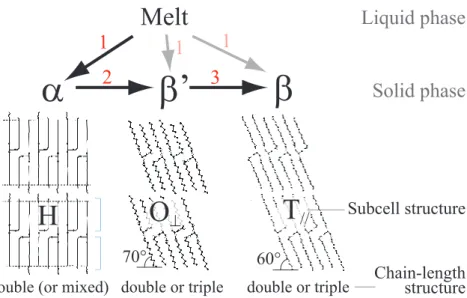
The polymorphic transformation goes monotropically in the order α, β’and β, indicated by the arrows in Fig.
9. For most of TAG species, the β polymorph is the most stable polymorph; however, β’is of the most stable one for some TAG species, e.g. PPO 81) and PPM, 46) M: Myristic acyl. For complex TAG mixtures, i.e. natural fats, β’
polymorph is often the most stable polymorph. 115) The structure of the polymorphs and the structural changes associated with polymorphic phase transformation are described as follows (Fig. 9).
α-polymorph: Thermodynamically, this is the least stable phase with the lowest melting point. Its chain- length structure is generally double-chain and the subcell structure is H. The main part of the hydrocarbon chains are oscillating and hexagonally close packed. The methyl end group regions are somewhat more disordered, as in liquid crystals. 27)
β’-polymorph: This is the more stable phase showing the intermediate melting point. Its chain-length structure is double- or triple-chain and the O⊥ subcell structure exists within all or part of the layer. The acyl chains are Fig. 6. Relationship between the carbon atom number of
saturated fatty acids and their melting points 87)
Fig. 7. Viscosities of two fatty acids. Stearic acid: Saturated acid with 18 carbon atoms. Oleic acid: Unsaturated 18-carbon fatty acid with one cis C=C 91)
Fig. 8. Two kinds of Structure in TAG crystals. (a): Chain- length structure. 70) a, double-chains length structure;
b, triple-chain lengths structure; c, mixed structure. (b) Subcell structure within a layer. H, hexagonal subcell structure; O⊥, orthorhombic perpendicular subcell structure; T//, triclinic parallel subcell structure
tilted about 70° from the plane formed by methyl end groups.
β-polymorph: The most stable phase showing the highest melting point. Hydrocarbon chain planes are arranged in parallel and the subcell structure is generally T//. The angle of tilt is about 60°.
These polymorphs are often described with subscripts, e.g. β1, β2. Only three terms, i.e. α, β’and β, are not enough to indicate the polymorphism of TAGs containing unsaturated acyls because of its complexity. 82) It is recommended that they are numbered in the order of decreasing melting points. 53) These nomenclatures with different subscript need not always indicate independent polymorphs. For example, Kellens et al. 36) reported that the melting point variation between [β’1 and β’2] and [β1 and β2] of a TAG seemed to be only due to crystal perfection and crystallinity. Mykhaylyk and Martin 70) also reported that α2 phase formed in some TAGs species can be characterized as a transient structure. These polymorphs, however, are likely to be isolated and stabilized by cooling immediately after its formation. 46) To understand polymorphic transformations taking place in TAGs, especially in natural fats, the structure of various unstable phases have to be determined.
The lateral interaction among acyl chains, intermolecular glycerol interactions and the methyl ends interaction are the main driving force of the phase transformation. The associated structural changes can be explained as below.
Melt → solid phase (arrow 1 in Fig. 9): Cooling process. The C-C bonds within acyl chains become trans configuration. Crystallization is the least understood phase transition in terms of structural changes. The details are described in the next section.
α → β’(arrow 2): Hexagonal packing in α-polymorph likely to change always to the orthorhombic packing. 27) Which chain-length structure they form (double or triple) is depend on chain sorting which may be related to the conformational disordering of the α form. 25) The chains become tilt and the methyl ends become lined up. The methyl-groups overlap develops large intermolecular repulsion. To reduce this large repulsive energy, the perpendicular chain-plane arrangement (⊥) is likely to be introduced. 24)
β’→ β (arrow 3): Parallel chain-plane arrangements (//) are introduced within all layers. The matching of the terminal methyl groups within the inter-layer space and the conformational order of unsaturated bonds, when such are present, is completed. 14,15,121)
Fig. 9. Polymorphic transformation and structures of polymorphs 27)
The polymorph transformation to more stable phase can be melt-mediated process which enables the transformation finish in a shorter time compared to solid- to-solid transformations. 46,84) This difference can be explained by thermodynamics. 83)
Crystallization process
The cooling-down procedure from the TAG melt greatly influence the crystallization of fats. In fats industries, these procedures so-called“annealing”
are the important part of the technology to control the polymorph formed. To understand the crystallization of TAG systems, general theories for crystal nucleation and crystal growth have been applied. 20) However, as been mentioned so far, polymorphism complicates the crystallization of TAGs. Herewith, a rough picture will be given for the crystallization of TAGs.
To describe the crystallization behavior of TAGs, Gibbs free energy (G) is the most important. Because crystallization, i.e., phase transition, is the process which changes volume (V) and entropy (S) of the system;
therefore, it is difficult to use the other thermodynamic potentials which have V and/or S as their variables:
ΔE=TΔS-PΔV (E : internal energy) ΔH=TΔS+VΔP (H : enthalpy)
ΔF=-SΔT-PΔV (F : Helmholtz free energy) where T is temperature and P is pressure.
For crystallization from the melt to occur, the activation energy barrier, ΔG††, should be crossed over.
The relative ΔG†† values for TAG polymorphs were studied by Malkin 57) and they can be depicted as shown in Fig. 10. The larger ΔG†† value indicates the greater difficulty of the formation of crystal nucleus. β-polymorph is most difficult to crystallize due to its largest ΔG††. It is consistent with the observed crystallization rate which decreases in order of α, β’and β. 84)
ΔG is expressed by the function of temperature and pressure as:
ΔG=-SΔT+VΔP
The Gibbs free energy of one particle is called chemical potential μ:
Δμ=-sΔT+vΔP
μ is convenient to use especially when one wants to describe crystallization since some local equilibriums,
i.e. liquid phase and solid phase, are coexisting within a system under crystallization process. The difference in μ between the local equilibrium systems (Δμ) is the driving force to cross over the activation energy barrier.
When Δμ is defined as:
Δμ≡ μ liquid-μ solid
μ liquid: μ of the liquid phase exists at crystallization
μ solid: μ of the solid phase exists at crystallization
it can be derived:
Δμ=-(s liquid-s solid )ΔT +(v liquid-v solid)ΔP ― eq. 1 It can be supposed that the difference in volume is small between liquid and solid,
v liquid ≈ v solid
Therefore, eq. 1 becomes:
Δμ=-(s liquid-s solid)ΔT
where ΔT is called the supercooling:
ΔT= Tm-T
Tm: melting temperature of the solid phase T: actual temperature of the system
When larger ΔT is induced, the absolute value of Δμ becomes larger. The larger Δμ the larger the driving force for crystallization and the driving force cross the activation energy barrier ΔG††, crystal nucleus is formed.
After the nucleation, crystals grow at a certain rate which is proportional to Δμ. Fig. 11 shows the Δμ of each polymorph at a temperature T. Δμ is larger in the order of Δμα < Δμβ’ < Δμβ. This indicates that once the nucleus is formed, the more stable polymorph grows faster.
Structural changes of TAGs on crystallization are proposed by synchrotron radiation X-ray diffraction Fig.10. Diagram of the activation Gibbs free energy ΔG††57,89)
and those of each polymorph
studies (Fig. 12). Lamella stacking is firstly occurred (A in Fig. 12), followed by the detailed subcell packing (B in Fig. 12). 118,119) It is estimated that the time required for the A to B transformation is of the order of several tens of second for SOS β’-polymorph and 500 second for SOS β2-polymorph.
Regarding the formation of the lamella structure, Mykhaylyk et al. recently proposed the plausible model. 70,71) Two types of molecular dimmers possibly exist in a TAG liquid phase and the stability of these dimmers depends on thermal conditions and compatibilities between the TAG acyl moieties (see Fig.
46 on page 49). In a liquid state of TAGs containing solely saturated or unsaturated acyls, only one type of dimers with double-chain-length structure is formed and leading double-chain-length layer. In TAGs with both saturated and unsaturated acyls, a packing incompatibility between these acyls stabilizes both type of dimers and leading the formation of the lamella with random packing of the two dimers. The structural complexity of the latter lamella likely explains the complex phase behavior of TAGs with unsaturated acyls.
Molecular compound formation
It has been reported that a third component exists in some TAG binary systems. This third component is known as the“molecular compound”.
It is generally accepted that the liquid phase of a TAG mixed system may be treated as a close approximation to an ideal mixture. 20) Once they are crystallized, they are separated and generally form solid solution (Fig.
13a). However, in some TAG binary systems which have
“specific interactions”, they form molecular compounds (Fig. 13b). A molecular compound behaves like a new, pure TAG species with unique phase behavior that differ from those of its component TAGs.
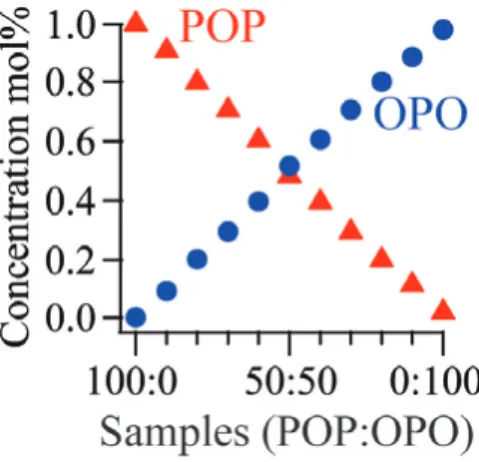
The first report on the molecular compound was made in 1963 by Moran. 66) He conducted DSC thermal analysis on several TAG binary systems and found unexpected melting behaviors in POP-OPO binary system. The observed phase diagram of POP-OPO system was likely to be made up of two binary systems, in juxtaposition, of POP-compound and compound-POP (Fig.
14). He thus proposed that the“molecular compound”
Fig.11. Relationship between chemical potential and temperature for liquid phase and three polymorphs of TAGs. Δμ, difference in chemical potential between liquid and solid; T, actual temperature; Tm, melting temperature 1,19,120,123)
Fig.12. A model of crystallization of fats from neat liquid 80)
is formed in POP-OPO binary system and it would not be chemically bonded as in true compound, but merely a highly-favored crystal packing.
After this report, several studies have reported on the molecular compound formation in TAG binary systems using thermal analysis and powder X-ray diffraction. The formations of a molecular compound have also been observed in POP-PPO, 63,66) SOS-OSO 48) and SOS-SSO systems. 18,62) It must to note that oleoyl acyls (O) are present in both component TAGs of the above systems.
Therefore, the intermolecular interactions at oleoc acyl moieties, including π-π interaction among olefinic groups, are thought to be the driving force for the molecular
compound formation. It is quite interesting how such a van der Waals type interaction can enable the formation of the stable compound. However, the structure and the driving force for the compound formation are not well understood yet, despite numerous attempts.
With emphasis on the recent developments, the fundamental knowledge of polymorphism and molecular compound formation of TAG systems have been summarized in relation to the factor influencing these phenomena, such as TAG chemical structures and crystallization conditions. Since the phase behavior of a multicomponent TAG system is thought to be able to be obtained by summing all the behavior of the component TAGs, 20) it is important to understand these fundamentals of TAG structure and phase behavior.
Chapter 3
Raman Spectra of Triacylglycerols
Abstract
The total number of the atoms of a TAG molecule is about 170, hence it has approximately 500 normal modes.
Some of them are selected to be observed as a vibrational spectrum,“a letter from the TAG molecule”.
Vibrational spectroscopy is the suitable method to investigate TAG structural changes during phase transition because they can be applied not only the crystals but also the liquid phases. Since the conformational changes of TAGs are usually accompanied with large polarizability changes, their Raman spectra reflect these changes with high sensitivity and are particularly useful in this respect.
In this chapter, the Raman spectra of TAGs will be interpreted on the basis of the previous studies on polyethylene, paraffines, n-alkanes and fatty acids. Firstly, the vibrational modes of polyethylene will be briefly introduced because their spectra are understood well and they dominate the TAG composition. The assignments of Raman bands (1800-700cm-1) observed in several TAG phases will be then illustrated with respect to each spectral region. Spectral differences among the phases will be explained in relation to their structures.
Fig.13. Illustration of “molecular compound” formation
Fig.14. Melting behavior of POP-OPO binary systems. 66) Sample crystals were prepared as follows: Melts (100℃) were quenched to 0℃ and then incubated 2-4 weeks at as high a temperature as possible to induce most stable polymorphs. ○, melt point; △thaw point;
L, liquid; Smc, solid of molecular compound; SOPO, solid of OPO; SPOP, solid of POP.
Introduction
TAGs are one of the well known molecules which give strong Raman scattering, since their acyl moieties that dominate the composition have large polarizability volumes. The structural changes during TAG phase transition are reflected with high sensitivity in the Raman spectra. In order to understand the complicated TAG spectra, the spectrum of polyethylene is the good reference. Polyethylene chains are the model compound of lipids, and their spectra are studied extensively for a long time.
A polyethylene chain, an infinite trans zigzag chain, is constructed by repeating -CH2- units which have nine proper vibrations: three atoms with three degree of freedom (x, y and z) for each. These vibrations are depicted in Fig. 15. Although the Bravais unit cell of polyethylene chains is -CH2-CH2-, the dispersion curve of polyethylene is often expressed taking -CH2- as the unit because of simplicity (Fig. 16). There are nine branches ( ν1, ν2, … νi … , ν9) and the δ indicates the phase difference between two adjacent -CH2- units. Optical active vibrations have the value 0 or π for the δ; therefore, they can be expressed as νi(δ=0) or νi(δ=π). Among these modes, the Raman active modes are ν1(δ=0), ν2(δ=0), ν3(δ=π), ν4(δ=0), ν4(δ=π), ν6(δ=π), ν7(δ=0) and ν7(δ=π). 88)
In crystalline polyethylene, there are inter-chain interactions, which influence the above described vibrational modes. The dispersion curve for the crystal has been also acquired. 109,113) Polyethylene crystals have orthorhombic perpendicular (O⊥) unit cell structure (Fig. 17a) and the Bravais unit contains two polyethylene chains (Fig. 17b). Therefore, every dispersion curve is split into two curves: One is for the vibration attributed to symmetric displacement of the adjacent-polyethylene chains; the other is for that of asymmetric (Fig. 18). This separation can be accounted for reasonably well using a model based on a short-range hydrogen atom-atom repulsive potential. 113) Because of the interaction between the two chains within a Bravais unit, the Raman spectra of the crystal become complicated. TAG polymorphs show similar types of crystal subcell structure; therefore, this effect should be kept in one’s mind.
Another factor complicates TAG polymorph spectra is the band progression. Just as described above, the bands observed in polyethylene spectra are limited in the in- phase vibrations (δ=0 or δ=π). On the other hand, finite chains show a series of progression bands (0≠δ≠π). 104) The spectral pattern of the progression bands reflects very sensitively the chain length of the trans-zigzag chain.
TAGs consisting of the acyls with different chain length will have a few series of progression. 126)
Fig.15. Nine normal modes of -CH2-
Fig.16. Dispersion curve of single polyethylene chain. 49,88,111,112)δ is the phase difference between two adjacent units (-CH2-). Solid lines indicate in-plane vibrations, dashed lines indicate out-of-plane vibrations. CH2 twisting and CH2 rocking are coupled in ν7 and ν8.
Fig.17. Crystal structure and the Bravais cell of crystal polyethylene. 113) (a), orthorhombic perpendicular (O⊥) structure. 94) (b), Bravais unit cell and the coordinate system along the crystal axis
During TAG phase transition, especially in solid to liquid transition, their spectra change drastically. For a random chain (not a trans zigzag), every normal mode would become more or less active due to the breakdown of selection rules. 114) Band progressions also affect the spectral changes during solid-liquid phase transition. In going from solid to liquid, trans zigzag chains introduce some gauche conformations into them and they are segmented into some shorter trans chains with a variety of length. The progressions reflecting their chain length are developed and layered as a consequence in the broad band features of liquid phase. Mizushima and Shimanouchi suggested that all-trans zigzag chain shorter
than C16H34 are likely exist in liquid state of n-alkanes. 65) Long chain molecule acts as segments of trans zigzag chains in the liquid phase.
The introduction of gauche conformation has another effect. The spectrum of a all-trans chain, e.g.
polyethylene, distributes all its intensity to the in-phase bands (δ=0 or δ=π). For the liquid, however, the intensity distribution tends to be more even for all the modes in the progression. 100) The gauche conformations in the liquid affect the degree of coupling between adjoining oscillators which is determined by their relative orientation, and is reflected in the intensities of all the modes in the progression. 100) The progression bands which do not have intensities in all-trans conformation become apparent with some observable intensities in the liquid phase. Such‘density-of-states progression’explains the observed progression in liquid n-alkanes. 8)
It has not been explained explicitly; however, there is a general concept that a TAG spectrum is the superposition of that of each acyl-chain length structure (Fig. 19). This is probably based on the fact that the acyl chains are isolated by the glycerol moiety. It can be supposed that there is no vibrational coupling among the layers. This concept provides the basis for the vibrational spectroscopic studies on TAGs. Previous studies 64,125) have reveals acyl chain structures standing on this basis.
Experiment
Preparation of TAG samples
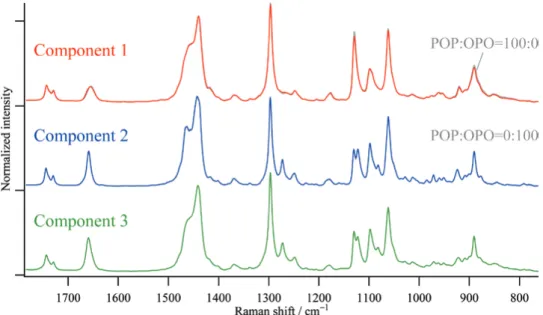
Three TAG species constituted of palmitic and oleic acyls were purchased from Sigma-Aldrich (St. Louis, MO, USA): tripalmitin (PPP, ≈ 99% purity), 1,3-dipalmitoy- 2-oleoyl-sn-glycerol (POP, ≈ 99%) and 1,3-dioleoyl-2- palmitoyl-sn-glycerol (OPO, ≈ 99%). Their liquid- and polymorphic-phases were prepared as follows;
Approximately 2-mg PPP sample was put on a cover glass and kept >70℃ to acquire liquid phase. It was cooled down to 45℃ and crystallized to α-polymorph, and then heated up to 50℃ to transform α-polymorph to β’-polymorph. 3 μL of POP and OPO melts were put on cover glasses and kept at 50℃ to maintain in liquid phase. They were rapidly cooled down to 4℃ to acquire α-polymorph, then incubated at 20℃ for 11 days to transform the POP and OPO samples to more stable Fig.18. Dispersion curve of crystal phase of polyethylene. 109,113)
δ is the phase difference between two adjacent units (-CH2-). Solid lines indicate the vibrations attributed to symmetric displacement of the adjacent-polyethylene chains; dashed lines indicate those of asymmetric
polymorphs.
In addition to the TAG samples, polyethylene sheet (50- μm thickness) produced by blown-extrusion method was acquired at a retail market.
Raman spectroscopic measurement
For PPP samples, Raman scattering was excited with the 785-nm line of a Ti-sapphire laser (Spectra Physics 3900S, Newport, Santa Clara, CA, USA). The back- scattered Raman light from the sample was collected by an objective lens (LUCPlanFLN20x, Olympus, Tokyo, Japan) and measured with a spectrometer (Chromex 250i, Bruker Optik GmbH, Ettlingen, Germany) and a CCD detector (400×1340 pixels, Spec-10 400BR(LM), Roper, Sarasota, Florida, USA). The laser power was 17 mW at the sample point and the exposure time was 30 s. Spectral resolution was ~3 cm-1.
For other samples, the 532-nm line of a Nd:YVO4
laser (Verdi, Coherent, Santa Clara, CA, USA) was used as the excitation source. The back-scattered Raman light was collected by above mentioned objective lens and measured with a spectrometer (Shamrock, Andor, Belfast) and an EMCCD detector (Newton, Andor). The laser power was 3 mW at the sample point. Four measurements with 300 s exposure time were accumulated. Spectral resolution was ~2 cm-1.
The integrated Raman intensities of almost all the polarization components were measured. During the
measurement, sample temperatures were controlled by a cryostat (Linkam 10021, Tadworth, Surrey, UK) in order to maintain desired phases.
Result ―Raman band assignments
The acquired Raman spectra were shown in Fig.
20. In this section, the assignments of bands observed in the TAG finger-print spectra will be described on the basis of the spectroscopic data of basic molecules such as polyethylene, paraffins, n-alkanes and fatty acids. They are summarized in Fig. 20 with comparison to a crystal polyethylene spectrum. As described in the introduction section, the bands observed in a TAG Raman spectrum are mostly related to those originating from polyethylene chain structures. For these bands, the notation of branch which the band belongs to ( νi ) has been added.
Region 1760-1720 cm-1
The bands observed in this region originate from ester C=O stretching modes. 68) These bands contain information regarding the geometry of the ester region of TAGs. 4,5,128) TAGs have three ester linkages (Fig. 1);
therefore, one can logically expect three vibrational bands in this region. Actually, the existence of three bands in the TAG liquid phase has been reported. 13)
The α-polymorph of TAGs does not show a clear feature with three bands. 1) This is likely to be due to its ambiguous configuration in the vicinity of the linkages.
Fig.19. The concept to understand the spectra of TAGs which have acyl-chain length subcell structure.
During the phase transition from α-polymorph to more stable phases, TAGs tend to configure‘h’conformer (see page 22) introducing a gauche configuration around C2-C3
bond in sn-3 acyl chain (Fig. 21). This change significantly affects in the frequency of the ester C=O stretching of the chain. From the previous studies, the band at
~1728 cm−1 corresponds this sn-3 C=O vibration, while the band at ~1743 cm-1 corresponds to sn-1 and -2 acyls’ C=O with trans C2-C3 configuration. 1,69) Using
these assignments, Sprunt et al. suggest the following approximate conformations for C2-C3 of three acyls of SOS in different polymorphic forms: β1, two trans, one gauche; β2 two trans, one gauche; β’, three gauche; γ, one trans, two gauche; α, three disordered.
Between these two bands, a week band ~1737 cm−1 is observed. 13) Bicknell-Brown et al. reported that ester C=O stretching frequency is sensitive to rotation about the C2-C1 bond in some phospholipids. 2) It is likely the Fig.20. Assignments for TAG Raman bands
reason for the existence of 1737 cm-1 band, and also for the band broadening of α-polymorph. On the other hand, da Silva and Rousseau speculated that the observation of three bands might be related to the presence of trace amounts of moisture in the samples that would interact with C=O bond of the esters, leading to a slightly altered conformation. 13)
Region 1680-1630 cm-1
The band due to C=C stretching is seen at
~1655 cm-1 in the Raman spectra of TAGs which contain unsaturated acyl chains (Fig. 20). The frequencies of this vibrational mode depend sensitively on its conformation.
The C=C bond existing in natural TAGs is normally in cis configuration. The conformation around cis C=
C bond determines the overall shape of acyl chains and
has a strong influence on the lateral packing and dynamic properties of the acyl chains, eventually affecting the overall TAG phase properties.
Kobayashi et al. 40) reported in a study of oleic acid that the bands at 1661, 1657 and 1642 cm-1 are associated with the olefinic skew-cis-skew’, skew-cis-trans, trans-cis- trans conformations, respectively (Fig. 22). Koyama and Ikeda reported that ~1657 cm-1 is observed in amorphous forms of fatty acid with a cis olefin group. 47)
Additionally, a weak band at around 1633 cm-1 is observed (Fig. 20). This band can be found in some previous reports on TAGs, but the assignment of this band seems to be uncertain. This band is likely to be a mode other than –CH2– ones, since the vibrational modes from polyethylene moiety do not appear in this frequency region (Fig. 18). There are some possible origins of this band. Firstly, the carboxyl C=O stretching mode of impurities, such as diacylglycerols, monoacylglycerols and fatty acids, seems to be explainable. The purity of the commercially available TAG samples is less than 99%, >1% of impurities are therefore contained. Second, the C=C configuration other than shown in Fig. 22 is probably related. It has been reported that skew-cis-skew configuration exists in some fatty acids containing cis C=C bond. 85) The third possibility is the stabilization of π orbital of C=C bonds. In the spectra of TAGs having conjugated C=C bonds show such a low frequency band 107) because of the stabilization by π-π resonances.
However, the TAGs shown in Fig. 20 do not have any C
=C conjugation. Speculatively, it can be related to the intermolecular π-π stacking interaction because this band becomes clearer in the solid phase where the π-π stacking is expected to occur. Further investigation is needed for the conclusive assignment.
Fig.22. The configurations around cis C=C, overall shape of the oleic acid and their frequencies of Raman bands 40) Fig.21. Molecular packing in the vicinity of the glycerol
backbone in the β phase of TAGs 1,31,51)
Region 1440 cm-1
Interpretation of this CH2 scissors mode region ( ν2 ) is complex for two main reasons. First, interactions between the vibrational modes whose symmetries are the same lead to Fermi resonances (Fig. 23a). 102) The Fermi resonances arise between the Raman active fundamental, ν2(δ=0) and the overtone of ν8(δ=π), and results in a doubling of the band in this region.
The second reason is that these modes are involved in strong inter-chain interactions within crystals. 102,113) For example the orthorhombic perpendicular structure (O⊥) of polyethylene crystal, 113) which is the only case studied in any detail, the separation of the dispersion curve into a- and b-axis polarized components should be taken into account (Fig. 23b, also see page 31). In the Raman spectra of polyethylene, the band splitting originating from this polarization difference is observed only for ν2(δ=0) because the value of splitting for this mode is relatively large compared with other modes (Fig. 18). 113) The splitting of these two components is about 35 cm-1 at δ=0 (Fig. 23b). As the result, the band ~1417 cm-1 is
prominent in polyethylene O⊥ crystals (Fig. 20a).
In TAGs, the band around 1460-1470 cm-1 shifts higher frequency region as the phase transforms into more stable one, i.e. liquid → α → β’→ β (Fig. 20). It is likely due to the increase in inter-chain interaction which affects not only the frequency of ν2(δ=0) but also the one of ν8(δ=π). The frequency interval between ν2(δ=0) and the overtone of ν8(δ=π) reflects in the degree of Fermi resonance interaction.
The band splitting due to the crystal-field effect is distinctive at ~1417 cm-1 in β’-polymorph which has O⊥ subcell structure (Fig. 20d). 38) It is, however, much weaker than that observed in polyethylene O⊥ crystal (Fig.
20a). These are some possible reasons; namely crystal defects and imperfect perpendicular arrangements. In β’-polymorph of POP, the incomplete perpendicular arrangement occurs because their palmitoyl (extended) and oleoyl (bent) chains are packed in the same acyl- chain-length structure. 128) In the TAG β-polymorph having the T// subcell, in which polyethylene chains are parallel to each other, this band splitting is not apparent. 127)
Fig.23. The CH2 scissors mode frequencies dispersed in the perpendicular direction, plotted as a function of δ. 102) δ is the phase difference between two adjacent units -CH2-. (a), the mode of extended isolated polyethylene chain. The doubling of Raman bands due to the Fermi resonance between ν2 (δ=0) and the overtone of ν8 (δ=π); (b), the modes of polyethylene orthorhombic crystals which are involved in strong intermolecular interactions.
In the melt and α-polymorph, the splitting can be detected although it is very weak. It may indicate that the acyl-chain planes are arranged not in the totally random way but in somehow biased one. To investigate the structure in TAG melt, it will be interesting to compare the strength of the band splitting between TAG melt and TAG molecules in solution where TAG acyl chains are arranged in the completely random distribution.
Region 1370-1180 cm-1
The CH2 wagging fundamental, ν3(δ=π), is prominent in this region. In the polyethylene crystal, this band appears at 1370 cm-1 (Fig. 20a). It originates from all- trans conformation of the extended chains.
In the TAG spectra, this band becomes broader as the chains become more and more conformationally disordered, i.e. β → β’→α→ liquid (Fig. 20). However, the band intensity does not change much, in contrast to some other bands, e.g. 1180 cm-1 (see page 37) and
~1130 cm-1 (see page 38). Generally, band intensities may undergo drastic changes in going from a trans to a gauche bond. This intensity constancy is probably due to the orientation of the local polarizability derivative in the disordered chain. Cates, Strauss and Snyder (1994) reported that this band in liquid n-alkanes was assigned to the gauche-trans-gauche’configuration (Fig. 24). 8) This sequence has a local center of symmetry that allows this mode to appear in the Raman spectra. Therefore, the conformational change does not change the intensity very much.
The ν3 mode shows its progressions in the region of 1370-1180 cm-1. 95) They sensitively reflect the length and parity (odd/even) of the trans chain. The band observed at 1340 cm-1 in TAG β’- and β-polymorphs
may be one of the progression bands (Fig. 20). This ν3
progression bands are also appeared in infrared spectra, and Yano et al. used these bands as the reference to analyze the trans chain length of the acyls of TAGs. 126,127)
It should be noted that another type of ν3 progressions has been reported in a study on n-alkanes. 8) These progressions can be observed also in the liquid phase.
It is suggested that their origin lies in the density of vibrational states. For the liquid, the intensity distribution tends to be more even. The progression bands are much broader than those of the ordered chain and usually appear superimposed on a continuous background in the region 1370-1180 cm-1. 8)
Region 1300-1180 cm-1
The strong band at ~1300 cm-1 is the CH2 twisting mode, ν7(δ=π). The most stable polymorph, β, shows a sharp band at 1296 cm-1. On the other hand, liquid phase of TAGs give a strong but relatively broad band around 1305 cm-1. Substantial conformational disorder in the liquid phase increases the frequency to around 1305 cm-1. 122,129) The band observed in α or β’polymorphs is likely to be the superposition of these two bands.
At around 1170 cm-1, the zone-center mode of the other side of ν7 branch, ν7(δ=0), appears in polyethylene crystal (Fig. 20a). This is the CH2 rocking mode. In TAG spectra, this band appears ~1180 cm-1. As shown in Fig.
20, this band intensity reflects the conformational disorder in crystals. The β’- and β-polymorphs have higher intensity of this band compare to α-polymorphs. In the liquid phase, this band smears out. It is known that the infrared rocking mode frequency of a CD2 group substituted in a polyethylene chain is sensitive to trans-gauche rotational isomerization of the chain. 58) This sensitivity forms the basis of a commonly used infrared method for determining site-specific conformation in polyethylene systems, and applied to some model biological systems to investigate their conformational disorder. 60,61) Unlike these CD2 rocking bands, the Raman CH2 rocking band is not independent of other polyethylene bands; however, it is likely that this is a possible Raman probe for the degree of TAG crystal disorder.
In-between the two bands described above, ν7
progression bands (0≠δ≠π, CH2 twisting-rocking modes) Fig.24. Gauche-trans-gauche’conformation observed in liquid
phase
appear in 1300-1180 cm-1. The band at ~1250 cm-1 is probably one of these bands because it broadens out in synchronization with 1180 cm-1 (ν7(δ=0)) (Fig. 20). The band observed at 1275 cm-1 (Fig. 20e) has been assigned to the same origin; 106) however, it is more likely to have a different origin because this band does not appear in the spectra of β’-polymorph which show 1180 and 1250 cm-1 bands. The assignment of this 1275 cm-1 band is described in the next section. There are several other bands with relatively small intensity in this region. They can be assigned with high possibility to the ν7 progression bands or the ν3 progressions which overlap in this region.
Region 1280-1260 cm-1
A broad band ~1265 cm-1 appears in the liquid phase of TAGs containing unsaturated acyl chains (Fig.
20b). The intensity of this band increase when the number of olefinic group increases. The origin of this band is the olefinic =CH in-plane deformation. 47) In the TAG crystals whose olefinic group are stacked (Fig. 25a), this band becomes narrower. From the study of fatty acid with cis olefinic group, this band is most intense for the skew-cis-skew’conformation of the -C=C- bond (Fig.
25b). 47) The observed bands in OPO β-polymorph could then be indicative of the skew-cis-skew’conformation. On the other hand, the β’-polymorph of POP does not show any distinctive band in this region. This observation supports the FT-IR study of Yano et al. (1993) where they reported the -C=C- conformation in β’-polymorph of POP should be deformed from skew-cis-skew’. 128)
Region 1140-1050 cm-1
The bands derived from ν4 branch, the C-C skeletal stretching modes are observed in this region. 112) They are one of the most important bands in the Raman spectroscopic study of polyethylene chain structure. Since the chain backbone is directly involved in these vibrations, substantial spectral changes are expected whenever the conformation of the backbone changes. Their band features are applied to investigate the conformational order of lipid bilayer 56,76,122) and TAGs 13,46,54,55,77).
In the Raman spectrum of polyethylene crystal where almost every C-C bond is in trans configuration, two sharp and strong bands are observed at 1130 and 1061 cm-1 in this region (Fig. 20a). They are the C-C symmetric stretching (ν4(δ=0)) and the anti-symmetric stretching (ν4(δ=π)) modes, respectively (Fig. 16). These two bands are prominent in the spectra of TAG solid phases (Fig. 20c, d and e) and indicating that they contain trans zigzag chains.
Between these two prominent bands, some sharp bands can be observed in TAG polymorphs. These bands have been assigned to the ν4(δ≈0) of trans zigzag chain. 40) The frequency of the band is affected by the chain length and chain boundary condition. A fundamental study was conducted by Kobayashi et al. using a number of mono-unsaturated fatty acids crystals. 40) The backbone of these mono-unsaturated fatty acids are separated into two trans C-C chains by the C=C bond, one being the methyl-side chain and the other the carboxyl-side chain (Fig. 26). These two chains are different in their boundary
Fig.25. Structures around C=C bonds observed in TAG crystals. (a), Crystal structure of β-polymorph of OSO. 44) C=C bonds are stacked. (b), skew-cis-skew’
conformation.
Fig.26. Crystal structure of oleic acid. 33) Yellow-shaded region indicate the parts where the intermolecular interaction is relatively strong.
condition. For methyl-side chain, one end is free and the other is fixed by inter-molecular interactions at C=C bond (Free-Fixed chain), whereas for the carboxyl-sided chain both ends are fixed because dimerization of the carboxyl groups (Fixed-Fixed chain).
Kobayashi et al. used the approximation of the simple coupled oscillators model for the chains with different carbon number (n), which for these two types of chain boundary conditions gives the following allowed phase angles (δ) :
δk=(2k-1)π/2(n-1) (for Free-Fixed chain) — eq.1 δk=kπ/(n-1) (for Fixed-Fixed) — eq.2 where k=1, 2, . . . , n-1
As with polyethylene, the smallest k value (k=1, δ≈0) corresponds to the C-C symmetric stretching vibration and the largest (k=n-1, δ≈0) to the anti-symmetric stretching. Based on the above consideration, they have fitted experimental data of the mono-unsaturated fatty acids using the dispersion curve of the all-trans polyethylene ν4 mode, leading to the assignment of Raman bands of oleic acid at 1125 and 1095 cm-1 to the C-C symmetric stretching mode of the methyl-side (n=9, Free-Fixed) and carboxyl-side chains (n=9, Fixed-Fixed) respectively (Fig. 27). 40)
It is shown that this assignment is maintained in a TAG, SOS. 106) The structural arrangement in the oleoyl
chains of SOS may be seen as similar to the above, since in SOS the fixed-fixed part of the chain will be between the C=C bond and the polar ester groups of the glycerol backbone where intermolecular attraction is relatively strong. The free end of the free-fixed chain will be at the non-polar bilayer interface region.
In the spectrum of β-polymorph of OPO, there is an extra band at 1080 cm-1 in addition to the above mentioned 1125 and 1095 cm-1 bands (Fig. 20). This probably originates from the glycerol-side trans chain of sn-3 acyl of OPO which is the Fixed-Fixed chain with n=7 (Fig. 28). In TAG β-polymorph, it is known that the sn-3 chain is bent in the vicinity of glycerol (Fig. 21). As a consequence, that trans chain has a chain length shorter by two, compare to that of sn-1 (Fig. 28). Following eq.2, the k=1 mode of Fixed-Fixed chain with n=7 should have δ=30°, and likely to have a frequency around 1080 cm-1 (Fig. 27).
In the spectrum of solid phase of PPP, a band exists
~1100 cm-1 (Fig. 20c and d). This band origin must be a different from k=1 mode. PPP does not have any C=
C bond; therefore, it contains only long trans chains. For larger n, the value of δ for k=1 becomes smaller near to 0 (eq. 1). Such small δ does not explain the frequency of
~1100 cm-1. Vogel and Jahnig assigned this band to a ν4 progression mode with k=3 of trans C-C chain. 122) PPP contain n=16, Free-Fixed trans chains. The δ of k=
3 mode for the chain can be calculated from eq. 1, and it is
Fig.27. Frequencies of C-C stretching modes for mono- unsaturated fatty acids. 40) ○, oleic acid; □, palmitic acid; △, petroselinic acid, and ●, erucic acid.
Fig.28. Structure of OPO β-polymorph with indicating each trans chain length and its boundary condition
30°. This δ value is reasonable to explain this band origin.
The Raman spectra of TAG liquid phase show a characteristic broad band at ~1080 cm-1 (Fig. 20b). This is related to the increased number of gauche configuration in the liquid; 13,26,27) however, this band is not directly attributable to gauche bond stretching. 98) The broad band shape is probably due to the trans chain segmentation and the density-of-states progressions induced by the increased gauche configurations (see also page 32).
Region 980-960 cm-1
The band due to cis=C-H out-of-plane deformation 56) is seen at ~970 cm-1 in the Raman spectra of liquid TAGs containing unsaturated acyl chains (Fig. 20b).
In the spectra of TAG β’- and β-polymorphs, a series of small bands can be observed. These are likely to be ν8
progression bands. 95) In crystals, the ν8 branch splits into two components which are polarized along crystal a- and b-axis (Fig. 18). Therefore, each of the progression bands tend to split into two components in the crystals.
Region 930-700 cm-1
The bands observed in 900-875 cm-1 region originate from the CH3 terminal rocking mode of hydrocarbon chains. 86) This mode is consist of several vibrational modes, principally of in-plane methyl rocking, Cω-1 -Cω (the bond between the terminal methyl C atom and the next C) stretching, and CCC deformation which is localized in the end of chains. For a chain longer than about ten carbon atoms, their in-phase and out-of- phase frequencies differ by only a few cm-1 (Fig. 29).
For a chain shorter than ten, these vibrations which are essentially degenerate in long chains, interact and lead to separated bands as shown in Fig. 29.
The bands observed in OPO β-polymorph spectrum in this region (Fig. 20), i.e. 909, 900, 890 and 877 cm-1, are satisfactorily explained by Fig. 29. However, less stable polymorphs show other bands whose frequencies differ from those in Fig. 29. These bands can be explained by the acyl chain packing imperfections at the crystal layer surface (Fig. 30). 130) TAGs need not always consisting of the set of acyl chains with the best packing compatibility;
therefore, it is likely to have some surplus part as shown in Fig. 30. These surplus parts tend to introduce gauche rotational configuration, and this change influences on the CH3 rocking frequency. The gauche-trans configuration from the methyl ends (gt-) results in the frequency of
Fig.29. The frequencies of the in-plane methyl rocking mode of n-alkanes 86)
Fig.30. Depiction of the chain packing imperfection at the crystal layer surface. 130) t, trans; g, gauche.