JHOSPITALIST network
「
積極的
に
生活習慣
へ
介入すると体重は減るか
」
Eight-‐year weight losses with an intensive lifestyle interven3on: the look AHEAD study
2015
年年4⽉月16⽇日
担当者 ⽔水⼾戸協同病院
総合診療療科/代謝内分泌泌・糖尿尿病内科
五⼗十野桃⼦子
責任者 五⼗十野博基
1症例例
2
18歳男性
十二指腸潰瘍で入院となった際に、
BMI:33 (身長
174cm, 体重100kg)の高度肥満、肝機能障害、脂質異
常症、糖尿病が指摘された。二次性肥満のスクリーニ
ングは陰性であり、単純性肥満およびメタボリックシン
ドロームとして外来フォロー中である。
出生
2940g、乳児健診では異常指摘なし、小学校3年
生ごろから体重増加があり、小学校
5年で小児肥満を
指摘されて通院歴あり。中学生で
100kgを超え、最大
106kg。高校を卒業した後も体重減量は出来ず、現在
に至る。
‣疑問
通常の外来診療では、栄養指導を定期的に入れ、認知
行動的介入を意識して運動療法を勧めるが、たかだか
月1回のフォローである。
長期継続するためには、どんな減量方法が効果的で、継
続可能なのだろうか?
食事療法、運動療法だけでいいのか。
3
EBM
の実践
5 steps
Step1 疑問の定式化(PICO)
Step2 論文の検索
Step3 論文の批判的吟味
Step4 症例への適用
Step 1疑問の定式化(PICO)
P:
肥満の2型糖尿尿病患者
I:
総合的な⽣生活習慣改善への介⼊入
C:
⾷食事・運動療療法
O:
減量量
クリニカルクエスチョンは「治療療」に該当。
5Step 2論論⽂文の検索索
1次研究(primary studies)を利利⽤用した
‣PubMed
“type 2 Diabetes, Obese”[Mesh] AND
“lifestyle intervenKon”[Mesh] AND
“clinical trial”
Results: 1 to 20 of 249
Results: 1 to 20 of 668
6 21. 22. 23. 24. 25. 26. 27. Results: 21 to 40 of 252
Prevention of gestational diabetes through lifestyle intervention: study design and methods of a Finnish randomized controlled multicenter trial (RADIEL).
Rönö K, Stach-Lempinen B, Klemetti MM, Kaaja RJ, Pöyhönen-Alho M, Eriksson JG, Koivusalo SB; RADIEL group.
BMC Pregnancy Childbirth. 2014 Feb 14;14:70. doi: 10.1186/1471-2393-14-70.
PMID: 24524674 [PubMed - indexed for MEDLINE] Free PMC Article
Adverse responses and physical activity: secondary analysis of the PREPARE trial.
Yates T, Davies MJ, Edwardson C, Bodicoat DH, Biddle SJ, Khunti K.
Med Sci Sports Exerc. 2014 Aug;46(8):1617-23. doi: 10.1249/MSS.0000000000000260.
PMID: 24500536 [PubMed - indexed for MEDLINE]
The results of Look AHEAD do not row against the implementation of lifestyle changes in patients with type
2 diabetes.
Annuzzi G, Rivellese AA, Bozzetto L, Riccardi G.
Nutr Metab Cardiovasc Dis. 2014 Jan;24(1):4-9. doi: 10.1016/j.numecd.2013.12.001. Epub 2013 Dec 20.
PMID: 24388434 [PubMed - indexed for MEDLINE]
Prevention of type 2 diabetes mellitus: is it feasible?
Palermo A, Maggi D, Maurizi AR, Pozzilli P, Buzzetti R.
Diabetes Metab Res Rev. 2014 Mar;30 Suppl 1:4-12. doi: 10.1002/dmrr.2513. Review.
PMID: 24353270 [PubMed - indexed for MEDLINE]
Eight-year weight losses with an intensive lifestyle intervention: the look AHEAD study.
Look AHEAD Research Group.
Obesity (Silver Spring). 2014 Jan;22(1):5-13. doi: 10.1002/oby.20662.
PMID: 24307184 [PubMed - indexed for MEDLINE] Free PMC Article
The resist diabetes trial: Rationale, design, and methods of a hybrid efficacy/effectiveness intervention trial for resistance training maintenance to improve glucose homeostasis in older prediabetic adults.
Marinik EL, Kelleher S, Savla J, Winett RA, Davy BM.
Contemp Clin Trials. 2014 Jan;37(1):19-32. doi: 10.1016/j.cct.2013.11.006. Epub 2013 Nov 16.
PMID: 24252311 [PubMed - indexed for MEDLINE] Free PMC Article
Rationale, design, and baseline characteristics of a community-based comparative effectiveness trial to prevent type 2 diabetes in economically disadvantaged adults: the RAPID Study.
Ackermann RT, Finch EA, Schmidt KK, Hoen HM, Hays LM, Marrero DG, Saha C.
Contemp Clin Trials. 2014 Jan;37(1):1-9. doi: 10.1016/j.cct.2013.10.003. Epub 2013 Oct 29.
PMID: 24177413 [PubMed - indexed for MEDLINE]
Summary 20 per page Sorted by Recently Added
PMID:24307184
Eight-Year Weight Losses with an Intensive Lifestyle Intervention: The Look AHEAD Study
The Look AHEAD Research Group
Objective: To evaluate 8-year weight losses achieved with intensive lifestyle intervention (ILI) in the Look AHEAD (Action for Health in Diabetes) study.
Design and Methods: Look AHEAD assessed the effects of intentional weight loss on cardiovascular morbidity and mortality in 5,145 overweight/obese adults with type 2 diabetes, randomly assigned to ILI or usual care (i.e., diabetes support and education [DSE]). The ILI provided comprehensive behavioral weight loss counseling over 8 years; DSE participants received periodic group education only.
Results: All participants had the opportunity to complete 8 years of intervention before Look AHEAD was halted in September 2012; !88% of both groups completed the 8-year outcomes assessment. ILI and DSE participants lost (mean 6 SE) 4.7% 6 0.2% and 2.1 6 0.2% of initial weight, respectively (P < 0.001) at year 8; 50.3% and 35.7%, respectively, lost !5% (P < 0.001), and 26.9% and 17.2%, respec-tively, lost !10% (P < 0.001). Across the 8 years ILI participants, compared with DSE, reported greater practice of several key weight-control behaviors. These behaviors also distinguished ILI participants who lost !10% and kept it off from those who lost but regained.
Conclusions: Look AHEAD’s ILI produced clinically meaningful weight loss (!5%) at year 8 in 50% of patients with type 2 diabetes and can be used to manage other obesity-related co-morbid conditions.
Obesity(2014) 22, 5–13. doi:10.1002/oby.20662
Introduction
The Look AHEAD (Action for Health in Diabetes) study was designed to assess the effects of an intensive lifestyle intervention (ILI) on clinically important health outcomes in overweight/obese individuals with type 2 diabetes (1). The trial’s primary outcome was cardiovascular morbidity and mortality, on which no significant dif-ferences were observed between participants assigned to ILI or a
usual care group (i.e., diabetes support and education [DSE]) after a mean follow-up of 9.6 years (2). Investigators currently are examining changes in secondary outcomes in Look AHEAD including mood (3), quality of life (4), sleep apnea (5), and physical function (6), all of which were improved by the ILI during the trial’s initial years. Look AHEAD provides the largest and longest randomized evalua-tion to date of an ILI for weight reducevalua-tion. The trial offers
Department of Psychiatry, Center for Weight and Eating Disorders; University of Pennsylvania Perelman School of Medicine; 3535 Market St, Suite 3029; Philadelphia, PA 19104. Correspondence: Thomas A. Wadden ([email protected])
A list of study authors is shown in the appendix. Clinical sites and personnel are shown in the online version of the article. Trial Registration: clinicaltrials.gov Identifier: NCT00017953
Funding agencies: Department of Health and Human Services through the following cooperative agreements from the National Institutes of Health: DK57136, DK57149, DK56990, DK57177, DK57171, DK57151, DK57182, DK57131, DK57002, DK57078, DK57154, DK57178, DK57219, DK57008, DK57135, and DK56992. The following federal agencies have contributed support: National Institute of Diabetes and Digestive and Kidney Diseases; National Heart, Lung, and Blood Institute; National Institute of Nursing Research; National Center on Minority Health and Health Disparities; NIH Office of Research on Women’s Health; and the Centers for Disease Control and Prevention. This research was supported in part by the Intramural Research Program of the National Institute of Diabetes and Digestive and Kidney Diseases. The Indian Health Service (I.H.S.) provided personnel, medical oversight, and use of facilities. The opinions expressed in this paper are those of the authors and do not necessarily reflect the views of the I.H.S. or other funding sources. Additional support was received from The Johns Hopkins Medical Institutions Bayview General Clinical Research Center (M01RR02719); the Massachusetts General Hospital Mallinckrodt General Clinical Research Center and the Massachusetts Institute of Technology General Clinical Research Center (M01RR01066); the University of Colorado Health Sciences Center General Clinical Research Center (M01RR00051) and Clinical Nutrition Research Unit (P30 DK48520); the University of Tennessee at Memphis General Clinical Research Center (M01RR0021140); the University of Pittsburgh General Clinical Research Center (GCRC) (M01RR000056), the Clinical Translational Research Center (CTRC) funded by the Clinical & Translational Science Award (UL1 RR 024153) and NIH grant (DK 046204); the VA Puget Sound Health Care System Medical Research Service, Department of Veterans Affairs; and the Frederic C. Bartter General Clinical Research Center (M01RR01346). Some of the information contained herein was derived from data provided by the Bureau of Vital Statistics, New York City Department of Health and Mental Hygiene.
Disclosure: Author disclosures are provided in Supplementary Online Appendix II.
Author Contributions: Study concept and design: All authors. Acquisition of data: All authors. Analysis and interpretation of data: MPW, TAW, ESH JMJ, WCK, FXP, DSW, RRW, and SZY. Drafting of the manuscript: TAW, ESH, JMJ, WCK, FXP, MPW, DSW, RRW, and SZY. Critical revision of the manuscript for important intellectual content: All authors. Statistical analysis: MPW.
Additional Supporting Information may be found in the online version of this article.
Received: 28 October 2013; Accepted: 30 October 2013; Published online 7 January 2014. doi:10.1002/oby.20662
www.obesityjournal.org Obesity|VOLUME 22 | NUMBER 1 | JANUARY 2014 5 Original Article
CLINICAL TRIALS: BEHAVIOR, PHARMACOTHERAPY, DEVICES, SURGERY
Obesity
7
PICO
米国
16の多施設, RCT, ITT
P
2
型糖尿尿病、45-‐76歳、
BMI
≧25(インスリン使⽤用者はBMI≧27)
I Intensive Lifestyle Interven3on(ILI)
C
通常の指導
Diabetes support and educa3on(DSE)
‣論論⽂文の背景:減量量⽬目標
2型DMの予防や改善、
血圧や脂質の減少、
非アルコール性肝疾患の改善、
失禁や性的機能低下の改善などのために、
5%以上の体重を減量し
、
維持
することが
有効とされている。
9 Jensen MD, et al.
2013 AHA/ACC/TOS Obesity Guideline
1
2013 AHA/ACC/TOS Guideline for the Management of Overweight and Obesity in Adults
A Report of the American College of Cardiology/American Heart Association Task Force on Practice Guidelines and The Obesity Society
Endorsed by the American Association of Cardiovascular and Pulmonary Rehabilitation, American Pharmacists Association, American Society for Nutrition, American Society for Preventive Cardiology,
American Society of Hypertension, Association of Black Cardiologists, National Lipid Association, Preventive Cardiovascular Nurses Association, The Endocrine Society, and WomenHeart: The National
Coalition for Women with Heart Disease
EXPERT PANEL MEMBERS
Michael D. Jensen, MD, Co-Chair Donna H. Ryan, MD, Co-Chair
Caroline M. Apovian, MD, FACP Catherine M. Loria, PhD, FAHA* Jamy D. Ard, MD Barbara E. Millen, DrPH, RD Anthony G. Comuzzie, PhD Cathy A. Nonas, MS, RD Karen A. Donato, SM* F. Xavier Pi-Sunyer, MD, MPH Frank B. Hu, MD, PhD, FAHA June Stevens, PhD
Van S. Hubbard, MD, PhD* Victor J. Stevens, PhD John M. Jakicic, PhD Thomas A. Wadden, PhD Robert F. Kushner, MD Bruce M. Wolfe, MD
Susan Z. Yanovski, MD* Methodology Members Harmon S. Jordan, ScD Karima A. Kendall, PhD Linda J. Lux Roycelynn Mentor-Marcel, PhD, MPH Laura C. Morgan, MA Michael G. Trisolini, PhD, MBA
Janusz Wnek, PhD
ACCF/AHA TASK FORCE MEMBERS
Jeffrey L. Anderson, MD, FACC, FAHA, Chair Jonathan L. Halperin, MD, FACC, FAHA, Chair-Elect
Nancy M. Albert, PhD, CCNS, CCRN, FAHA Judith S. Hochman, MD, FACC, FAHA Biykem Bozkurt, MD, PhD, FACC, FAHA Richard J. Kovacs, MD, FACC, FAHA Ralph G. Brindis, MD, MPH, MACC E. Magnus Ohman, MD, FACC
Lesley H. Curtis, PhD, FAHA Susan J. Pressler, PhD, RN, FAAN, FAHA
David DeMets, PhD Frank W. Sellke, MD, FACC, FAHA
Robert A. Guyton, MD, FACC Win-Kuang Shen, MD, FACC, FAHA
Subcommittee on Prevention Guidelines
Sidney C. Smith, Jr, MD, FACC, FAHA, Chair Gordon F. Tomaselli, MD, FACC, FAHA, Co-Chair
*Ex-Officio Members.
at University of Tsukuba on March 24, 2015
http://circ.ahajournals.org/
Downloaded from
Obesity and female stress urinary incon3nence; urology 2013 oct, 759-‐763 Effect of intensive lifestyle interven3on on sexual dysfunc3on in women with type 2 Diabetes; Diabetes Care 36:2937-‐2944, 2013
‣論論⽂文の背景
現状では
、
食事療法の種類で差はない
減量法
:どんな食事でもアドヒアランスが得られれば、
摂取カロリーを消費より減少させ、体重は減少する。
48個のRCT:
食事プログラムは、低炭水化物食、中等度主要栄養素食、低脂
肪食など
減量に、食事療法による差はなし
食事療法なしと比較して、有意に減量
(6ヶ月で6-‐8kg)12ヶ月時点
では
6ヶ月と比較して平均1-‐2kg更に減量
PICO
多施設、
RCT、ITT
P
耐糖能異異常を伴う肥満患者(平均BMI34)3234名
I ①メトフォルミン850mg 1日2回
②最低7%の体重減少と週150分の運動習慣を目標と
した行動変容プログラム
C プラセボ
O 糖尿病発症
11平均フォローアップ期間
2.8年で
DM発症率は、プラセボ11.0%、薬剤7.8%、プログラ
ム
4.8%
と有意に減少
体重減少は、
-‐0.1、-‐2.1、
-‐5.6kg
N Engl J Med. 2002;346(6):393.論文の背景:
DPP
(
Diabetes Preven3on Program)が包括的
な肥満への介入として有名。期間が
2.8年と短い。
‣論論⽂文の背景
Look AHEAD study
とは
•
The Look AHEAD(Ac3on for Health in Diabetes) study
の
Primary outcomeは心血管有病率と死亡率であった
が、結果は
ILIと通常のケアで有意差は得られなかっ
た(平均フォローアップ
9.6年)。
• しかし二次解析では、ILI群で1年目に気分やquality of
life、睡眠時無呼吸、身体機能などに改善があったと
している。
•
Look AHEADはILIの体重減少に対する効果について、
最も規模が大きく、期間の長い
RCTである。
‣Inclusion criteria
•
2型糖尿病
•
45-‐76歳、
•
BMI≧25(インスリン使用者であれば
27≦BMI)
• 運動負荷テストとアドヒアランステストをクリ
アしている
13‣Exclusion criteria
•
年年齢が基準外
•
糖尿尿病ではない
• 1
型糖尿尿病に近い
•
スタッフが適さないと判断した
•
⾼高⾎血圧
•
ランニングの習慣がある
‣介⼊入 IntervenKon:
Intensive Lifestyle IntervenKon(ILI)
Year 1
:1-‐6ヶ⽉月 グループセッション(60-‐75分)を3週間
➡個別カウンセリング(20-‐30分)を4週⽬目
1200-‐1800Kcal/day(BMI
別に設定),
脂肪摂取30%以下,蛋⽩白摂取15%以上
1-‐4
ヶ⽉月 2⾷食+1栄養⾷食品(液体シェイク+スティック栄養剤)
5-‐12
ヶ⽉月 1⾷食+1栄養⾷食品
175
分/週以上の中等度度運動➡200分/週まで増やす
⾷食事内容、活動量量、その他の⾏行行動について⽇日記をつける
15要約:ILIの特徴は、より短いintervalで⾷食事と運動指導が⼊入り、
認知⾏行行動療療法の介⼊入がある。
‣介⼊入 IntervenKon:
Intensive Lifestyle IntervenKon(ILI)
Year2-‐8
:個別に⽣生活指導
毎⽉月個別に20-‐30分のカウンセリング➡2週間後に電話やe-‐mail
⾷食事のカロリーは個別に設定
1
⾷食+1栄養⾷食品
200
分/週以上の運動
週1回以上の体重測定
⽉月1回グループミーティング
カウンセリングには管理理栄養⼠士、⼼心理理学者、運動のスペシャリ
スト
‣⽐比較 Comparison
:Diabetes support and educaKon(DSE)
Year1-‐4
:年年1回1時間のグループミーティ
ングを3つ(⾷食事、運動、社会的サポー
ト)
Year5-‐8
:年年1回ミーティング
更更なる介⼊入の希望があれば、かかりつけ
医に⾃自由に問いあわせることができる。
17Outcome
:Primary Endpoints
体重変化
(
The Look AHEAD studyのそもそものPrimary
outcomeは心血管有病率と死亡率)
‣倫倫理理的配慮
全ての患者はconsent formにより承諾諾を得た。
治療療に関する論論⽂文のユーザーズガイド
①結果は妥当か
介⼊入群と対照群は同じ予後で開始したか
患者はランダム割り付けされていたか
ランダム化割り付けは隠蔽化(concealment)されていたか
既知の予後因⼦子は群間で似ていたか=base lineは同等か
研究の進⾏行行とともに
、
予後のバランスは維持されたか
研究はどの程度度盲検化されていたか(⼀一重〜~四重盲検)
研究完了了時点で両群は
、
予後のバランスがとれていたか
追跡は完了了しているか=追跡率率率・脱落落率率率はどうか
患者はIntention to treat解析されたか
試験は早期中⽌止されたか
介入群と対照群は同じ予後で開始
したか
患者はランダム割り付けされていた
か
invaluable information about the feasibility of inducing and main-taining clinically significant weight loss, defined as a !5% reduc-tion in initial body weight (7-10). Weight loss of this size confers additional health benefits beyond those described above. These include prevention and resolution of type 2 diabetes (11,12), reduc-tion in blood pressure and lipids (13,14), ameliorareduc-tion of non-alcoholic fatty liver disease (15), and improvements in urinary incontinence and sexual dysfunction (16,17).
The present report provides a detailed analysis of changes in body weight in ILI and DSE participants over the first 8 years of the intervention, which all participants had the opportunity to complete before the trial was halted. ILI participants were provided frequent treatment visits the first year to induce weight loss, followed by a comprehensive weight loss maintenance program in years 2-8 (18). Our primary hypotheses were that the ILI group, as compared with DSE, would achieve significantly greater mean weight losses at all years and be more successful in achieving reductions !5% and !10% of initial weight. Consistent with these hypotheses, we pre-dicted that ILI participants, compared with DSE, would report greater practice of numerous weight control behaviors (e.g., reducing energy intake, increasing physical activity) recommended by the intervention. The study’s large sample size (N 5 5,145) allowed us to examine the effect on 8-year weight loss of age, gender, and race/ethnicity, as evaluated previously for years 1 and 4 (19). The large sample also allowed us to examine, within the ILI group, the percentage of participants that lost !10% of initial weight the first year and sustained the loss at year 8. Behavioral characteristics of these weight-loss maintainers were compared with those of partici-pants who initially lost !10% but regained it.
Methods
Participants
A total of 5,145 men and women were enrolled in Look AHEAD at 16 centers throughout the United States (1,2). Eligible individuals had type 2 diabetes, were 45-76 years of age, and had a body mass index (BMI) !25 kg/m2 (or !27 kg/m2 if taking insulin). Additional eligibility criteria have been reported and included applicants’ com-pleting a graded exercise test and a test of behavioral adherence (1,2). Those who remained eligible were randomly assigned, with equal probability, to ILI or DSE. All participants signed a consent form approved by their center’s institutional review board.
Interventions
The ILI and DSE interventions have been described previously and are only briefly summarized here (18,20). Participants in both groups received all usual medical care from their own primary care providers.
ILI.
In year 1, ILI participants received a comprehensive lifestyle intervention designed to induce an average, study-wide loss !7% of initial weight (with an individual goal of losing !10%) (1,19). The intervention was adapted from the Diabetes Prevention Program (DPP) (11,21) and delivered to groups of approximately 10-20 per-sons by experienced interventionists. In months 1-6, participants attended group sessions (of 60-75 minutes) for the first 3 weeks of each month; the fourth week, they met individually with their inter-ventionist (for 20-30 minutes), and group sessions were not held. In months 7-12, they continued to have a monthly individual meeting, but group sessions were reduced to two per month. Participantswere prescribed 1,200-1,800 kcal/day (depending on initial body weight) with "30% of calories from fat (<10% from saturated fat) and !15% of calories from protein. Structured meal plans (22) and meal replacements (18) were provided (free of charge) for the first 4 months, with patients encouraged to replace two meals and one snack daily with liquid shakes and meal bars. From months 5-12, they were instructed to replace one meal and one snack daily. Par-ticipants were prescribed !175 minutes/week of moderate intensity physical activity, to be achieved by month 6, with a further increase to !200 minutes/week for those who met this goal. The activity pro-gram relied on unsupervised exercise that, for most, consisted of brisk walking (1,18). Participants were instructed to keep daily records of their food intake, physical activity, and other targeted behaviors.
In years 2-8, the intervention focused principally on maintaining the weight losses and duration of physical activity achieved during year 1, as well as helping unsuccessful individuals achieve the study goals (18,19). Lifestyle counseling was provided primarily in indi-vidual sessions to allow tailoring to participants’ specific treatment needs. Each month, participants had an individual, on-site meeting (20-30 minutes), with a second individual contact by telephone or e-mail, approximately 2 weeks later. (This second contact was discon-tinued beginning in year 5.) Participants had individualized calorie goals, based on their desire to maintain their weight loss, lose more (if their BMI was >23 kg/m2), or reverse weight gain. All were encouraged to continue to use meal replacements (at no charge) to replace one meal or snack per day, to exercise !200 minutes/week, and to monitor weight weekly or more often.
During years 2-8, all sites offered a monthly group meeting at which members weighed-in, reviewed diet and activity records, and partici-pated in a lifestyle modification session. Each year sites also offered at least one Refresher Group and one National Campaign, as used in the DPP (21). Refresher Groups typically lasted 6-8 weeks and were organ-ized around a weight loss and/or physical activity theme (19). National Campaigns were similar in providing a group experience for 8-10 weeks but challenged participants to meet a specific goal (e.g., losing 5 lb), for which they received a small prize. Participants were strongly encouraged but not required to attend the various group offerings.
Interventionists included registered dietitians, psychologists, and exercise specialists, all of whom were certified annually. In addition to cognitive behavioral therapy, they incorporated elements of prob-lem solving, motivational interviewing, and cultural tailoring in their counseling (23-25). They also could select more intensive interven-tions from a toolbox, described previously (18,19).
DSE.
For the first 4 years, DSE participants were provided three 1-hour group meetings per year that discussed diet, physical activity, and social support, respectively (20). These sessions offered infor-mation but not specific behavioral strategies for adhering to the diet and physical activity recommendations. Years 5 to 8 provided one such session per year. Persons who desired more help with weight loss were referred to their PCPs, who were free to recommend what-ever interventions they considered appropriate.Assessments
Weight was measured at baseline and annually thereafter with a dig-ital scale (model BWB-800; Tanita, Willobrook, IL), by certified
Obesity
8-Year Weight Losses in Look AHEAD The Look AHEAD Research Group6 Obesity | VOLUME 22 | NUMBER 1 | JANUARY 2014 www.obesityjournal.org
‣randomizedされている
1 2
ランダム割り付けは隠蔽化され
ていたか
既知の予後因⼦子は群間で似
ていたか
‣2群間に差はない
(本⽂文中にnot differ
significantly
と記載)
staff who were masked to intervention assignment. Physical activity was assessed at baseline and years 1, 4, and 8 by the Paffenbarger Activity Questionnaire (PAQ) (26), which provides an estimate of weekly energy expenditure from moderate intensity physical activity (e.g., climbing stairs, walking, and other fitness, sport, and recrea-tional activities). At baseline and years 1 and 4, only participants at eight centers (i.e., the same each year) completed the questionnaire; in year 8, participants at all sites completed it. All participants also reported at baseline and years 1-4, as well as at year 8, the number of weeks in the prior year that they engaged in behaviors previously determined to be associated with long-term weight control: a) increasing physical activity (27-29); b) monitoring body weight (30,31); c) reducing calorie and fat intake (32,33); and d) using meal replacements (33). These items were included in a question-naire developed by study investigators (available on request).
Statistical analyses
The present analyses focused on the first 8 years of intervention, which all participants had the opportunity to complete before the trial was halted in September 2012. (Weight data reported in the pri-mary endpoint paper included participants at different stages of intervention, ranging from 8.2 to 11 years.) Differences between the DSE and ILI groups in changes in weight over the 8 years were ana-lyzed using a mixed effects analysis of covariance, which included baseline weight, clinical center, and treatment arm. The analyses fol-lowed the intention-to-treat principle in which participants were grouped according to intervention assignment, regardless of adher-ence, and all follow-up data were included. The percentage of par-ticipants in each group who met different categorical weight losses
(e.g., !5% or !10% loss) at years 1 and 8 were compared using
generalized estimating equations (GEE). For behavioral outcomes (e.g., physical activity), differences between groups on continuous measures were analyzed using analysis of covariance (adjusting for clinical center and baseline value of the outcome) and using GEE for categorical measures. Within the two intervention groups, a mixed effects analysis of covariance was used to examine the rela-tionship between weight loss (at years 1, 4, and 8) and gender, age, and race/ethnicity (controlling for baseline weight, clinical center, and interactions of each of the subgroup variables with year and intervention group). All statistical analyses were performed using SAS version 9.2 (SAS Institute, Cary, NC).
Body weight data for participants who died during the 8-year trial were included in the analyses until censored at the time of death. In addition, all analyses were conducted with and without censoring weights of participants (in both groups) who underwent bariatric sur-gery. In year 1, 5 ILI and 10 DSE participants had surgery, which increased by year 8 to a total of 76 and 84, respectively (the latter values representing 3.0% and 3.3% of participants randomized to ILI and DSE, respectively). The two sets of analyses yielded the same statistical conclusions concerning differences between groups. Mean weight losses for both sets of analyses are reported; however, we focus primarily on weight changes in which bariatric surgery patients were censored (at the time of surgery) to provide the most accurate estimate of the efficacy of the lifestyle intervention.
For the ILI participants only, weight loss trajectories over the 8
years were determined for participants who at year 1 had lost !10%
of initial weight, 5% to <10%, or <5%. Logistic regression was
used to determine the odds of achieving a loss !10% or !5% at
year 8, based on having achieved these categorical losses at year 1. Data for the 8-year trajectories comprised a completers’ sample as a result of not including participants who had been censored or had failed to provide a measured body weight at both years 1 and 8.
Results
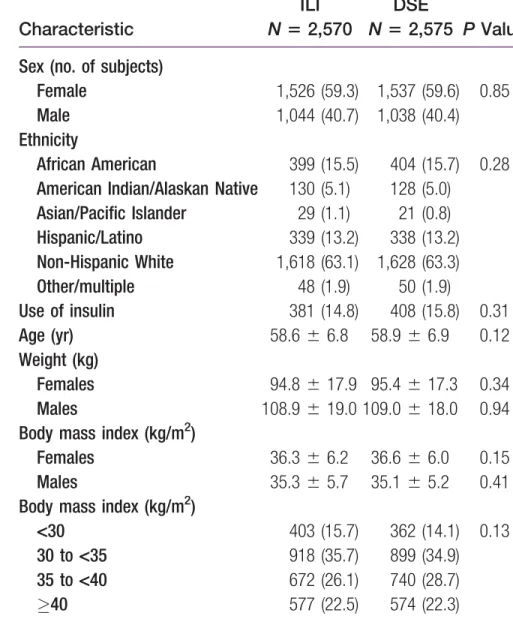
Participants’ baseline characteristics
ILI and DSE participants did not differ significantly on baseline characteristics, as reported previously (see Table 1) (2,33). Overall, average (6SD) age was 58.7 6 6.8 years, BMI was 36.0 6 5.9 kg/
m2, and duration of type 2 diabetes was 6.8 6 6.5 years. Figure 1
shows that 89.9% and 88.3% of ILI and DSE participants, respec-tively, completed the 8-year outcomes assessment (P 5 0.077). Year-8 retention was 94.0% (across the two groups) when deceased participants were removed from the denominator.
Weight loss
At year 1, ILI participants lost a mean (6SE) of 8.5% 6 0.2% of
initial weight, compared with 0.6% 6 0.2% for DSE (P < 0.001;
see Figure 2). (Mean losses, not censored for bariatric surgery, were
8.6% 6 0.2% and 0.6% 6 0.2%, respectively.) As reported
previ-ously (33), more ILI than DSE participants lost !5% of initial
weight (68.0% vs. 13.3%; P < 0.001), as well as !10% (37.7% vs.
TABLE 1Baseline characteristics of participants in the ILI and DSE groups Characteristic ILI N 5 2,570 DSE N 5 2,575 P Value Sex (no. of subjects)
Female 1,526 (59.3) 1,537 (59.6) 0.85
Male 1,044 (40.7) 1,038 (40.4)
Ethnicity
African American 399 (15.5) 404 (15.7) 0.28
American Indian/Alaskan Native 130 (5.1) 128 (5.0)
Asian/Pacific Islander 29 (1.1) 21 (0.8) Hispanic/Latino 339 (13.2) 338 (13.2) Non-Hispanic White 1,618 (63.1) 1,628 (63.3) Other/multiple 48 (1.9) 50 (1.9) Use of insulin 381 (14.8) 408 (15.8) 0.31 Age (yr) 58.6 6 6.8 58.9 6 6.9 0.12 Weight (kg) Females 94.8 6 17.9 95.4 6 17.3 0.34 Males 108.9 6 19.0 109.0 6 18.0 0.94
Body mass index (kg/m2)
Females 36.3 6 6.2 36.6 6 6.0 0.15
Males 35.3 6 5.7 35.1 6 5.2 0.41
Body mass index (kg/m2)
<30 403 (15.7) 362 (14.1) 0.13
30 to <35 918 (35.7) 899 (34.9)
35 to <40 672 (26.1) 740 (28.7)
!40 577 (22.5) 574 (22.3)
Values shown are means 6 SDs or frequency counts (with percentages).
Original Article Obesity
CLINICAL TRIALS: BEHAVIOR, PHARMACOTHERAPY, DEVICES, SURGERY
www.obesityjournal.org Obesity|VOLUME 22 | NUMBER 1 | JANUARY 2014 7
研究の進行とともに
、
予後のバラ
ンスは維持されたか
研究はどの程度度盲検化されて
いたか
‣体重測定者が盲検化されている.
介⼊入の性質上、参加者・治療療者は盲検化できない
staff who were masked to intervention assignment. Physical activity was assessed at baseline and years 1, 4, and 8 by the Paffenbarger Activity Questionnaire (PAQ) (26), which provides an estimate of weekly energy expenditure from moderate intensity physical activity (e.g., climbing stairs, walking, and other fitness, sport, and recrea-tional activities). At baseline and years 1 and 4, only participants at eight centers (i.e., the same each year) completed the questionnaire; in year 8, participants at all sites completed it. All participants also reported at baseline and years 1-4, as well as at year 8, the number of weeks in the prior year that they engaged in behaviors previously determined to be associated with long-term weight control: a) increasing physical activity (27-29); b) monitoring body weight (30,31); c) reducing calorie and fat intake (32,33); and d) using meal replacements (33). These items were included in a question-naire developed by study investigators (available on request).
Statistical analyses
The present analyses focused on the first 8 years of intervention, which all participants had the opportunity to complete before the trial was halted in September 2012. (Weight data reported in the pri-mary endpoint paper included participants at different stages of intervention, ranging from 8.2 to 11 years.) Differences between the DSE and ILI groups in changes in weight over the 8 years were ana-lyzed using a mixed effects analysis of covariance, which included baseline weight, clinical center, and treatment arm. The analyses fol-lowed the intention-to-treat principle in which participants were grouped according to intervention assignment, regardless of adher-ence, and all follow-up data were included. The percentage of par-ticipants in each group who met different categorical weight losses (e.g., !5% or !10% loss) at years 1 and 8 were compared using generalized estimating equations (GEE). For behavioral outcomes (e.g., physical activity), differences between groups on continuous measures were analyzed using analysis of covariance (adjusting for clinical center and baseline value of the outcome) and using GEE for categorical measures. Within the two intervention groups, a mixed effects analysis of covariance was used to examine the rela-tionship between weight loss (at years 1, 4, and 8) and gender, age, and race/ethnicity (controlling for baseline weight, clinical center, and interactions of each of the subgroup variables with year and intervention group). All statistical analyses were performed using SAS version 9.2 (SAS Institute, Cary, NC).
Body weight data for participants who died during the 8-year trial were included in the analyses until censored at the time of death. In addition, all analyses were conducted with and without censoring weights of participants (in both groups) who underwent bariatric sur-gery. In year 1, 5 ILI and 10 DSE participants had surgery, which increased by year 8 to a total of 76 and 84, respectively (the latter values representing 3.0% and 3.3% of participants randomized to ILI and DSE, respectively). The two sets of analyses yielded the same statistical conclusions concerning differences between groups. Mean weight losses for both sets of analyses are reported; however, we focus primarily on weight changes in which bariatric surgery patients were censored (at the time of surgery) to provide the most accurate estimate of the efficacy of the lifestyle intervention.
For the ILI participants only, weight loss trajectories over the 8 years were determined for participants who at year 1 had lost !10% of initial weight, 5% to <10%, or <5%. Logistic regression was used to determine the odds of achieving a loss !10% or !5% at
year 8, based on having achieved these categorical losses at year 1. Data for the 8-year trajectories comprised a completers’ sample as a result of not including participants who had been censored or had failed to provide a measured body weight at both years 1 and 8.
Results
Participants’ baseline characteristics
ILI and DSE participants did not differ significantly on baseline characteristics, as reported previously (see Table 1) (2,33). Overall, average (6SD) age was 58.7 6 6.8 years, BMI was 36.0 6 5.9 kg/ m2, and duration of type 2 diabetes was 6.8 6 6.5 years. Figure 1 shows that 89.9% and 88.3% of ILI and DSE participants, respec-tively, completed the 8-year outcomes assessment (P 5 0.077). Year-8 retention was 94.0% (across the two groups) when deceased participants were removed from the denominator.
Weight loss
At year 1, ILI participants lost a mean (6SE) of 8.5% 6 0.2% of initial weight, compared with 0.6% 6 0.2% for DSE (P < 0.001; see Figure 2). (Mean losses, not censored for bariatric surgery, were 8.6% 6 0.2% and 0.6% 6 0.2%, respectively.) As reported previ-ously (33), more ILI than DSE participants lost !5% of initial weight (68.0% vs. 13.3%; P < 0.001), as well as !10% (37.7% vs.
TABLE 1 Baseline characteristics of participants in the ILI and
DSE groups Characteristic ILI N 5 2,570 DSE N 5 2,575 P Value Sex (no. of subjects)
Female 1,526 (59.3) 1,537 (59.6) 0.85 Male 1,044 (40.7) 1,038 (40.4)
Ethnicity
African American 399 (15.5) 404 (15.7) 0.28 American Indian/Alaskan Native 130 (5.1) 128 (5.0)
Asian/Pacific Islander 29 (1.1) 21 (0.8) Hispanic/Latino 339 (13.2) 338 (13.2) Non-Hispanic White 1,618 (63.1) 1,628 (63.3) Other/multiple 48 (1.9) 50 (1.9) Use of insulin 381 (14.8) 408 (15.8) 0.31 Age (yr) 58.6 6 6.8 58.9 6 6.9 0.12 Weight (kg) Females 94.8 6 17.9 95.4 6 17.3 0.34 Males 108.9 6 19.0 109.0 6 18.0 0.94 Body mass index (kg/m2)
Females 36.3 6 6.2 36.6 6 6.0 0.15 Males 35.3 6 5.7 35.1 6 5.2 0.41 Body mass index (kg/m2)
<30 403 (15.7) 362 (14.1) 0.13 30 to <35 918 (35.7) 899 (34.9)
35 to <40 672 (26.1) 740 (28.7) !40 577 (22.5) 574 (22.3)
Values shown are means 6 SDs or frequency counts (with percentages).
Original Article
Obesity
CLINICAL TRIALS: BEHAVIOR, PHARMACOTHERAPY, DEVICES, SURGERY
www.obesityjournal.org Obesity | VOLUME 22 | NUMBER 1 | JANUARY 2014 7
3
参考:Look AHEAD studyに関する過去の報告では、 The trial was not blinded, but clinical assessors and end-‐point
adjudicators were un-‐ aware of study-‐group assignments. とある。 N Engl J Med 2013;369:145-‐54.
のp146
研究完了時点で両群は
、
予後の
バランスがとれていたか
追跡は完了了しているか
患者は、ランダム割り付けされた集団において解析さ
れたか
staff who were masked to intervention assignment. Physical activity was assessed at baseline and years 1, 4, and 8 by the Paffenbarger Activity Questionnaire (PAQ) (26), which provides an estimate of weekly energy expenditure from moderate intensity physical activity (e.g., climbing stairs, walking, and other fitness, sport, and recrea-tional activities). At baseline and years 1 and 4, only participants at eight centers (i.e., the same each year) completed the questionnaire; in year 8, participants at all sites completed it. All participants also reported at baseline and years 1-4, as well as at year 8, the number of weeks in the prior year that they engaged in behaviors previously determined to be associated with long-term weight control: a) increasing physical activity (27-29); b) monitoring body weight (30,31); c) reducing calorie and fat intake (32,33); and d) using meal replacements (33). These items were included in a question-naire developed by study investigators (available on request).
Statistical analyses
The present analyses focused on the first 8 years of intervention, which all participants had the opportunity to complete before the trial was halted in September 2012. (Weight data reported in the pri-mary endpoint paper included participants at different stages of intervention, ranging from 8.2 to 11 years.) Differences between the DSE and ILI groups in changes in weight over the 8 years were ana-lyzed using a mixed effects analysis of covariance, which included baseline weight, clinical center, and treatment arm. The analyses fol-lowed the intention-to-treat principle in which participants were grouped according to intervention assignment, regardless of adher-ence, and all follow-up data were included. The percentage of par-ticipants in each group who met different categorical weight losses (e.g., !5% or !10% loss) at years 1 and 8 were compared using generalized estimating equations (GEE). For behavioral outcomes (e.g., physical activity), differences between groups on continuous measures were analyzed using analysis of covariance (adjusting for clinical center and baseline value of the outcome) and using GEE for categorical measures. Within the two intervention groups, a mixed effects analysis of covariance was used to examine the rela-tionship between weight loss (at years 1, 4, and 8) and gender, age, and race/ethnicity (controlling for baseline weight, clinical center, and interactions of each of the subgroup variables with year and intervention group). All statistical analyses were performed using SAS version 9.2 (SAS Institute, Cary, NC).
Body weight data for participants who died during the 8-year trial were included in the analyses until censored at the time of death. In addition, all analyses were conducted with and without censoring weights of participants (in both groups) who underwent bariatric sur-gery. In year 1, 5 ILI and 10 DSE participants had surgery, which increased by year 8 to a total of 76 and 84, respectively (the latter values representing 3.0% and 3.3% of participants randomized to ILI and DSE, respectively). The two sets of analyses yielded the same statistical conclusions concerning differences between groups. Mean weight losses for both sets of analyses are reported; however, we focus primarily on weight changes in which bariatric surgery patients were censored (at the time of surgery) to provide the most accurate estimate of the efficacy of the lifestyle intervention.
For the ILI participants only, weight loss trajectories over the 8 years were determined for participants who at year 1 had lost !10% of initial weight, 5% to <10%, or <5%. Logistic regression was used to determine the odds of achieving a loss !10% or !5% at
year 8, based on having achieved these categorical losses at year 1. Data for the 8-year trajectories comprised a completers’ sample as a result of not including participants who had been censored or had failed to provide a measured body weight at both years 1 and 8.
Results
Participants’ baseline characteristics
ILI and DSE participants did not differ significantly on baseline characteristics, as reported previously (see Table 1) (2,33). Overall, average (6SD) age was 58.7 6 6.8 years, BMI was 36.0 6 5.9 kg/ m2, and duration of type 2 diabetes was 6.8 6 6.5 years. Figure 1 shows that 89.9% and 88.3% of ILI and DSE participants, respec-tively, completed the 8-year outcomes assessment (P 5 0.077). Year-8 retention was 94.0% (across the two groups) when deceased participants were removed from the denominator.
Weight loss
At year 1, ILI participants lost a mean (6SE) of 8.5% 6 0.2% of initial weight, compared with 0.6% 6 0.2% for DSE (P < 0.001; see Figure 2). (Mean losses, not censored for bariatric surgery, were 8.6% 6 0.2% and 0.6% 6 0.2%, respectively.) As reported previ-ously (33), more ILI than DSE participants lost !5% of initial weight (68.0% vs. 13.3%; P < 0.001), as well as !10% (37.7% vs.
TABLE 1 Baseline characteristics of participants in the ILI and
DSE groups Characteristic ILI N 5 2,570 DSE N 5 2,575 P Value Sex (no. of subjects)
Female 1,526 (59.3) 1,537 (59.6) 0.85 Male 1,044 (40.7) 1,038 (40.4)
Ethnicity
African American 399 (15.5) 404 (15.7) 0.28 American Indian/Alaskan Native 130 (5.1) 128 (5.0)
Asian/Pacific Islander 29 (1.1) 21 (0.8) Hispanic/Latino 339 (13.2) 338 (13.2) Non-Hispanic White 1,618 (63.1) 1,628 (63.3) Other/multiple 48 (1.9) 50 (1.9) Use of insulin 381 (14.8) 408 (15.8) 0.31 Age (yr) 58.6 6 6.8 58.9 6 6.9 0.12 Weight (kg) Females 94.8 6 17.9 95.4 6 17.3 0.34 Males 108.9 6 19.0 109.0 6 18.0 0.94 Body mass index (kg/m2)
Females 36.3 6 6.2 36.6 6 6.0 0.15 Males 35.3 6 5.7 35.1 6 5.2 0.41 Body mass index (kg/m2)
<30 403 (15.7) 362 (14.1) 0.13 30 to <35 918 (35.7) 899 (34.9)
35 to <40 672 (26.1) 740 (28.7) !40 577 (22.5) 574 (22.3)
Values shown are means 6 SDs or frequency counts (with percentages).
Original Article Obesity
CLINICAL TRIALS: BEHAVIOR, PHARMACOTHERAPY, DEVICES, SURGERY
www.obesityjournal.org Obesity | VOLUME 22 | NUMBER 1 | JANUARY 2014 7
3
•
ITT解析
• 追跡期間
8年
• 追跡率
ILI群89.9%、DSE群88.3%、
死亡者を母数から除けば
94%
staff who were masked to intervention assignment. Physical activity was assessed at baseline and years 1, 4, and 8 by the Paffenbarger Activity Questionnaire (PAQ) (26), which provides an estimate of weekly energy expenditure from moderate intensity physical activity (e.g., climbing stairs, walking, and other fitness, sport, and recrea-tional activities). At baseline and years 1 and 4, only participants at eight centers (i.e., the same each year) completed the questionnaire; in year 8, participants at all sites completed it. All participants also reported at baseline and years 1-4, as well as at year 8, the number of weeks in the prior year that they engaged in behaviors previously determined to be associated with long-term weight control: a) increasing physical activity (27-29); b) monitoring body weight (30,31); c) reducing calorie and fat intake (32,33); and d) using meal replacements (33). These items were included in a question-naire developed by study investigators (available on request).
Statistical analyses
The present analyses focused on the first 8 years of intervention, which all participants had the opportunity to complete before the trial was halted in September 2012. (Weight data reported in the pri-mary endpoint paper included participants at different stages of intervention, ranging from 8.2 to 11 years.) Differences between the DSE and ILI groups in changes in weight over the 8 years were ana-lyzed using a mixed effects analysis of covariance, which included baseline weight, clinical center, and treatment arm. The analyses fol-lowed the intention-to-treat principle in which participants were grouped according to intervention assignment, regardless of adher-ence, and all follow-up data were included. The percentage of par-ticipants in each group who met different categorical weight losses (e.g., !5% or !10% loss) at years 1 and 8 were compared using generalized estimating equations (GEE). For behavioral outcomes (e.g., physical activity), differences between groups on continuous measures were analyzed using analysis of covariance (adjusting for clinical center and baseline value of the outcome) and using GEE for categorical measures. Within the two intervention groups, a mixed effects analysis of covariance was used to examine the rela-tionship between weight loss (at years 1, 4, and 8) and gender, age, and race/ethnicity (controlling for baseline weight, clinical center, and interactions of each of the subgroup variables with year and intervention group). All statistical analyses were performed using SAS version 9.2 (SAS Institute, Cary, NC).
Body weight data for participants who died during the 8-year trial were included in the analyses until censored at the time of death. In addition, all analyses were conducted with and without censoring weights of participants (in both groups) who underwent bariatric sur-gery. In year 1, 5 ILI and 10 DSE participants had surgery, which increased by year 8 to a total of 76 and 84, respectively (the latter values representing 3.0% and 3.3% of participants randomized to ILI and DSE, respectively). The two sets of analyses yielded the same statistical conclusions concerning differences between groups. Mean weight losses for both sets of analyses are reported; however, we focus primarily on weight changes in which bariatric surgery patients were censored (at the time of surgery) to provide the most accurate estimate of the efficacy of the lifestyle intervention.
For the ILI participants only, weight loss trajectories over the 8 years were determined for participants who at year 1 had lost !10% of initial weight, 5% to <10%, or <5%. Logistic regression was used to determine the odds of achieving a loss !10% or !5% at
year 8, based on having achieved these categorical losses at year 1. Data for the 8-year trajectories comprised a completers’ sample as a result of not including participants who had been censored or had failed to provide a measured body weight at both years 1 and 8.
Results
Participants’ baseline characteristics
ILI and DSE participants did not differ significantly on baseline characteristics, as reported previously (see Table 1) (2,33). Overall, average (6SD) age was 58.7 6 6.8 years, BMI was 36.0 6 5.9 kg/ m2, and duration of type 2 diabetes was 6.8 6 6.5 years. Figure 1 shows that 89.9% and 88.3% of ILI and DSE participants, respec-tively, completed the 8-year outcomes assessment (P 5 0.077). Year-8 retention was 94.0% (across the two groups) when deceased participants were removed from the denominator.
Weight loss
At year 1, ILI participants lost a mean (6SE) of 8.5% 6 0.2% of initial weight, compared with 0.6% 6 0.2% for DSE (P < 0.001; see Figure 2). (Mean losses, not censored for bariatric surgery, were 8.6% 6 0.2% and 0.6% 6 0.2%, respectively.) As reported previ-ously (33), more ILI than DSE participants lost !5% of initial weight (68.0% vs. 13.3%; P < 0.001), as well as !10% (37.7% vs.
TABLE 1 Baseline characteristics of participants in the ILI and
DSE groups Characteristic ILI N 5 2,570 DSE N 5 2,575 P Value Sex (no. of subjects)
Female 1,526 (59.3) 1,537 (59.6) 0.85 Male 1,044 (40.7) 1,038 (40.4)
Ethnicity
African American 399 (15.5) 404 (15.7) 0.28 American Indian/Alaskan Native 130 (5.1) 128 (5.0)
Asian/Pacific Islander 29 (1.1) 21 (0.8) Hispanic/Latino 339 (13.2) 338 (13.2) Non-Hispanic White 1,618 (63.1) 1,628 (63.3) Other/multiple 48 (1.9) 50 (1.9) Use of insulin 381 (14.8) 408 (15.8) 0.31 Age (yr) 58.6 6 6.8 58.9 6 6.9 0.12 Weight (kg) Females 94.8 6 17.9 95.4 6 17.3 0.34 Males 108.9 6 19.0 109.0 6 18.0 0.94 Body mass index (kg/m2)
Females 36.3 6 6.2 36.6 6 6.0 0.15 Males 35.3 6 5.7 35.1 6 5.2 0.41 Body mass index (kg/m2)
<30 403 (15.7) 362 (14.1) 0.13 30 to <35 918 (35.7) 899 (34.9)
35 to <40 672 (26.1) 740 (28.7) !40 577 (22.5) 574 (22.3)
Values shown are means 6 SDs or frequency counts (with percentages).
Original Article Obesity
CLINICAL TRIALS: BEHAVIOR, PHARMACOTHERAPY, DEVICES, SURGERY
www.obesityjournal.org Obesity | VOLUME 22 | NUMBER 1 | JANUARY 2014 7
試験は早期中止されたか
• 追跡期間8年で解析されている。
•
Look AHEAD自体の予定期間は、2001年から04年
に計
5145人の患者を集め、最長13.5年のフォロー
アップ予定であったが、
2012年9月に中断されてい
るが、個々の患者で8年以上
(8.2-‐11年)はフォロー
されている。
治療療に関する論論⽂文のユーザーズガイド
②結果は何か
治療療効果の⼤大きさはどれくらいか
RRR・ARR・NNTはそれぞれいくらか
治療療効果の推定値はどれくらい精確か
上記それぞれの95%CI区間の範囲は適切切か・広
すぎないか
31‣
治療療効果の⼤大きさはどれくらいか
years, participants in ILI lost significantly more weight than their
corresponding peers in DSE (see Table 2 for means and P values).
Within the ILI group, men and women achieved comparable weight losses over the 8 years, with mean differences between them ranging from 0.3% (year 1) to 0.9% (year 8) (Table 2). By contrast, the oldest ILI individuals (65-76 years at baseline) consis-tently lost more weight than the youngest participants (45-54 years), with differences ranging from 0.9% (year 1) to 3.0% (year 8). Non-Hispanic white participants in ILI lost significantly more weight at year 1 than participants who self-identified as African American, Hispanic, and American Indian/Other. However, at years 4 and 8, mean weight losses were comparable among the four racial/ethnic groups, as they were among DSE participants at all years. Older DSE participants lost more weight than their younger counterparts, with the greatest difference (1.9%) between age groups occurring at year 8.
Physical activity and weight control behaviors
At baseline, participants in both groups reported expending approxi-mately 860 kcal/week in moderate intensity physical activity, as determined by the PAQ. ILI participants, compared with DSE, achieved significantly greater increases on this measure at all subse-quent assessments (see Table 3). Reported energy expenditure more
than doubled in ILI participants the first year (1737.8 6 47.6 kcal/
week) but declined in subsequent years. Table 3 also presents the number of weeks in the past year that participants reported engaging in selected weight control behaviors. Groups did not differ at base-line on any measures; however, at all subsequent assessments, ILI participants, compared with DSE, significantly increased the number of weeks in which they reported exercising, reducing their calorie and fat intake, and using meal replacements (see Table 3). Practice of all behaviors increased the most during the first year. At years 1, 4, and 8, significantly more ILI than DSE participants also reported measuring their body weight weekly or more often, as well as daily or more often.
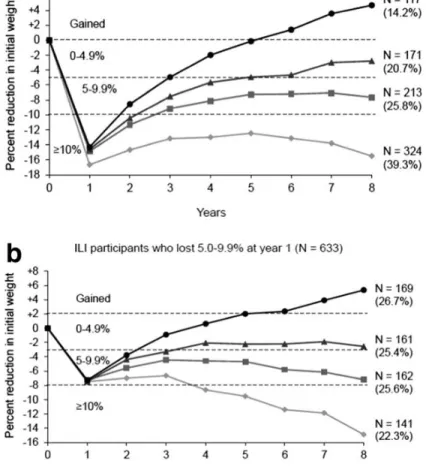
Achievement of categorical weight losses in ILI over 8 years
Figure 4a presents the weight loss trajectories of 825 ILI participants
who lost !10% of weight at year 1 and qualified for data analysis
at year 8 (as described in the Methods section). Of these 825
partici-pants, 324 (39.3%) achieved a !10% loss at year 8, 213 (25.8%) a
loss of 5% to <10%, 171 (20.7%) a loss of 0% to <5%, and 117
(14.2%) gained above their baseline weight. A comparison of
partic-ipants who at year 8 maintained the !10% loss versus gained above
baseline weight revealed that maintainers reported (at year 8) a
higher activity-related energy expenditure (1471.9 6 121.1 vs.
799.9 6 100.9 kcal/week, P < 0.001) and a greater number of
weeks (in the prior year) reducing their calorie and fat intake (both P values <0.001; see Table 4). Weight maintainers also were more likely than full regainers to weigh themselves daily or more often (47.8% vs. 28.4%), as well as weekly or more (82.4% vs. 69.8%)
(both P < 0.001).
Figure 4b presents weight loss trajectories of the 633 participants
who at year 1 lost 5% to <10% of initial weight and shows that 303
(47.9%) had a loss of !5% at year 8. Figure 4c presents similar
Figure 2 Figure shows mean (6SE) weight losses over 8 years for participants ran-domly assigned to an intensive lifestyle intervention (ILI) or diabetes support and education (DSE; usual care group). Differences between groups were significant (P < 0.001) at all years.
Figure 3 (a) Percentage of participants in the ILI and DSE groups who achieved dif-ferent categorical weight losses at year 1. The percentages are cumulative such that the 68% of ILI participants who lost 5% or more of initial weight includes those who also lost !10% and !15%. P < 0.001 for all comparisons between treatment groups. (b) Percentage of participants in the ILI and DSE groups who achieved
dif-Original Article Obesity
CLINICAL TRIALS: BEHAVIOR, PHARMACOTHERAPY, DEVICES, SURGERY
Baselineからの減少率は、
ILI群 4.7%±0.2%, DSE群 2.1%±0.2%で、P値は<0.001
ILI群で最初1年で8.5%減のピーク、4-‐6年で平衡状態
結果が達成、非達成等の2値でないため、NNT算出不可 3233
Acknowledgments
Federal support: National Institute of Diabetes and Digestive and Kidney Diseases (to Mary Evans, PhD; Barbara Harrison, MS; Van S. Hubbard, MD, PhD; and Susan Z. Yanovski, MD); National Heart, Lung, and Blood Institute (to Lawton S. Cooper, MD, MPH; Peter Kaufman, PhD, FABMR; and Mario Stylianou, PhD); and the
Centers for Disease Control and Prevention (to Edward W. Gregg, PhD; Ping Zhang, PhD). The following organizations committed to make major contributions to Look AHEAD: FedEx Corporation; Health Management Resources; LifeScan, Inc., a Johnson & Johnson Company; OPTIFASTVR of Nestle HealthCare Nutrition, Inc.;
Hoffmann-La Roche Inc.; Abbott Nutrition; and Slim-Fast Brand of Unilever North America. The authors thank Ms. Patricia Hong for her editorial assistance in preparing the manuscript.
Appendix : Authors
Thomas A. Wadden, PhD; John P. Bantle, MD; George L. Blackburn, MD, PhD; Paula Bolin, RN, MC; Frederick L. Bran-cati, MD, MHS; George A. Bray, MD; Jeanne M. Clark, MD, MPH; Mace Coday, PhD; Gareth R. Dutton, PhD; Caitlin Egan, MS; Mary Evans, PhD; John P. Foreyt, PhD; Siran Gha-zarian Sengardi, MD; Edward W. Gregg, PhD; Helen P. Hazuda, PhD; James O. Hill, PhD; Edward S. Horton, MD; Van S. Hubbard, MD, PhD; John M. Jakicic, PhD; Robert W. Jeffery, PhD; Karen C. Johnson, MD, MPH; Steven E. Kahn, MB, ChB; Abbas E. Kitabchi, PhD, MD; William C. Knowler, MD, DrPH; Cora E. Lewis, MD, MSPH; Barbara J. Maschak-Carey, MSN, CDE; Maria G. Montez, RN, MSHP, CDE; Brenda Montgomery, RN, MS, CDE; David M. Nathan, MD; Julie Nelson, RD; Jennifer Patricio, MS; Anne Peters, MD; F. Xavier Pi-Sunyer, MD; Henry Pownall, PhD; Amy D. Rickman, PhD, RD, LDN; Mara Vitolins, DrPH; Michael P. Walkup, MS; Delia S. West, PhD; Donald Williamson, PhD; Rena R. Wing, PhD; Holly Wyatt, MD; and Susan Z. Yanovski, MD.
VC 2014 The Obesity Society
REFERENCES
1. Look AHEAD Research Group, Ryan DA. Look AHEAD (Action for Health in Diabetes): design and methods for a clinical trial of weight loss for the prevention of cardiovascular disease in type 2 diabetes.Control Clin Trials 2003;24:610-628. 2. Look AHEAD Research Group, Wing RR. Cardiovascular effects of intensive
lifestyle intervention in type 2 diabetes.N Engl J Med 2013;369:145-154.
3. Faulconbridge LF, Wadden TA, Rubin RR, et al. One-year changes in symptoms of depression and weight in overweight/obese individuals with type 2 diabetes in the Look AHEAD study.Obesity 2012;20:783-793.
4. Williamson DA, Rejeski J, Lang W, et al. Impact of a weight management program on health-related quality of life in overweight adults with type 2 diabetes. Arch Intern Med 2009;169:163-171.
5. Kuna ST, Reboussin DM, Borradaile KE, et al. Long-term effect of weight loss on obstructive sleep apnea severity in obese patients with type 2 diabetes.Sleep 2013; 36:641-649.
6. Rejeski WJ, Ip EH, Bertoni AG, et al; Look AHEAD Research Group. Lifestyle change and mobility in obese adults with type 2 diabetes.N Engl J Med 2012;366: 1209-17.
7. National Institutes of Health/National Heart, Lung, and Blood Institute. Clinical guidelines on the identification, evaluation, and treatment of overweight and obesity in adults.Obes Res 1998;6:51S-210S.
8. Institute of Medicine. Weighing the Options: Criteria for Evaluating Weight Management Programs. Washington, DC: National Academy Press; 1995.
9. World Health Organization. Obesity: Preventing and Managing the Global Epidemic. Geneva, Switzerland: Author; 1998.
10. Wing RR, Lang W, Wadden TA, et al; Look AHEAD Research Group. Benefits of modest weight loss in improving cardiovascular risk factors in overweight and obese individuals with type 2 diabetes.Diabetes Care 2011;34:1481-1486.
11. Knowler WC, Barrett-Connor E, Fowler SE, et al; Diabetes Prevention Program Research Group. Reduction in the incidence of type 2 diabetes with lifestyle intervention or metformin.N Engl J Med 2002;346:393-403.
12. Gregg EW, Chen H, Wagenknecht LE, et al. Association of an intensive lifestyle intervention with remission of type 2 diabetes.JAMA 2012;308:2489-2896.
13. Stevens VJ, Obarzanek E, Cook NR, et al. Long-term weight loss and changes in blood pressure: results of the Trials of Hypertension Prevention, phase II. Ann Intern Med 2001;134:1-11.
Figure 4(a) Weight loss trajectories over 8 years in 825 participants in the intensive lifestyle intervention (ILI) who, at year 1, lost !10% of initial weight and, at year 8, provided a measured body weight. The figure shows the number of participants who, at year 8, maintained a loss of 10% or more of initial weight (N5 324), of 5%-9.9% (N5 213), of 0%-4.9% (N 5 171), or who gained above their baseline weight (N5 117). The percentages shown in parentheses are based on the sam-ple size for the subgroup. Thus, the 324 of 825 participants who maintained a !10% loss at year 8 comprised 39.3% of this subgroup of participants. (b) Weight loss trajectories over 8 years in 633 ILI participants who, at year 1, lost 5%-9.9% of initial weight and, at year 8, provided a measured body weight. The four catego-ries of weight change that these participants achieved at year 8 are presented in the same manner as in Figure 4(a). (c) Weight loss trajectories over 8 years in 656 ILI participants who, at year 1, lost <5% of initial weight and, at year 8, provided a measured body weight. The four categories of weight change that these partici-pants achieved at year 8 are presented in the same manner as in Figure 4(a).
Obesity 8-Year Weight Losses in Look AHEAD The Look AHEAD Research Group
12 Obesity|VOLUME 22 | NUMBER 1 | JANUARY 2014 www.obesityjournal.org
lost !10% of initial weight at year 1, 39% maintained this degree of weight loss at year 8, and another 26% maintained a loss of 5% to <10%. Those who maintained the full !10% loss at year 8, com-pared with those who regained above baseline, reported greater prac-tice of several weight-maintenance behaviors, including high levels of physical activity, reduced calorie intake, and frequent monitoring of body weight. These behaviors have been identified in prior stud-ies of successful weight loss maintainers (28-32).
The lifestyle intervention’s strengths are offset by findings that 32% of ILI participants did not lose at least 5% of initial weight in the first year, and only 34.5% of these individuals achieved this goal at year 8. Logistic regression analyses clearly revealed the importance of successful first-year weight loss for achieving a clinically mean-ingful loss at year 8. This finding highlights the need for research on methods of inducing weight loss in persons who do not have an early, favorable response to lifestyle modification.
Nearly 36% of DSE participants achieved a !5% weight loss at year 8, compared with 13.3% at year 1. Several factors may have contributed to more of these participants reaching this criterion over time. DSE participants were permitted, in consultation with their PCPs, to pursue whatever weight loss options they wished. Their weight loss also could have been unintentional (39) and reflect the effects of aging (40) or illness (39) (including diabetes (36)), as dis-cussed with weight loss in older ILI participants.
In summary, Look AHEAD advances the management of obesity by showing that a comprehensive, long-term lifestyle intervention pro-duced !5% weight loss at 8 years in 50% of participants. While efforts clearly are needed to translate the current treatment approach into clinical practice, Look AHEAD provides new optimism for the long-term management of obesity and its many co-morbid condi-tions that are ameliorated by weight loss.O
TAB LE 3 ILI and DSE participants’ reports of their physical activity, calorie restriction, and other weight control behaviors Varia ble Baseline Year 1 Year 4 Year 8 ILI DSE P value ILI DSE P value ILI DSE P value ILI DSE P value Phys ical activity (kcal/wk) 859.5 6 31.9 862.4 6 34.3 0.376 1737.8 6 47.6 968.9 6 40.9 < 0.001 1245.4 6 43.2 974.7 6 36.0 < 0.001 1040.2 6 35.3 853.2 6 27.3 0.001 Increased exercise (no. wk/yr) 10.3 6 0.3 10.1 6 0.3 0.696 35.6 6 0.4 12.2 6 0.4 < 0.001 13.8 6 0.4 10.2 6 0.4 < 0.001 10.9 6 0.4 8.7 6 0.4 < 0.001 Reduced kcal (no. wk/yr) 8.8 6 0.3 9.3 6 0.3 0.222 40.1 6 0.4 12.6 6 0.4 < 0.001 21.0 6 0.4 12.1 6 0.4 < 0.001 17.9 6 0.4 11.0 6 0.4 < 0.001 Reduced fat (no. wk/yr) 12.6 6 0.4 12.8 6 0.4 0.627 41.2 6 0.4 16.4 6 0.4 < 0.001 24.4 6 0.5 16.2 6 0.5 < 0.001 20.8 6 0.5 14.1 6 0.5 < 0.001 Meal replacements (no. wk/yr) 1.6 6 0.1 1.6 6 0.1 0.720 39.0 6 0.3 3.5 6 0.3 < 0.001 24.3 6 0.4 2.0 6 0.4 < 0.001 17.2 6 0.4 1.8 6 0.4 < 0.001 Monitored weight ! Weekly , N (%) 1,041 (40.5) 1,052 (40.9) 0.798 2,290 (91.1) 1,085 (43.7) < 0.001 1,769 (73.1) 1,045 (43.5) < 0.001 1,555 (67.2) 1,027 (45.1) < 0.001 ! Dai ly, N (% ) 301 (11.7) 318 (12.3) 0.479 1,162 (46.2) 318 (12.8) < 0.001 822 (34.0) 315 (13.1) < 0.001 754 (32.6) 319 (14.0) < 0.001 Values shown for physical activity are raw means 6 SE; the p value is from a model that uses the log-transformed value of the measure. P values are adjusted for clinical site and the log of the baseline value (for years 1, 4, and 8). All other values are LS means 6 SE or frequency count (percentage). P values are adjusted for clinical site and baseline value (for years 1, 4, and 8). (As noted in the Methods section, at baseline and years 1 and 4, only participants at eight centers [i.e., the same each year] completed the Paffenbarger Activity Questionnaire (27); in year 8, participant s at all sites completed it.)
TABLE 4Weight control behaviors at Year 8 for ILI
participants who maintained (N 5 324) versus regained (N 5 117) their !10% weight loss, achieved at Year 1
Year 8 behaviors
Year 8 weight change
P value Maintained !10% Loss Gained above baseline weight
Physical activity (kcal/wk) 1471.9 6 121.2 799.9 6 100.9 0.001 Reduced Kcal (no. wk/yr) 20.4 6 1.4 11.9 6 2.1 <0.001 Reduced fat (no. wk/yr) 24.2 6 1.5 15.6 6 2.2 <0.001 Increased exercise (no. wk/yr) 12.9 6 1.3 8.2 6 1.8 0.013 Meal replacements (no. wk/yr) 22.8 6 2.0 17.3 6 2.9 0.072 Monitored weight
!Weekly, N (%) 262 (82.4) 81 (69.8) 0.001 !Daily, N (%) 152 (47.8) 33 (28.4) <0.001
Values shown are LS means (raw means for Paffenbarger)6 standard error or fre-quency count (percentage).
Pvalues are adjusted for clinical site and baseline value.
Original Article Obesity
CLINICAL TRIALS: BEHAVIOR, PHARMACOTHERAPY, DEVICES, SURGERY
www.obesityjournal.org Obesity| VOLUME 22 | NUMBER 1 | JANUARY 2014 11