Evaluation of the Medical Service Environment for a Second Medical
Area Using Data Envelopment Analysis
Shinya MIZUNO
†1, Haruka OHBA
†1, Atsuo KAKEHI
†2,Yoshikazu FUJISAWA
†3 4 Abstract: Low birth rates and an aging society indicate that the aging population will continue to grow. Thus, medical services are of increasing importance. Under these circumstances, the administration has formulated regional medical vision by introducing a comprehensive nursing care security promotion law. This regional medical care initiative is considered a unit of secondary medicine where independent medical services are required. However, regional disparity exists. We focus on data envelopment analysis (DEA), which is an operational research method, and apply it to large-scale typing. Feature amount extraction is indispensable for the analysis of big data. DEA is not an average evaluation; however, because it evaluates a characteristic quantity, it is suitable for extracting feature quantity. In this research, to evaluate the health care provision capacity of the area, we first make a database of all areas using open data. We then conduct basic analysis using this information and statistically evaluate the second medical area. Using DEA, we obtain a reference set including 32 DMUs that are further clarified by their dependent sets. We show the process of acquiring the index to improve the medical services provided by a second medical area. It is possible for all second medical areas to improve medical services in the same way that shows how to aim for an effective second medical area.Keywords: DEA, second medical area, open data
1. INTRODUCTION
Currently, the aging population is expected to continue to grow considering the declining birthrate and aging society. Therefore, medical services are of increasing importance. Under these circumstances, the administration of each prefecture must formulate a regional medical care initiative [1] according to the Medical Nursing Care Comprehensive Encouragement Promotion Act [2]. In Japan, medical areas can be categorized into three types. First medical areas provide health care that is closely related to daily life. They are basically units of a municipality. Second medical areas are composed of a plurality of municipalities and provide general health care and complete medical services. Third medical areas are basically prefectural units; they provide special medical care that requires advanced technology [3]. This regional medical care initiative is a unit of second medical areas, and future autonomous medical services in the second medical area are required. However, there are regional disparities in the second medical area. Here, the second medical area is defined as a unit in which the plurality of municipalities composes the unit, and it is defined as a range within which daily medical services can be completed. Therefore, considering the actual circumstances of current second medical areas, regional evaluation of the second medical area is necessary because of limited medical resources.
Reviews of second medical areas have been conducted many times. In the case where the population size of the second medical
†1 Shizuoka Institute of Science and Technology (Correspondence Author: mizuno.shinya@sist.ac.jp) †2 Kogakuin University
†3 Miyagi University †4 Tokyo Medical University Received 15/Nov./2018 Accepted 28/Feb./2019
area has a large influence on medical treatment trends for the whole medical area and a portion of the second medical area, it is difficult to construct a medical service organization. In the Medical Planning Guidelines, we clarify the idea of instituting a second medical area based on a certain population size, constant patient inflow, and outflow ratio. The second medical area is not established as an integrated area that provides medical treatment pertaining to hospitalization to prefectures [4]. Second medical areas are adjacent to constituent areas, and change affects all neighboring second medical areas. Regional disparities are also increasing in medical care; thus, a comprehensive assessment is needed. Although second medical area evaluation focuses on a certain subject in preceding research, a comprehensive evaluation reflecting the actual circumstances of each second medical area in recent years has not been conducted [5-9]. Geographical information on second medical areas is also considered important [10,11].
We focus on data envelopment analysis (DEA), which is an operations research method and apply it to large-scale typing. Feature amount extraction is indispensable for the analysis of big data [12]. DEA is not an average evaluation, but because it evaluates a characteristic quantity it is suitable for extracting feature quantity. The analysis platform that we construct is used to classify second medical areas to investigate the type of categories produced. There are several DEA models. Cost reduction is emphasized in the Industry 4.0 framework and it is very important for Japan where population declines. Thus, we
adopt the input-oriented model. Additionally, when the data amount is large, to calculate the solution within the actual use time, the linear model is preferable from the perspective of the calculation amount. Therefore, we use the CCR model.
DEA was proposed as a method to measure relative efficiency from entity information [13]. At the time, the CCR model was the main mode, but the BCC model [14], additive model [15], and multiplicative model [16,17] were also proposed. In addition to evaluating the entity, research that also incorporates judgment of the evaluator has been proposed [18-21]. Due to the development of such a theory, DEA has been widely applied and is recognized as one method of data analysis used to visualize data. There are also many algorithms of DEA [22-25]. Many of these perform DEA calculations on a single computer. To solve these problems, a method performs distributed processing of DEA [26] and another method uses network technology [27]. Now that cloud computing is widespread, a DEA computing environment suitable for these environments is necessary. A general-purpose platform to utilize the DEA theory is effective in the current big data environment [28].
In this research, to evaluation the health care provision capacity of the area, we first make a database of all areas using open data. In the analysis of local second medical areas, we will evaluate all such medical areas using open data. We next conduct basic analysis using this information and statistically evaluate the second medical area. To evaluate health care provision using DEA, we use inpatient rate, the rate of elderly people, and patient outflow rate as input items. For output items, we use doctor rate, the rate of young people, and patient inflow rate. We use these to analyze with DEA and elect second medical areas as good models. From the dual problem, we calculate the direction ratio for the reference set and use it as a future index. When using DEA, it becomes clear how to supplement the functions in regions with low evaluations, because such evaluations become an index that can be used to complement the disparity in second medical areas.
2. BASIC ANALYSIS OF SECOND MEDICAL
AREA INFORMATION
In this section, we conduct a basic analysis of the items used in DEA. We use these open data in Table 1. In this study, we target 344 second medical areas.
Fig. 1 shows the relationship between the population and the number of hospitalized patients. Using the regression line as an index, the number of hospitalized patients varies. Similarly, Fig. 2 shows the ratio of the number of doctors to the population. We see that there is variation in the doctor rate in each second medical area.
Fig. 1 Relation for Population and Number of hospitalized patients
Fig. 2 Relation for Population and Number of doctors
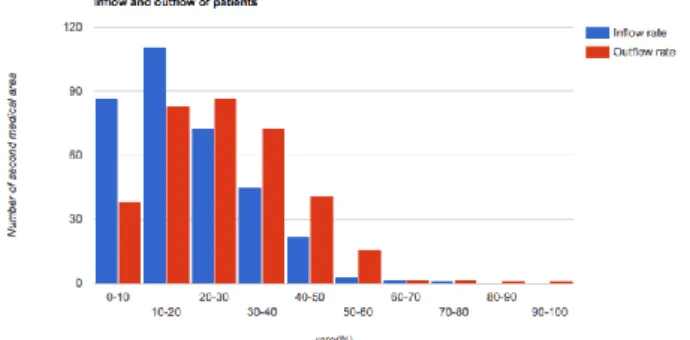
Next, we check the inflow and outflow rates of hospitalized patients for the second medical area. From Fig. 3, the patient inflow rate is biased towards a low rate, but the outflow rate is wide. The figure shows that it cannot respond within the second medical area, and there is a lack of medical service capability.
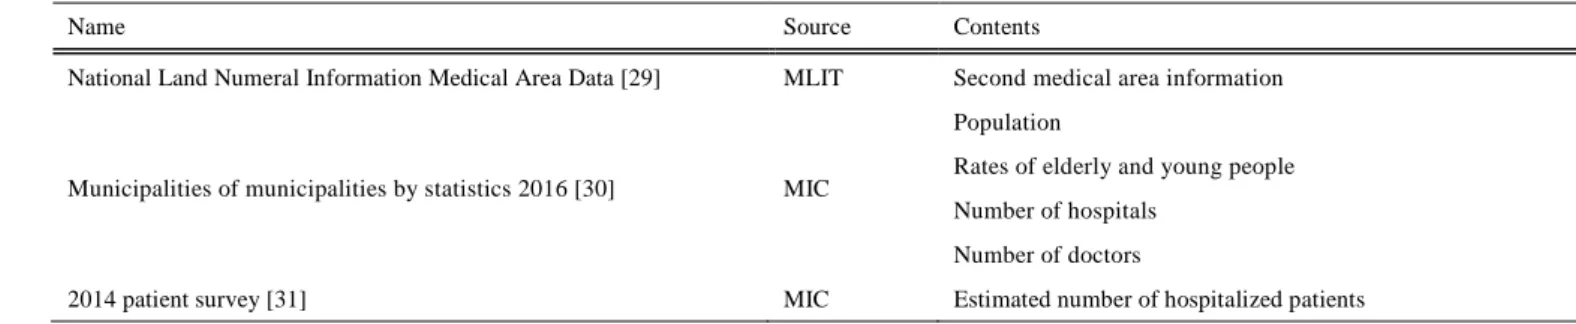
Fig. 4 shows the population rates for those aged zero to 15 Table 1 Open data list
Name Source Contents
National Land Numeral Information Medical Area Data [29] MLIT Second medical area information
Municipalities of municipalities by statistics 2016 [30] MIC
Population
Rates of elderly and young people Number of hospitals
Number of doctors
years and the population rate of people aged 65 years and over in each second medical area. In Japan, the declining birthrate and aging population is progressing, the graph shows that the rate of young people is low, and the elderly population rate is high.
Fig. 3 Inflow and outflow rate of hospitalized patients
Fig. 4 Population rates of zero to 15 years of age and population rate of people 65 years old and over
3. ANALYSIS OF SECOND MEDICAL AREA
INFORMATION USING DEA
Using the classification analysis platform and proposed improving plan, we analyze multiple elements using DEA [31-33]. We use the object features to perform an evaluation. In particular, we use the CCR model [34], which enables us to treat the task as a linear programming problem.
3.1 Formularizing the DEA CCR Model
The object the decision-making units (DMU) are denoted as 𝐷𝑀𝑈𝑗 (𝑗 = 1, 2, . . . , 𝑛). The 𝑖th input data element is 𝑥𝑖𝑗 (𝑖 =
1, 2, . . . , 𝑚), and its DEA weight is 𝜈𝑖𝑗. Similarly, the 𝑖th output
data element is 𝑦𝑟𝑗 (r = 1, 2, ..., s), and its DEA weight is 𝜇𝑟𝑗.
The formula for calculating a 𝐷𝑀𝑈𝑘 (𝑘 = 1, 2, . . . , 𝑛) as an
object is as follows.
[Primary Problem for 𝐷𝑀𝑈𝑘]
max ∑ 𝜇𝑟𝑘𝑦𝑟𝑘 𝑠 𝑟=1 s. t. − ∑ 𝜈𝑖𝑘𝑥𝑖𝑗 𝑚 𝑖=1 + ∑ 𝜇𝑟𝑘𝑦𝑟𝑗≤ 0, 𝑗 = 1,2, … , 𝑛 𝑠 𝑟=1 ∑ 𝜈𝑖𝑘𝑥𝑖𝑘= 1 m i=1 𝜈𝑖𝑘, 𝜇𝑟𝑘≥ 0, 𝑖 = 1,2, . . , 𝑚; 𝑟 = 1,2, … , 𝑠
[Dual Problem for 𝐷𝑀𝑈𝑘]
min 𝜃𝑘 s. t. − ∑ 𝑥𝑖𝑗𝜆𝑗𝑘+ 𝜃𝑘𝑥𝑖𝑘≥ 0 𝑛 𝑗=1 , 𝑖 = 1,2, … , 𝑚 ∑ 𝑦𝑟𝑗𝜆𝑗𝑘≥ 𝑦𝑟𝑘, 𝑘 = 1,2, … , 𝑛 n j=1 λjk≥ 0, 𝑗 = 1,2, … , 𝑛
The above DEA calculation for 𝐷𝑀𝑈𝑘 is performed for all
𝑘 = 1, 2, . . . , 𝑛. When the value of the objective function is 1, it is efficient, and when the value is lower than 1, the efficiency is worse. The primary problem in DEA is the constraint condition for each DMU, but in a dual problem it becomes a constraint condition of individual input and output items. From the viewpoint of efficiency improvement, we will show improvement information based on the solution to the dual problem.
3.2 Calculating the Reference Groups and Classification for DMUs
In classification analysis platform, we perform large-scale classifications. To clarify the features of the DMUs, we calculate reference groups using the following process:
(1) Calculate an objective function of the primary problem and select DMUs for which the value of the objective function is 1 as reference sets. Insert the target DMUs into the reference set table.
(2) For 𝐷𝑀𝑈𝑘 in (1) where the objective value of a DEA
problem < 1 , when the objective variables 𝜆𝑗𝑘 , (𝑗 = 1, 2, … , 𝑛) of the dual problem are 𝜆jk> 0 , we treat
𝐷𝑀𝑈𝑘 as a subordinate set of 𝐷𝑀𝑈𝑗 and include them in
the subordinate set of that reference group.
3.3 Classification Database Structure
The classification database is constructed as shown in Fig. 5. Using this structure, it is possible to perform classification calculations in the same way for any type of object. First, the information required for the classification is prepared in DMU table and DMU elements table. Next, the results of the DEA for all DMUs are stored in the combination, result, and result relation tables. When DEA calculation is performed, the calculation result uses the primary key of the combination table, and the primary
problem calculation result is stored in the primary problem table and weight table. The result of the dual problem is stored in the dual problem results table and 𝜆 table. A reference set is stored in the references table, and its subordinate set is contained in the subordination table.
Fig. 5 Classification Database Structure
4. Evaluation of the medical service
environment for second medical area
Here, we conduct the evaluation of the medical service environment for a second medical area using DEA. We calculate the reference set using DEA and determine the second medical area to serve as a model. Based on the model area, the second medical area is divided into clusters.
4.1 Dataset used in DEA
We conduct an analysis using the following items:
Inputs (Inpatient rate, Elderly people rate, Inpatient outflow rate)
Output (Doctor rate, Young people rate, Inpatient inflow rate)
Here, the inpatient rate is the number of hospitalized patients in each second medical area divided by the population. The young people rate includes those aged from 0 to 15 years and the elderly people rate includes those aged 65 years and over in each second medical area. Inpatient inflow and outflow rates are calculated for the degree of inflow and outflow of the estimated number of hospitalized patients in each second medical area in Table 1. The doctor rate is the number of physicians divided by the population. These data sets were analyzed in Section 2 (see Figs. 1 to 4).
In this case, we calculate using an input-oriented CCR model. If we can lower the inpatient and elderly population rates, we can expect that the medical service in the second medical area will improve. Additionally, lowering the inpatient outflow rate will benefit the second medical area. On the other hand, we believe that if the doctor rate, young people rates, and inpatient inflow rate are high, medical services are being provided.
4.2 Second medical area evaluation using DEA
We perform the DEA calculation on 344 second medical areas. Table 2 is a classification of the reference number of subordinate
DMU.
Table 2 Reference numbers of subordinate DMUs
No. of Elements in reference set
5 4 3 2 1
Number of DMUs 9 122 144 36 1
4.3 Indicator acquisition process for improvement of medical service provision
Here, we examine how to improve from the obtained DEA analysis result.
4.3.1 Characteristics of elected reference set
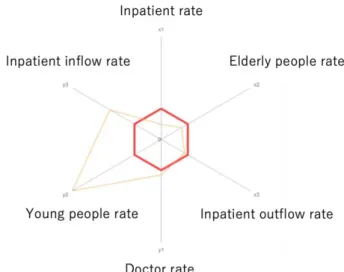
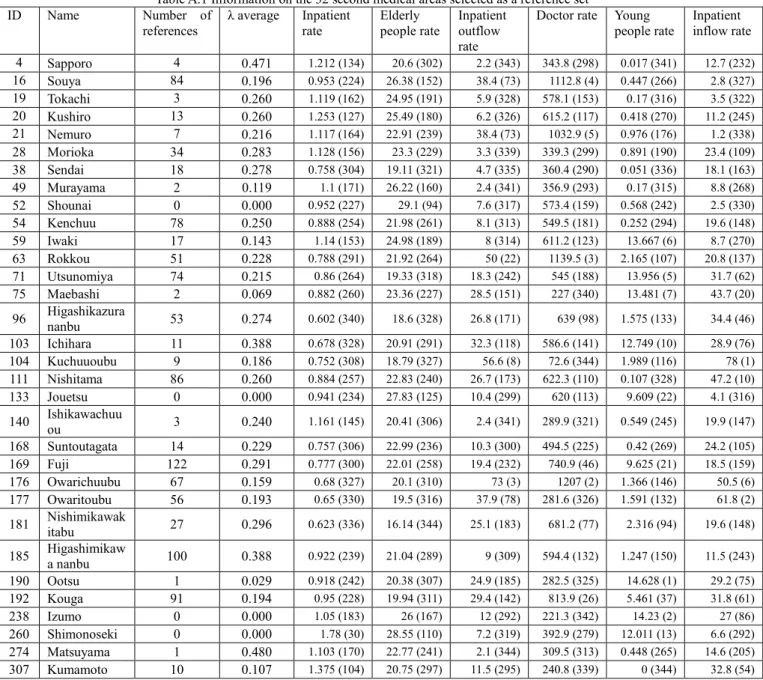
We obtain a reference set including 32 DMUs. These 32 DMUs selected as the reference set are characteristic and are second medical areas for reference. However, four of them are unreferenced sets. Therefore, we consider 28 DMUs to be referenced. 𝜆 is the reference rate from the dependent set to the reference set. The higher this value, the stronger the reference value. The 𝜆 average is the sum of the weights for the target set of the dependent set divided by the reference number. The second medical area with ID 274 has the highest 𝜆 average, 0.480. However, the number of DMUs referring to ID 274 is 1, and it is not a reference set widely affecting. So, consider ID 169 where the average value of 𝜆 s is 0.291 and is 6th and the reference number is 122, which is the 1st place. As shown in the Fig.6, the average number of input items (𝑥1, 𝑥2, 𝑥3) is small and it is
excellent. Also, the output items (𝑦1, 𝑦2, 𝑦3) are good,
especially young people rate, Inpatient inflow rate. The 32 areas selected as the reference set for this study are shown in Appendix A.
Fig. 6 Input output item of ID 169 (Compared with average value that is bold line)
4.3.2 Principal component analysis of the reference set
In order to grasp the tendency of the reference set, we carried out a principal component analysis, leaving out areas where 𝜆 was 0. From Fig. 7, we can see that the weight of the input items was high for principal component 1. The weights were as follows: inpatient rate: -0.50; elderly people rate: -0.37; and inpatient outflow rate: 0.50; the inpatient rate and elderly people rate were in the same direction. The inpatient inflow rate of pc1 was also 0.44, and the inpatient flow rate was effective. In principal component 2, the output items and weights were as follows: doctor rate: -0.67; young people rate: 0.22; inpatient inflow rate: 0.38; number of references: -0.46; and 𝜆 average: -0.23. In this analysis, as seen in Appendix A.1, ID 169, ID 192, etc., were excellent for the input items, references increased, and it was an area that was easy to reference. By category, the doctor rate and number of references were in a proportional trend, and the correlation coefficient was calculated to be 0.5. We found that areas with high doctor rates tended to be model areas. Areas with high young population and patient inflow rates (located in the upper-right corner of the figure) were distinctive areas but were difficult to reference.
Fig. 7 Result of principal component analysis
4.3.3 Improvement using reference set
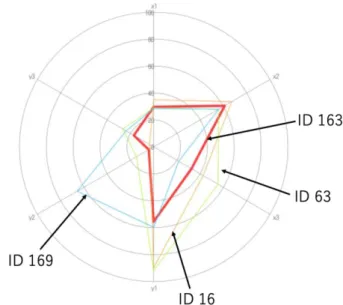
Next, we consider the process by which the second medical area utilizes the reference set to improve. As an example, the second medical area with ID 163 refers to ID 16, 63, 169. The Fig. 7 shows input output items of these four DMUs. The bold line is of ID 163, and it is understood that the second element (Young people rate, 𝑦2) of the output item is very low. Since ID 169 is a value superior to ID 163 in Inpatient outflow rate third in the input item 𝑥3 , ID 163 strongly refers mainly to input item
Inpatient outflow rate x3 and output item Young people rate y2. Also, ID 16, 63 which is the reference set shows that Doctor rate of the 1st output item y1 is excellent. ID 163 refers to these two reference sets with respect to this item. As can be seen from the In Table 3, the ID 163 strongly refers to the ID 169. Thus, we see that ID 163 should first proceed with the improvement process with reference to ID 169 widely.
Fig. 8 Comparison between ID 163 and reference sets
Table 3 The reference rate of ID 163
ID Reference rate
16 0.091
63 0.187
169 0.504
5. CONCLUSION
In this research, we conduct a basic analysis for each item. We show that there are many concerns in terms of providing medical services for each second medical area. We get that currently the service provision capacity of the second medical area varies. Although there are few areas with high inflow of patients, outflow of patients occurs in many areas. This indicates that the medical service capability concentrates in a specific area. In many areas the young generation rate is low, but the elderly population spreads at a high level. Then, to improve the medical service of the second medical area, we use DEA to calculate the reference set as a future model. As a result, we obtain a reference set including 32 DMUs that are further clarified by their dependent sets. Based on the obtained results, we show the process of acquiring the index to improve the medical services provided by a second medical area. This evaluation incorporates the young
people rate and the elderly rate. It becomes a policy index of population composition as well as medical service, using as a model a second medical area that becomes a reference set. It is possible for all second medical areas to improve medical services in the same way that shows how to aim for an effective second medical area.
ACKNOWLEDGEMENT
This work was a part of research outcomes supported by the JSPS Research Grant (KAKENHI), number 16K06659 (Principal investigator: Atsuo Kakehi).
REFERENCES
[1] MHLW, ‘‘Regional Medical Care Initiative,’’
http://www.mhlw.go.jp/stf/seisakunitsuite/bunya/0000080850.html , (2017/6/19). (in Japanese)
[2] MHLW, ‘‘About the Medical Nursing Care Comprehensive Encouragement Promotion Act,’’ http://www.mhlw.go.jp/file/05-Shingikai-10801000-Iseikyoku-Soumuka/0000052610_1.pdf, (2017/6/19). (in Japanese)
[3] MHLW, ‘‘Medical Law (July 30, 1954 law 205th),’’ https://www.mhlw.go.jp/web/t_doc?dataId=80090000, (2019/03/01). (in Japanese)
[4] MHLW, ‘‘About Revision of Medical Plan,”
http://www.mhlw.go.jp/seisakunitsuite/bunya/kenkou_iryou/iryou/i ryou_keikaku/dl/shiryou_a-1.pdf, (2017/6/19). (in Japanese) [5] Hasegawa, T., ‘‘Efficiency and Challenges of Regional medical
planning,’’ Quarterly Social Security Research, Vol. 33, No. 4, pp. 382-391 (1998).
[6] Ogawa, H. and Kubo, R., ‘‘Technical Efficiency in the Secondary Medical Service Region,’’ Iryo To Shakai, Vol. 15, No. 2, pp. 39-50 (2005). (in Japanese)
[7] Hotta, M., ‘‘Toward Building a Desirable Disaster Medical System,’’ Journal of Business Administration (Keiei ronshu), No. 78, pp.39-55 (2011). (in Japanese)
[8] Tanaka, H., ‘‘Healthcare IT System in the Midst of and After Great East Japan Earthquake Disaster Grand Design for Reconstruction of Tohoku-region Healthcare IT System,’’ Information Management, Vol. 54, No. 12, pp. 825-835 (2012). (in Japanese)
[9] Banba, M., Yoshida, Y., Nojima, N. and Okudera, H., ‘‘Development of Simulation Model for Wide Area Disaster to Evaluate Disaster Medical Conveyance System’’, Infrastructure Planning Review, Vol.25 No. 1, pp. 129-140 (2008). (in Japanese)
[10] Akiyama, Y., Nishida, Z., Hashimoto, H.: ‘‘Investigation of the Actual Health Care Area Using Diagnosis Procedure Combination (DPC) Data and Geographic Information System (GIS) in the Secondary Health Care Area’’, Kawasaki Medical Welfare Journal, Vol. 21, No. 2, pp. 254-262 (2012). (in Japanese)
[11] Momiyama, M., Kagami, M., Sato, T.: ‘‘Review of the Research on Geographical Distribution of Disease Mortality in Japan, with Particular Attention to Cerebrovascular Disease,’’ Geographical Review of Japan, Series B. Vol. 61 No. 1, pp.50-58 (1988). (in Japanese)
[12] McAfee, A., Brynjolfsson, E., Davenport, T. H., Patil, D. J., Barton, D.: ‘‘Bigdata: The Management Revolution,’’ Harvard Business Review, Vol. 90, No. 10, pp.61-67 (2012).
[13] Charnes, A., Cooper, W.W. and Rhodes, E.: ‘‘Measuring Efficiency of Decision Making Units,’’ European Journal of Operational Research, Vol. 2, pp.429-444 (1978).
[14] Banker, R. D., Charnes A. and Cooper W. W., “Some Models for Estimating Technical and Scale Inefficiencies in Data Envelopment Analysis,’’ Management science Vol. 30, No. 9, pp.1078-1092 (1984).
[15] Charnes, A., Cooper, W.W, Golany, B. and Seiford, L., ‘‘Foundations of Data Envelopment Analysis for Pareto-Koopmans Efficient Empirical Production Functions,’’ Journal of econometrics, Vol. 30, No. 1-2, pp. 91-107 (1985).
[16] Charnes, A., Cooper, W.W, Seiford, L. and Stutz, J., ‘‘A Multiplicative Model for Efficiency Analysis,’’ Socio-Economic Planning Science, Vol. 16, No. 5, pp. 223-224 (1982).
[17] Charnes, A., Cooper, W.W., Seiford, L. and Stutz, J., ‘‘Invariant Multiplicative Efficiency and Piecewise Cobb-Douglas Envelopments,’’ Operations Research Letters, Vol. 2, No. 3, pp. 101-103 (1983).
[18] Charnes, A., Cooper, W. W., Wei, Q. L. and Huang, Z. M.: ‘‘Cone Ratio Data Envelopment Analysis and Multi-Objective Programming,’’ International Journal of Systems Science, Vol. 20, No. 7, pp. 1099-1118 (1989).
[19] Charnes, A., ‘‘Polyhedral Cone-Ratio DEA Models and Managerial Performance of Large Commercial Banks,'' Journal of Econometrics, Vol. 46, pp.73-91 (1990).
[20] Thompson, R. G., Singleton Jr., F. D., Thrall, R. M. and Smith, B. A., ‘‘Comparative Site Evaluations for Locating a High-energy Physics Lab in Texas,’’ Interfaces, Vol. 16, No. 6, pp. 35-49 (1986). [21] Thompson, R. G., Langemeier, L. N., Lee, C.-T, Lee, E. and Thrall, R. M., ‘‘The Role of Multiplier Bounds in Efficiency Analysis with Application to Kansas Farming,’’ Journal of econometrics, Vol. 46, No. 1-2, pp. 93-108 (1990).
[22] Chang, Y.-L. and Sueyoshi, T., ‘‘An Interactive Application of Data Envelopment Analysis in Microcomputers,’’ Computational Economics, Vol. 4, No. 1, pp.51-64 (1991).
[23] Sueyoshi, T., ‘‘A Special Algorithm for an Additive Model in Data Envelopment Analysis,’’ Journal of the Operational Research Society, Vol. 41, Issue 3, pp.249-257 (1990).
[24] Sueyoshi, T., ‘‘Algorithmic Strategy for Assurance Region Analysis in DEA,’’ Journal of the Operations Research Society of Japan, Vol. 35, No. 1, pp.62-76 (1992).
[25] Sueyoshi, T.: ‘‘Measuring Technical, Allocative and Overall Efficiencies Using a DEA Algorithm,’’ Journal of the Operational Research Society, Vol. 43, Issue 2, pp.141-155 (1992).
[26] Phillips, F., Parsons, R. G. and Donoho, A., ‘‘Parallel Microcomputing for Data Envelopment Analysis,’’ Computers, Environment and Urban Systems, Vol. 14, No. 2, pp.167-170 (1990). [27] Sueyoshi, T. and Honma, T., ‘‘DEA Network Computing in
Multi-stage Parallel Processes,’’ International Transactions in Operational Research, Vol. 10, No. 3, pp.217-244 (2003). [28] Mizuno, S., Fujisawa, Y. and Yamaki, N., ‘‘Construction of a
Comprehensive Analysis Platform for Typology and its Application,’’ Journal of Japan Industrial Management Association, Vol. 68 No. 2, pp.99-108 (2017). (in Japanese)
[29] MLIT: ‘‘National Land Numeral Information Medical Area Data (End data:2013/12/31),
’’http://nlftp.mlit.go.jp/ksj/gml/datalist/KsjTmplt-A38.html, (2017/6/9).
[30] MIC: ‘‘Municipalities of Municipalities by Statistics 2016,’’ http://www.stat.go.jp/data/s-sugata/(2017/6/9).
[31] MIC: ‘‘2014 patient survey,’’
http://www.e-stat.go.jp/SG1/estat/List.do?lid=000001141597 (2017/6/9).
[32] Sekitani, K., ‘‘A Two-stage Approach for Russel Measure in DEA,’’ Surikaisekikenkyusho-kokyuryoku, No. 1629, pp.152-163 (2009). (in Japanese)
[33] Charnes, A., Cooper, W.W., Lewin and A.Y., Seiford, L.: Data Envelopment Analysis: Theory, methodology, and applications, Springer (1994).
[34] Sugiyama, M. and Yamada, Y.: ‘‘Data Envelopment Analysis Using Virtual DMU as Intermediates: An Application to Business Analysis
of Japan’s Automobile Manufacturers,’’ Journal of Japan Industrial Management Association, Vol. 50, No. 6, pp. 341-354 (2000). [35] Tone, K., Management Efficiency Measurement and Improvement
by the Comprehensive Analysis Method DEA, Nikkagiren Shuppansha (1993). (in Japanese)
Appendix A The 32 areas selected as the reference set
Table A.1 Information on the 32 second medical areas selected as a reference set
ID Name Number of
references λ average Inpatient rate Elderly people rate Inpatient outflow rate
Doctor rate Young
people rate Inpatient inflow rate
4 Sapporo 4 0.471 1.212 (134) 20.6 (302) 2.2 (343) 343.8 (298) 0.017 (341) 12.7 (232) 16 Souya 84 0.196 0.953 (224) 26.38 (152) 38.4 (73) 1112.8 (4) 0.447 (266) 2.8 (327) 19 Tokachi 3 0.260 1.119 (162) 24.95 (191) 5.9 (328) 578.1 (153) 0.17 (316) 3.5 (322) 20 Kushiro 13 0.260 1.253 (127) 25.49 (180) 6.2 (326) 615.2 (117) 0.418 (270) 11.2 (245) 21 Nemuro 7 0.216 1.117 (164) 22.91 (239) 38.4 (73) 1032.9 (5) 0.976 (176) 1.2 (338) 28 Morioka 34 0.283 1.128 (156) 23.3 (229) 3.3 (339) 339.3 (299) 0.891 (190) 23.4 (109) 38 Sendai 18 0.278 0.758 (304) 19.11 (321) 4.7 (335) 360.4 (290) 0.051 (336) 18.1 (163) 49 Murayama 2 0.119 1.1 (171) 26.22 (160) 2.4 (341) 356.9 (293) 0.17 (315) 8.8 (268) 52 Shounai 0 0.000 0.952 (227) 29.1 (94) 7.6 (317) 573.4 (159) 0.568 (242) 2.5 (330) 54 Kenchuu 78 0.250 0.888 (254) 21.98 (261) 8.1 (313) 549.5 (181) 0.252 (294) 19.6 (148) 59 Iwaki 17 0.143 1.14 (153) 24.98 (189) 8 (314) 611.2 (123) 13.667 (6) 8.7 (270) 63 Rokkou 51 0.228 0.788 (291) 21.92 (264) 50 (22) 1139.5 (3) 2.165 (107) 20.8 (137) 71 Utsunomiya 74 0.215 0.86 (264) 19.33 (318) 18.3 (242) 545 (188) 13.956 (5) 31.7 (62) 75 Maebashi 2 0.069 0.882 (260) 23.36 (227) 28.5 (151) 227 (340) 13.481 (7) 43.7 (20) 96 Higashikazurananbu 53 0.274 0.602 (340) 18.6 (328) 26.8 (171) 639 (98) 1.575 (133) 34.4 (46) 103 Ichihara 11 0.388 0.678 (328) 20.91 (291) 32.3 (118) 586.6 (141) 12.749 (10) 28.9 (76) 104 Kuchuuoubu 9 0.186 0.752 (308) 18.79 (327) 56.6 (8) 72.6 (344) 1.989 (116) 78 (1) 111 Nishitama 86 0.260 0.884 (257) 22.83 (240) 26.7 (173) 622.3 (110) 0.107 (328) 47.2 (10) 133 Jouetsu 0 0.000 0.941 (234) 27.83 (125) 10.4 (299) 620 (113) 9.609 (22) 4.1 (316) 140 Ishikawachuuou 3 0.240 1.161 (145) 20.41 (306) 2.4 (341) 289.9 (321) 0.549 (245) 19.9 (147) 168 Suntoutagata 14 0.229 0.757 (306) 22.99 (236) 10.3 (300) 494.5 (225) 0.42 (269) 24.2 (105) 169 Fuji 122 0.291 0.777 (300) 22.01 (258) 19.4 (232) 740.9 (46) 9.625 (21) 18.5 (159) 176 Owarichuubu 67 0.159 0.68 (327) 20.1 (310) 73 (3) 1207 (2) 1.366 (146) 50.5 (6) 177 Owaritoubu 56 0.193 0.65 (330) 19.5 (316) 37.9 (78) 281.6 (326) 1.591 (132) 61.8 (2) 181 Nishimikawakitabu 27 0.296 0.623 (336) 16.14 (344) 25.1 (183) 681.2 (77) 2.316 (94) 19.6 (148) 185 Higashimikawa nanbu 100 0.388 0.922 (239) 21.04 (289) 9 (309) 594.4 (132) 1.247 (150) 11.5 (243) 190 Ootsu 1 0.029 0.918 (242) 20.38 (307) 24.9 (185) 282.5 (325) 14.628 (1) 29.2 (75) 192 Kouga 91 0.194 0.95 (228) 19.94 (311) 29.4 (142) 813.9 (26) 5.461 (37) 31.8 (61) 238 Izumo 0 0.000 1.05 (183) 26 (167) 12 (292) 221.3 (342) 14.23 (2) 27 (86) 260 Shimonoseki 0 0.000 1.78 (30) 28.55 (110) 7.2 (319) 392.9 (279) 12.011 (13) 6.6 (292) 274 Matsuyama 1 0.480 1.103 (170) 22.77 (241) 2.1 (344) 309.5 (313) 0.448 (265) 14.6 (205) 307 Kumamoto 10 0.107 1.375 (104) 20.75 (297) 11.5 (295) 240.8 (339) 0 (344) 32.8 (54)