C14
GCM 出力の解像度が積雪水量推定に及ぼす効果
Effect of the Resolution of GCM Output on the Snow Water Equivalent Estimation
〇田中賢治・松井佑介・田中茂信・浜口俊雄
〇Kenji TANAKA, Yusuke MATSUI, Shigenobu TANAKA, Toshio HAMAGUCHI
Various kinds of GCM output are provided in the SOUSEI program. Comparing from 20km model, 60km GCM has many number of ensemble members. Although 60km is relatively high resolution in GCMs, complex topography in Japan region is not well resolved. As the evaluation of snow water amount is crucial for assessing the impact of climate change on water resources, effect of the resolution of GCM output on the snow water equivalent estimation is investigated by the land surface model’s output driven by original (20km) resolution and up-scaled (60km) resolution. Annual maximum SWE ratio by 60km-scale analysis and 20km-scale analysis is explained by winter season’s precipitation, standard deviation of sub-grid scale elevation, and precipitation weighted average winter season’s temperature from multiple regression analysis with determination coefficient of 0.87 for middle (300-800m) elevation zone.
1.はじめに 日本の積雪地域では、「天然のダム」と言われて いるように、雪は貴重な水資源となっており、灌 漑用水、生活用水または発電用水等の重要な供給 源とされている。温暖化等の気候変動に伴う降雪 量・積雪量の減少や融雪時期の早期化は,下流域 の灌漑用水に大きな影響を及ぼすことが懸念され ており、水資源分野においては,特に積雪水量の 将来予測が重要視されている。 気候変動リスク情報創生プログラムでは、気象 庁で開発された気候モデルを用いた温暖化予測や 気候変動に伴う影響の評価に関する研究が幅広い 分野にわたって行われている。データ提供されて いる気候モデルには、MRI-AGCM3.2H(60km)、 MRI-AGCM3.2S(20km)、NHRCM(5km)といっ た様々な解像度のモデルがあり、解像度 20km、 5km のモデルは計算コストが高く、アンサンブル 数は少ないが、60km の GCM は複数の RCP シナ リオ、積雲対流スキーム、海面温度条件、初期値 を組み合わせた多くのアンサンブル数がある。 将来予測の不確実性を考慮すると、温暖化影響 評 価 に は 多 く の ア ン サ ン ブ ル 情 報 を 持 つ 60kmGCM を活かした解析が有効である。60km という解像度は世界の他機関のGCM に比べてか なり高解像度ではあるが、日本のような起伏が激 しい地域においては、地形を十分に考慮できてい ない。そこで,60kmGCM のアンサンブル情報の 有効活用を目的として,粗い解像度のGCM 出力 を用いることにより,どのような情報が失われて しまうのか,それにより,陸面過程解析による積 雪水量の算定結果にどのような影響を与えるのか について詳細に検討する. 2.手法 MRI-AGCM3.2S から出力される気象強制力 7 要素(気温、比湿、降水量、下向き短波放射、下 向き長波放射、大気圧、風速)を60km スケール (3×3)にアップスケーリングし、20km 解像度 の陸面過程モデル SiBUC に入力した時に算定さ れる年最大9 メッシュ平均積雪水量が、元の 20km スケール情報を入力した算定結果とどのような差 が生じるのか、またどのような9 メッシュで差が 生じるのかを分析する。降水の気温による相変化 (雨か雪か)は積雪水量算定に大きく影響するた め、特に、9 メッシュ内の標高の分散や絶対値、 また60km スケールにアップスケーリングした後 の情報に着目して分析する。20km スケールの入 力による解析結果を真値と仮定し、どの情報を用 いると60km スケールの入力による解析結果が真 値に近づくのかを分析し、60kmGCM による解析 結果の有効な補正方法を検討する。解析期間は現 在気候下(1979~2003 年)、対象領域は日本全域 とする。
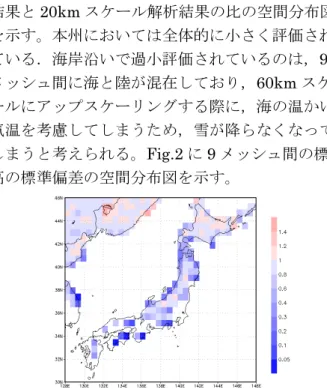
3. 結果と考察 Fig.1 に年最大積雪水量の 60km スケール解析 結果と20km スケール解析結果の比の空間分布図 を示す。本州においては全体的に小さく評価され ている.海岸沿いで過小評価されているのは,9 メッシュ間に海と陸が混在しており,60km スケ ールにアップスケーリングする際に,海の温かい 気温を考慮してしまうため,雪が降らなくなって しまうと考えられる。Fig.2 に 9 メッシュ間の標 高の標準偏差の空間分布図を示す。
Fig.1 Ratio of annual maximum SWE by 60km- scale analysis to 20km-scale analysis
Fig.2 Standard deviation of grid elevation among 9 grids in 60km-grid 20km スケール解析においては、標高のばらつ きに応じて雨と雪を降らせているが、アップスケ ーリングをすると、ばらつきの情報が失われ、雪 が雨に変化してしまい、積雪水量が過小評価され る場合が多いと考えることができる。標高の標準 偏差が大きい9 メッシュほどそれが起こりやすい。 また、降水時の気温も重要な情報であり、降水量 が多い時間の気温がより考慮されるように、11~3 月を積雪期とし,積雪期における降水量で重みを 付けた平均気温を以下の式で求めた。 * t t t s t t T P T P =
∑
∑
(1) ここで、t
は時間単位[hr]、T
sは降水量重み付き 積雪期平均気温[℃]、T
は気温[℃]、P
は降水量 [mm]である。Fig.3 に示すようにT
sと解析結果の 比は負の相関性がある。本来、標高のばらつきに 従って気温も分布しており、雨雪を区別すること ができるが、アップスケーリングの結果,雨雪判 別の臨界温度を超えてしまうと過小評価される。 sT
が高い9 メッシュでは、アップスケーリングに よる臨界温度超過の可能性が高くなるため,負の 相関性があると考えられる。 標高のばらつきが雨雪変化に作用しやすい9 メ ッシュ平均標高が300~800m の中標高グループ において、年最大9 メッシュ平均積雪水量の 20km 解析結果に対する60km 解析結果の比を被説明変 数、9 メッシュ間標高標準偏差、積雪期降水量、 降水量重み付き積雪期平均気温を説明変数にして 重回帰分析を行った結果、決定係数は0.87 となっ た。各変数の係数とP 値を Table 1 に示す。Fig.3 Relationship between precipitation weighted average winter season’s temperature and annual maximum SWE ratio(60km/20km)
Table 1 Result of multiple regression analysis
4.まとめ 標高のばらつきによって雨雪が変化しやすい中 標高では,解析結果の比を積雪期降水量,9 メッ シュ間標高標準偏差,降水量重み付き積雪期平均 気温の情報を用いて,ある程度説明できる。 coefficient P-value intercept 0.628797 1.6E-100 Winter season’s precipitation[mm] 0.000349 3.92E-38
Standard deviation of grid
elevation among 9 grids [m] -0.00108 2E-28 precipitation weighted
average winter season’s temperature [℃]