Introduction:
Socio-Economic Dynamics in a Tank-Irrigated Rural Area
in Contemporary Tamil Nadu, India
F
UJITAKoichi*
AbstractAfter reviewing the major socio-economic changes occurring during the last 40 years or so in the study area of this special issue, namely, the Madurai District, Tamil Nadu, this introduction contextualizes the five papers that follow. The major socio-economic changes include 1) the high economic growth and the preceded rapid increase in food (rice and coarse cereals) production in the state and the district, 2) the technological changes in agriculture (mainly the development of well irrigation and the diffusion of agri-cultural machineries such as power tillers/tractors and combine-harvesters), 3) the development of major government policies and programs in the state such as the Public Distribution System, the Self-Help Group program, the National Rural Employment Guarantee Scheme, and others.
Keywords: Tamil Nadu, socio-economic changes, Green Revolution, government programs
Introduction
This is an in-depth introduction to the special issue on “Socio-Economic Dynamics in a Tank-Irrigated Rural Area in Contemporary Tamil Nadu, India.” We will focus mainly on the Madurai District in Tamil Nadu, which is a tank-irrigated rural area typical of the state. Before contextualizing the five articles included in this special issue this introduction presents the current socio-economic situation of the study area, with some historical background.
I Process of Socio-Economic Change in the Madurai District
I-1. Economic Growth and Food Production
Globalization has drastically transformed rural India, bringing about rapid economic development and urbanization within the country. It seems there are largely two sources of change: technological change
* 藤田幸一,Center for Southeast Asian Studies, Kyoto University e-mail: [email protected]
in agriculture, especially in the staple cereal production sector (the “Green Revolution”), often triggered by the introduction of groundwater irrigation in the Indian context; and the development of non-agricultural sectors with increased availability of remunerable non-farm employment opportunities for the rural workforce, including former agricultural laborers.
A review of recent economic development in India shows that technological change in agriculture, especially food production, became “saturated” by the early 1990s. As is well known, the “Green Revolution” in India started in the mid-/late-1960s, mainly in north India (Punjab, Haryana, and western Uttar Pradesh), leading to food self-sufficiency by the end of the 1970s. However, this first phase of the “Green Revolution,” mainly in north India, did not greatly contribute to raising rural living standards in the country as a whole since it was largely confined to the wheat crop and relatively small rural areas. In contrast, the second phase of the “Green Revolution,” which mainly occurred in the 1980s and covered almost all the major crops (including rice) and almost all rural India, did have a substantial impact on raising rural income.1) The reduction of poverty in rural India in the 1980s was, therefore,
an important pre-requisite for accelerated economic growth led by the non-agricultural sectors since the mid-1990s.2) This was because rural India provided a good market for the commodities and services
for such emerging and developing non-agricultural sectors [Fujita 2010]. Hence, along with the “success” of economic liberalization policies implemented since 1991, the Indian economy started to grow very fast, led by the growth of non-agricultural sectors, and it provided a lot of, though not enough, job opportunities for the rural workforce. This accelerated shift of the labor force from agriculture to non-agricultural sectors resulted in a substantial rise in non-agricultural wages, which in turn facilitated the re-structuring of agricultural production systems. At the same time, however, after the mid-1990s, whereas the economic growth rate in India as a whole accelerated, the agricultural sector started to stagnate at around 2–2.5% per annum. This resulted in a rapidly widening disparity between rural and urban areas.3)
If we turn our attention to the situation of Tamil Nadu, we note that the average growth rate of Net State Domestic Product (NSDP) during 1994/95–2006/07 was 6.1% per annum, but the agricultural sector (including forestry and fisheries) grew at only 2.5%, which more or less coincided with the
1) Note that the “Green Revolution” benefitted not only land owners and owner farmers but also rural households in general, including agricultural laborers. This was because among others, there were various linkage effects among different sectors, such as backward linkage, forward linkage, and most importantly the “final demand effect” of the “Green Revolution.”
2) After the mid-1990s, the overall economic growth rate in India jumped to 6–7% per annum on average. 3) According to the Planning Commission [2008: viii], “One of the most disappointing features of the Ninth Plan
was the deceleration in agricultural growth which set in after the mid-1990s with GDP in agriculture growing at only around 2% per annum after growing at 3.6% per annum between 1980 to 1996.”
movement in India as a whole. Therefore, the share of agriculture in NSDP declined sharply from 25.6% (1993/94) to 13.2% (2007/08).4) Moreover, the agricultural growth rate fluctuated substantially and
recorded negative growth during 2001/02–2003/04 due to severe droughts. These droughts resulted in serious damage to state agriculture and its rural economy, especially in semi-arid tank-irrigated areas including the Madurai District.
On the other hand, the farm household income data collected during the period 1971–2003 under the Cost and Cultivation of Principal Crops (CCPC) scheme in Tamil Nadu showed that since the mid-1990s a sharp increase was observed in non-farm income vis-à-vis farm income for the sample farm households [Kajisa and Palanichamy 2006]. This indicates that it was after the mid-1990s when the development of non-agricultural sectors started to affect rural areas more directly in Tamil Nadu.
Fig. 1 shows the trend of rice production in the state. First, from the 1980s to the end of the 1990s, the “Green Revolution” in rice production made progress in Tamil Nadu.5) The yield per hectare (milled
rice) increased from 2 to 3.5 tons during this period, but started to show a declining trend after the year 2000. Second, the sown area also started to decrease after the year 2000.6) It is further evident from
4) The tertiary sector increased its share from 41.6% to 60.6% while the secondary sector decreased from 32.2% to 25.9% during the same period.
5) As shown in Fig. 1, the first wave of the “Green Revolution” occurred in the late-1960s. 6) As shown in Fig. 1, the decline of sown area of rice began during the 1980s.
Fig. 1 Rice Production Trend in Tamil Nadu
the data that the damage from the droughts in the early part of the decade was very serious because rice production in 2003/04 recorded the lowest figure in the last half a century. On the other hand, if we focus on the situation of the Madurai District (Fig. 2), we can discern that the declining trend of sown area of rice was similar to the state as a whole, but the yield was always higher than the state average and recorded 5 tons/ ha at its peak in the late-1990s.
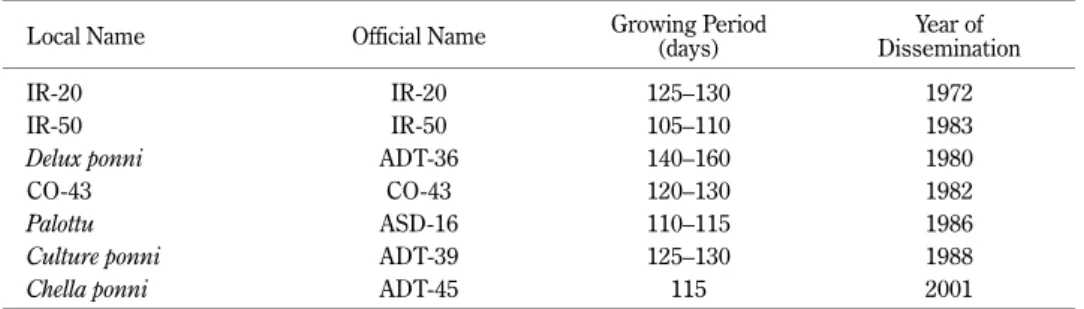
The declining trend of rice yield after the year 2000, on the other hand, seems to be related to the shift in rice varieties to more drought-tolerant and/or consumer-preferable ones. Table 1 lists the major rice varieties grown in the state. Our field surveys in rural Madurai District during 2006–10 revealed that the introduction of varieties developed in the International Rice Research Institute (IRRI), such as IR-8, IR-20, and IR50, was attributed to the “Green Revolution” achieved in the area during the 1980s. And it was followed by the introduction of varieties developed at Tamil Nadu Agricultural Uni-versity, such as CO-43, which raised rice yield even further by the late-1990s. However, after the mid-1990s, varieties such as Culture ponni (ADT-39), Delux ponni (ADT-36), and Palottu (ASD-16) became more widespread, and they were more drought-tolerant and/or high-priced, but with a lower yield.7) 8)
Fig. 2 Trend of Sown Area and Yield of Rice Production
Source: GoT [2006; 2009].
Note: The unit is kg/ha for yield, ’000 ha for area sown in Tamil Nadu, but ’00 ha for the Madurai District.
7) Palottu is preferred by farmers especially during water shortage years as it is the most drought-tolerant among the three varieties, and is suitable for idly and dosa making. Culture ponni, which is also a drought-tolerant variety and requires smaller amounts of chemical fertilizers, was adopted by many farmers. It is also good for
idly and dosa making. On the other hand, Delux ponni is known for being a fine rice and is best for cooking biryani. But it requires more water because of its longer growing period. The market price of paddy per bag
in September 2010 was; Rs.900 for Delux ponni, Rs.700 for Culture ponni and Rs.650 for Palottu. Note that Rs.1 was roughly equivalent to 2 yen in the late-2000s.
Now, let us look at the production trend of coarse cereals in the Madurai District (Fig. 3). Coarse cereals here include sorghum (cholam), pearl millet (cumbu), finger millet (ragi), as well as other major coarse cereals except maize.9) First, the sown area of coarse cereals was almost the same as that of rice
in the late-1970s, but declined rapidly afterwards and reached less than 100,000 hectares by the middle of the first decade of the 21stcentury. Second, the yield of coarse cereals increased from the mid-1980s
until the late-1990s, but started to decline thereafter. According to our field survey in rural Madurai District in 2008, villagers used to eat coarse cereals as staple foods roughly until the end of the 1980s. Recently, production decreased to less than 100,000 tons, one-fourth of rice production, and is mainly used for animal feed or processed food.10) In the meantime, the quality of ration rice under the Public
Distribution System (PDS) improved substantially after the beginning of 2000s decade and most of the rural people started to consume ration rice, and the substitution of coarse cereals with rice appears to have been completed. It seems that the two decades from the early-1980s until the early part of the 2000s was a period of gradual but steady substitution of coarse cereals with rice as a staple food in rural Tamil Nadu.
Table 1 Major Rice Varieties in Tamil Nadu
Local Name Official Name Growing Period(days) DisseminationYear of
IR-20 IR-20 125–130 1972
IR-50 IR-50 105–110 1983
Delux ponni ADT-36 140–160 1980
CO-43 CO-43 120–130 1982
Palottu ASD-16 110–115 1986
Culture ponni ADT-39 125–130 1988
Chella ponni ADT-45 115 2001
Source: Subramanian et al. [2005].
8) According to our interview with a farmer in a village in the Madurai District in 2010, IR-20 was the most popu-lar IRRI variety. When the farmer introduced IR-20 (replacing local variety named Sandial) in 1989, the yield per acre jumped from 14 bags (equivalent to 2.4 tons/ha) to 36 bags (6.2 tons/ha). In 1992 he introduced CO-43 and got 42 bags (7.3 tons/ha), which was the peak in his yield record. Then in 1995, when he introduced Delux
ponni, he got only 30 bags (5.2 tons/ha), followed by the introduction of Culture ponni in 2001 with 30 bags.
After that, he continued to grow Culture ponni and its yield has remained unchanged until 2007.
9) Maize was a minor crop until the late-1980s in the Madurai District, but started to increase rapidly thereafter. By the middle of the first decade of the 21stcentury, there were more than 40,000 hectares of sown area and
80,000 tons of production in the district, almost the same as the total production of major coarse cereals. Maize production was stimulated by an increase in demand for poultry feed.
10) According to our field surveys, cholam is powdered and utilized to make processed food such as biscuits. It is also used as feed for poultry or cows. Cumbu, by contrast, is boiled and crushed, and used as feed for cows and buffalo. However, some villagers told us that they still sometimes eat cumbu for the sake of their health.
I-2. Technological and Institutional Change in Agriculture
Based on information obtained through field surveys during 2006-10 in rural Madurai District, the following section summarizes the major technological changes in agriculture which have occurred in the study area (Fig. 4).
(1) Irrigation
During the 1950s, nearly 40% of the net irrigated area in Tamil Nadu was irrigated by tanks,11) but this
has been reduced to less than 20% in recent years, while the share of wells has increased from around 25% to nearly 50% [Palanisami and Ester 2000: 28].
The history of digging open wells for irrigation in the study area started long ago, even before the British colonial regime. These were usually large, roughly 10 meters in diameter. For many years, groundwater was extracted by means of bullock power. The irrigation efficiency was so low that the wells were used just for supplementary purposes in tank-irrigation or for irrigating a small patch of dry land to grow high-valued cash crops such as oil seeds. But since the early 1970s, energized (usually electricity-operated) pumps spread and irrigation efficiency increased sharply. This in turn brought
Fig. 3 Trend of Coarse Cereals Production in the Madurai District
Source: GoT [2006; 2009].
11) The interruption of the southwest monsoon by the Western Ghats Mountains makes the climate of south India semi-arid, except for the Maravar coasts. Tanks for irrigating paddy fields have been a common feature of the south Indian cultural landscape. In Tamil Nadu there are more than 39 thousand tanks at present, many of which were built in the 18th and 19th centuries by kings and zamindars, and even under British rule [Palanisami and
Fig. 4 Major Incidents and Policies in Tamil Nadu
Source: Prepared by the author. Note: DMK: Dravida Munnetra Kazhaga
about a rapid decline in the groundwater level and depletion of water inside open wells. Digging deeper and deeper wells thus started soon after the introduction of energized pumps. And finally, bore-well drilling from the bottom of open bore-wells also started along with the proliferation of tube-bore-wells.12)
Bore-/tube-wells expanded not only in tank-command areas (nañcai) but also in dry land (puñcai(( ). With the rapid increase in the number of energized pumps, well irrigation became more and more important. By the end of the 1980s, the electrification of wells was more or less completed in the study area. Electricity for agricultural purposes was at first charged according to volumes actually consumed by farmers (measured by meters), but in 1987 it became free of charge in Tamil Nadu,13)which encouraged
the over-exploitation of groundwater. As the groundwater level went down, farmers (with wells) were obliged to drill deeper bore-/tube-wells. According to a professional well driller working in a company in Peraiyur town (in the Madurai District) interviewed in February 2007, the drilled depth increased from 100–150 feet in 2000 to 300 feet in 2007 in his working area.14)
(2) Deterioration of Informal Tank Institution
Large differences in the performance of informal tank institutions in the study area were observed, often differing village by village. However, according to information obtained through our field surveys, the serious deterioration of tank institutions started in the mid-1990s. The most fundamental reason lay in the development of non-agricultural sectors, which has been strongly felt in rural areas since then, and was also aggravated by the drought in 1995. Later, 3 years of continuous, severe droughts during 2001/02–2003/0415) eroded the work incentives of the water turners (Neerkattis(( ), who had been playing
a vital role in tank management under a hereditary system (as will be argued later). Many Neerkattis stopped working amidst the severe droughts. Of course as non-agricultural sectors developed and the wage rate soared, some Neerkattis had already started to seek other remunerable jobs in the village or surrounding places. But the severe droughts led many Neerkattis to the final decision to quit their
12) Bore-wells are different from tube-wells in the sense that they are built by “boring” the ground. 13) See Sato and Periyar Ramasamy [2011] in this special issue for more detail.
14) One example showed that a farmer with an open well (dug in 1966) with a depth of 40 feet, dug another 12 feet in 1990, followed by an additional 12 feet (1994), 13 feet (1996), 15 feet (1998) and 15 feet (2003), before he finally introduced a bore-well by trying to drill in three directions from the bottom of the open well with 100 feet each (Interviewed in February 2007 in a village in the Madurai District).
15) In the study area, in 3–5 years out of every 10 a tank fails (with no water at all), and in 2 of those years a tank under-performs (with insufficient water for irrigation). In other words, only once in 3–5 years does a tank perform well. The effect of the severe droughts experienced during the first half of the 2000s was tremendous because many farmers became disappointed and finally decided to abandon farmland (including in tank-command area), which remained fallow. This resulted in the intrusion of a thorny shrub called Prosopis juliflora into farmland.
traditional occupation, especially in the lower part of the river basins where less sufficient water is available for tanks.
There were at least two other major reasons why informal tank institutions started to deteriorate seriously since the mid-1990s.16) First, land prices started to rise sharply after the year 2000 and many
urban-based housing developers started to occupy land (illegally) even in relatively pure rural areas, expecting further surges in land prices.17) The occupied land is often located in the foreshore of tanks
and thereby blocked water supply to the tanks. Second, there was an increasing trend of renting-in (or mortgaged-in) farmland, especially by the scheduled caste (SC) people, which made tank water manage-ment more difficult, because small numbers of large and medium sized owner farmers were increas-ingly replaced by large numbers of small tenant farmers in the tank-command area. In cases where
Neerkattis themselves rented-/mortgaged-in land, the situation became worse because tanks often lost
their water-turners.
(3) Diffusion of Agricultural Machineries
According to our field surveys, tractors/power tillers started to spread throughout the study area in the early 1980s, replacing bullocks. The custom of plowing farmland by bullocks finally disappeared in the mid-1990s.18) Further, combine-harvesters were introduced for rice harvesting in 2004 in the study area
and spread very rapidly after that.
The wages for rice harvesting (including threshing) used to be paid to laborers in kind. According to our survey in June 2007, 4 marakkals (a marakkal is a local unit of capacity; 1 marakkal equals 4.25–4.50 kg of paddy19)) of paddy were paid per day of work in January 2007, whereas it had been 3
marakkals before 2002 and 2 marakkals before 1997; that is, the wage rate for rice harvesting doubled in
terms of paddy during the last 10 years. Note that the paddy price in 2007 was Rs.400 per bag (Rs.5.8/kg), indicating that the daily wage rate can be estimated at around Rs.100 in that year.20) According to our
estimate, to finish rice harvesting (including threshing) 17 man-days were necessary per acre. If laborers were paid 4 marakkals of paddy (Rs.100) per day, the total labor cost would reach Rs.1,700 per acre (Rs.1,275 in cases of 3 marakkals). On the other hand, if farmers used a combine-harvester, Rs.1,100–
16) Another basic factor which caused the deterioration of informal tank institutions was the introduction of private wells, because private wells enabled farmers to reduce their dependency on tanks [Kajisa et al. 2007]. 17) For example, an interviewed farmer explained that the price of farmland (naňcai) per acre surged from Rs.6,000
in 2004 to Rs.13,000 in 2007, Rs.60,000 in 2009 and Rs.100,000 in 2010.
18) But note that many farmers still used bullocks for leveling paddy fields after plowing once or twice by tractors/ power tillers.
19) Four (4) paddis is equivalent to 1 marakkal and 15 marakkals is equivalent to 1 bag. 20) It was almost the same as the agricultural wages for men in other seasons.
1,600 was charged per acre, and they had to hire 4 women laborers to harvest the edges of paddy fields (which could not be harvested by machinery), which cost Rs.280. Thus, the total cost was Rs.1,380– 1,880, slightly higher than the cost of manual harvesting. However, considering the time-saving benefits of combine-harvesters, farmers rapidly increased their use in the study area.
I-3. Expansion of Non-farm Job Opportunities
There has been an accelerated expansion of non-agricultural job opportunities in the study area, espe-cially since the mid-1990s. However, a review of the history of the area shows that the migration of people from rural to urban areas had already begun as early as the 1920s or the 1930s, with the Brahmins migrating to urban areas for white-collar jobs as lawyers, doctors, military personnels, and bureaucrats [Yanagisawa 1996]. They were the major landowning class and sold their land mainly to people of the next-highest caste. As shown in detail by Sato [2011] in this special issue, one can observe from rural villages a lot of migrants to urban areas at present, engaging not only in white-collar jobs but also in blue-collar jobs and other daily labor. The wage rates of blue-collar workers (in factories, restaurants, car workshops, bus service companies, etc.) were almost the same as the daily agricultural or con-struction labor wages, but their advantage was that they were almost fully employed throughout the year. By contrast, if one obtained some white-collar jobs either in the public or private sector, he/she could enjoy a very high and stable salary with various kinds of fringe benefits. However, without great investment in higher education over many years, this could not be realized. We observed a strong tendency among the richer people in rural areas to obtain more white-collar employment than the others.
With the progress of the shift in employment structure in rural areas from agriculture to non-agriculture and the associated large-scale rural-urban migration, farmlands hitherto owned by the people of the wealthiest/highest castes are gradually being transferred to members of the other, lower classes and/or castes, including the scheduled castes (SCs). Another notable development that can also be observed is that the agricultural production system is also being gradually transformed from one which is highly dependent on hired labor to one which is basically based on family labor.
I-4. Increased Role of Gram Panchayat
As shown in Fig. 4, the two major political parties (Dravida Munnetra Kazhaga(( or DMK and All India
Anna Dravida Munnetra Kazhagam or (AI)ADMK) in Tamil Nadu won in the state elections in turn
after 1990; that is, ADMK during 1990–96, followed by DMK (1996–2001), ADMK (2001–06) and DMK (2006–11). During the elections, both parties competed fiercely by promising attractive policies and
programs for the general populace. At the same time, after the passage of the 73rdamendment of the
Constitution in 1992, the Panchayat Raj system was strengthened in Tamil Nadu, as in others states in India. Before that, gram panchayat (GP) in Tamil Nadu had malfunctioned, the collection of taxes beingt
their major task.
In 2001, a clerk was employed in every GP, and in 2006 the position of clerk became permanent.21)
One of the most prioritized policies implemented by the newly empowered GP in the study area was the development of a drinking water system.22) According to the Block Development Officer (BDO) at
T. Kallupatti Block (with 42 GPs, 215 villages, and a population of 760,000) interviewed in 2010, there were two engineers under BDO, one ostensibly responsible for drinking water and the other for tanks, but actually both of them worked most of the time for drinking water. According to him, by the late-1990s construction of drinking water facilities was completed in the block, but even after that engineers were busy repairing and maintaining facilities.23) Under such a situation, repair and maintenance of tanks
had been relatively neglected.24)
I-5. Social Safety Net Programs of the Government (1) Public Distribution System
The Public Distribution System (PDS) was established in India in the mid-1960s. It is a distribution system of basic necessities such as rice, wheat, sugar, and kerosene through networks of fair price shops nationwide. Earlier, it was a universal system, but in 1997 the government introduced the Targeted PDS, in which households were classified as either “above poverty level” (APL) or “below poverty level” (BPL) with the latter receiving priority in the distribution of basic necessities. Furthermore, in
21) By contrast, in 1982, the revenue official at the grassroots level became permanent much earlier, with the creation of the Village Agricultural Officer (VAO) post.
22) According to our interview with the President of S Gram Panchayat (GP), Madurai District, in February 2007,t
the major tasks of the GP were to 1) coordinate with officials and politicians of the upper level administration, 2) maintain drinking water supply, 3) maintain street lights, and 4) maintain other public facilities. In terms of revenue and expenditure of the GP,PP the annual revenue was around Rs.3 lakh (Rs.1 lakh from local taxes, and the other Rs.2 lakh from the subsidies from the upper administration system) and the expenditure was Rs.2 lakh for salaries and electricity bill and Rs.1 lakh for maintenance of street lights, pipelines if there existed a drinking water system, and others. In the S GP, there were a total of 20 wells for the drinking water system, out of which 10 were 5 HP and the other 10 were 1 HP.
23) Rural households benefitting from the general public water distribution system had to pay Rs.30 per month as a water tax to GP. If a household drew water pipes inside the house, they had to deposit Rs.1,000 at the begin-ning and regularly pay Rs.50 per month or Rs.600 per year.
24) It is also noted that the budget allocated to the Public Works Department (PWD) for tanks was only Rs.550/ha/ year (Interview with the Chief Engineer, Madurai Region PWD Office in September 2010). Hence, due to the shortage of government budget for tanks, tank rehabilitation has been conducted mainly by using funds from donor agencies, including the European Economic Commission and the World Bank.
December 2000, another category of the poorest group, called Antyodaya Anna Yojona (AAY) was introduced.
However, in Tamil Nadu, the distinction between APL and BPL was not introduced, whereas the category of AAY was adopted. The non-AAY households (accurately, a nuclear family with parents and children is a unit for the PDS) excluding government servants, were given a “Rice Card,” by which they were entitled to buy basic necessities at fixed prices, although there were certain volumetric limitations imposed on purchases each month. In the case of rice, it had been distributed at Rs.3.5/kg, but the rate was reduced to Rs.2 in June 2006 and finally to Rs.1 in October 2008. Note that the market price of rice (coarse) was around Rs.25/kg in 2010. It should also be noted that around the year 2000 the quality of ration rice became much better than before, and people started to eat it. In Tamil Nadu, the PDS functions very well as a safety net and a subsidized program of basic necessities even in rural areas.25)
(2) Micro-finance Schemes
The Integrated Rural Development Program (IRDP) and the Self-Help Group (SHG) Program were the
25) The following was the result of an interview with a salesman in a fair price shop in a village in the Madurai District. The distributed ration cards in the village (with 134 households) were in total 246, out of which 223 were the “Rice Card” and the remaining 23 were for the AAY families. In addition, 12 cards were distributed to senior citizens under the Old Age Pension (OAP) scheme. The OAP is basically a pension program (explained later) and a different distribution system is applied to the beneficiaries. The OAP is given to the following five categories: aged persons, physically handicapped destitute, destitute widows, destitute agricultural laborers, and deserted wives. The difference between “Rice Card” holders and AAY families was that the latter families were entitled to buy up to 35 kg of rice per month. The limitations on rice purchasable by the “Rice Card” holders were: 12 kg per month for a family with a single adult, 14 kg for a family with an adult and a child, 16 kg for a family with two adults, 18 kg for a family with two adults and a child, and 20 kg for a family with more than three adults. OAP families are provided with 2 kg of free rice per month (or 10 kg per month for Rs.1/kg). According to the salesman, 98% of allocated rice, 100% of allocated sugar, and 100% of allocated kerosene are actually sold. In contrast only 50% of allocated wheat is sold in the shop. Note that the shop was open every Wednesday; in the first and second week rice and sugar were available, while in the third and fourth week kerosene and other commodities (wheat, red gram, and black gram) were available. The price and purchase limitation per month for wheat, sugar, and kerosene were as follows: for wheat flour Rs.11/kg with monthly limitation of 1 kg for every card holder, for wheat (raw) Rs.7.5/kg with limitation of 5 kg per month for every card holder, for sugar Rs.13.5/kg (Rs.30–40 in the market) with monthly limitation of 1 kg for a family with less than 2 members, 1.5 kg for a family with three members, and 2 kg for a family with more than 4 members, and for kerosene Rs.8.8 per liter (there was no market due to prohibition of sales) with monthly limitation of 3 liters for every card holder. The state to state difference in the performance of PDS seems to be large. For example, according to my field survey in Nadia District, West Bengal in 2010, only BPL families (roughly 10–15% of total rural families) were entitled to purchase a maximum of 35 kg of rice per month at Rs.3/kg, a maximum of 1 liter of kerosene per week at Rs.11 per liter, and wheat (raw) at Rs.3/kg (the limitation was unknown). The APL households were only entitled to buy wheat (raw) at Rs.10/kg (the limitation was also unknown). The shop was open only on Saturday and Sunday.
two major micro-finance schemes introduced in the study area in the beginning of the 1980s and the 1990s respectively. Although the IRDP was a scheme of micro-credit delivered mainly by public com-mercial banks, the SHG was totally different in that it mobilized savings from its members for the purpose of lending the money back to the members themselves at a low interest rate. It was basically a mutual help system among the rural “poor” women, organized largely by NGOs. However, an NGO monitors its activity for a while, and, if its performance is judged favorable, the NGO recommends primarily public commercial banks to provide them with loans under concessional conditions (a low interest rate and without collateral), which is called the “SHG-Bank Linkage Program.”
However, both the IRDP and the “SHG-Bank Linkage Program” were similar in the sense that the government of India encouraged rural poor (women) to purchase and keep livestock such as milch animals and goats/sheep by providing them with small bank loans.
(3) National Rural Employment Guarantee Scheme (NREGA)
The NREGA is a national program in India. It was first introduced to some limited areas in 2005 (8 districts of Tamil Nadu were included), but has expanded nationwide since 2006. In Tamil Nadu, persons over 18 years old who are willing to work under the scheme should be registered in the GP office.26)
The registered persons are guaranteed 100 days’ employment by the government at a daily wage of Rs.80, regardless of gender. Note that the wage rate is advantageous for female workers, given the large wage gap between female and male workers generally observed in south India. According to the field survey in a village in the Madurai District with 134 households, there were 134 persons registered in the GP office under this program in 2009.
(4) Other Programs
Indira Awas Yojonaj (IAY)( ) is a subsidy program for house construction for the poor (BPL households), which started in India in 2001 and spread throughout the study area. According to our field survey in a village in the Madurai District in September 2010, the amount of subsidy was Rs.70,000 per household. In addition, there is a governmental construction project for the poor, and selected poor house-holds are entitled to live in the houses in an area, which is usually called an Indira Colony. The Mid-dayy Meals Programg provides free noon meals to school children up to the 10thstandard. It was introduced
initially in 1960 in Tamil Nadu (during the Madras Presidency) then completely revamped and renamed
26) In West Bengal the system was that only BPL families can be registered in GP offices and a “Job Card” is dis-tributed to each family. All the workforces of the family are entitled to work under the program (interview by the author at the Getugachi GP, North 24 Pargana District, West Bengal in September 2010).
the Nutritious Mid-day Meal Program in 1982. The present DMK government upgraded the program in 2006 by including eggs three times a week.27) The Old Age Pension Schemeg also started in 2006 as
one of the policies of the present DMK government in Tamil Nadu. If one is recognized as a benefi-ciary, he/she can be provided Rs.400 per month for life. It was raised from Rs.200 to Rs.400 a month in August 2006. The conditions for being recognized as a beneficiary were: one must be without sons, and over 40 years old. The Sivagami Ammaiyarg y Memorial Girl Child Protection Scheme (SAMGCPS)r ( ) was introduced in 2006 as one of the major policies of the present DMK government for “promoting family planning, eradicating female infanticide and promoting the welfare of girl children in poor families and to raise the status of girl children.”28) The scheme is divided into two: Scheme I for one girl child and
Scheme II for two girl children. A fixed deposit receipt in the amount of Rs.22,200 is provided to the family in the name of the girl child under Scheme I, while a fixed deposit receipt of Rs.15,200 for each girl child is given under Scheme II. The interest rate of the fixed deposit was 7% per annum in 2010 and beneficiary families can get a lump sum amount when the girl child becomes an adult.29) Moreover,
an amount of Rs.150 as a monthly incentive is given to the girl child on completion of 5 years from the date of deposit and up to the 20thyear of deposit for her educational purpose.
I-6. Summary
To sum up, major socio-economic changes have been experienced recently in the study area of rural Madurai District, Tamil Nadu. The major sources of change were largely three: 1) technological change in agriculture, especially the rice “Green Revolution” that occurred after the 1980s; 2) accelerated expansion of non-agricultural job opportunities, especially since the mid-1990s; and 3) policy interven-tions by the government and NGOs, especially since the 1980s onwards, the impact of which seems to have increased over time. The most striking impacts were brought about by the second factor, the expansion of non-agricultural employment options. All of the above three sources of change, however, have been functioning to transform “traditional” agrarian society in India, characterized by its
caste-27) The Supreme Court of India directed the government in 2001 to initiate similar programs all over the country. 28) The income limit is below Rs.50,000 per annum per family for Scheme I and below Rs.12,000 per annum for
Scheme II. Other conditions include: either of the parents should have undergone sterilization before the age of 35, and the family should have only one/two female children and no male child. On evaluation of the program, see Srinivasan and Bedi [2009].
29) The fixed deposit is renewed every 5 years, which means that the amount of deposit will be more than 4 times in 20 years. It should be mentioned, on the other hand, that the dowry price is surging in south India, including the study area. According to our field survey in 2010, the prevalent rate of dowry was 80–250 grams of gold, equivalent to Rs.2–7.5 lakh. In addition, roughly three-fourths of the Rs.2 lakh expense for the marriage cer-emony should be borne by the bride’s family. Regarding the problem of dowry in south India, see Srinivasan [2005] and Srinivasan and Bedi [2007].
based hierarchical organization, and often based on a highly skewed land ownership structure.30)
II Papers Included in the Special Issue
The overall objective of this special issue is as follows.
Since 1991, when India started to implement full economic liberalization policy, there has been a great acceleration in its economic growth rate, although high agricultural sector growth in the 1980s was one of the most important prerequisites for this acceleration. On the other hand, the agricultural sector, especially the food production sector, started to stagnate at around 2–2.5% per annum growth rate, leading to an expansion in the rural-urban income gap. Therefore, migration from rural to urban areas accelerated. Also notable is that at present there is a strong symptom that the Indian economy, which has been suffering from high population pressure and pervasive un-/under-employment among the masses, started to turn into a labor-scarce economy for the first time in its recent history, a fact which is more common in south India, including Tamil Nadu.
On the other hand, south India, especially Tamil Nadu, is famous for its strong caste influences which have remained pervasive in everyday livelihood amidst this rapid economic change. Inevitably, frequent conflicts are observed among different castes, especially among the scheduled castes and the others. One of the most apparent examples is within the management system of tanks for irrigation, because tanks have been managed by the traditional hierarchical village governing system based on castes. Water turners, Neerkattis, traditionally appeared from some particular scheduled castes in a hereditary system, and played a pivotal role in tank management, under the guidance of high caste village leaders. There, a widespread deterioration of tank management institution due to the increased inter-caste conflicts has been observed, since there are now many “exit” options available to the Neerkattis, made possible by rapid economic development and change.
This special issue deals with the drastic rural social changes in India induced by rapid economic development. The first three articles deal with the rapid economic change and related issues in rural
30) However, a series of recent research clarified that the “traditional” agrarian society in India was formed by the 16th–17th century, which was characterized by the system of entitlements (over shares of diverse kinds of
resources, especially food), granted through local hereditary assignments as well as through appointment by the state [Kotani 2002; Tanabe 2005; Mizushima 2006]. It was therefore after the British introduced a private land ownership system that the bundles of rights hitherto enjoyed by diverse entitlement-holders were deprived, and many low-caste people became mere landless laborers or service-providers. Also note that the system of entitlements here should be discriminated from the “jajmani“ system.” The latter, basically dyadic patron-client relationships, is considered to be a product of colonial times introduced after the pre-colonial system of labor division and exchange had broken down [Mayer 1993].
Tamil Nadu. One of the common issues is financing; i.e., financing for higher education and livestock purchase, or the rural financial market itself. The next two articles deal with the issue of tank manage-ment and the transformation of tank-irrigated agriculture.
The first article, “Employment Structure and Rural-Urban Migration in a Tamil Nadu Village: Focusing on Differences by Economic Class” by Keiko Sato, deals with the shifts in employment from agriculture to non-agriculture, and labor migration from rural to urban areas, the most significant change experienced in the study area, based on her intensive study of a village in the Madurai District. Her study village was characterized as a single-caste village, with the Reddiyar households comprisingr
nearly 90% of all the households. She classified a total of 134 households into five economic classes using the wealth ranking method, and made a detailed analysis of the occupational structure of household members, including “temporary migrants” who stayed outside the village, “independent migrants,” and “migrated-away workers.” Her major findings were as follows. First, the “upper” class people tend to get more white-collar jobs, after giving long-term, expensive, and advanced education to their sons and daughters. They still occupied a substantial proportion of farmland in the village, which was managed by aged fathers, depending on hired laborers. Interestingly, many such fathers had retired from govern-ment and other white-collar jobs in urban areas. They returned to their village and engaged in agricul-ture, in addition to working as informal village leaders, even as they were receiving quite substantial pensions.
On the other hand, the “upper middle” and the “middle” class people were the most “active” farmers, although not a few of their children also started to migrate to urban areas and engage in white-collar and blue-white-collar jobs. By contrast, the “lower middle” and the “lower” class people had relatively small farmland, and have been working as laborers until recently. But they also started to engage in some blue-collar jobs and daily labor jobs, such as construction labor. Since the daily wage rate has been rapidly increasing, they are also benefitting from recent rapid economic growth. A notable fact, how-ever, is that many “lower” class households were female-headed households, and it was found that they could not benefit from the higher wage rate, simply because of the shortage in the labor force.
One of the major contributions of Keiko Sato in the article is that she clarified how rural households migrate to urban areas step by step. First, sons of village households go to an urban area to pursue higher education and finally become employed in white-collar jobs after graduation from school. They become “temporary migrants” who often come back to the village to see their parents. Then, after they marry, they form independent households, usually continuing to stay in the urban area. After many years, when the sons retire, they may return to their village and manage inherited farmland, or they may bring their parent(s) to the urban area to live together. In the latter case, if they sell out their
farmland, the migration of a rural household to an urban area is completed.
The second article, “Goat-Rearing Practices and the Limited Effects of the SHG Program in India: Evidence from a Tamil Nadu Village” by Keiko Sato, deals with goat rearing in her study village in the Madurai District. She clarified the detailed goat-rearing practices of the villagers and by doing so she found that, unexpectedly, the poor households could not rear goats to the same extent as the “middle” and the “upper middle” household people did. The most important reason for the relative failure of the poor to rear goats was that they faced a shortage of labor because many of the poor were female-headed households which lacked access to the adult male labor force. Those benefitting most from the Self-Help Group (SHG) program were the “middle” and the “upper middle” classes, who reared goats while engaging in agriculture.
The third article, “Self-Help Groups and the Rural Financial Market in South India: A Case of a Tamil Nadu Village” by Koichi Fujita and Keiko Sato, deals with the financial aspect of rural change, mainly through a focus on micro-finance schemes of SHGs, based on a detailed study of the same village which was studied in the first and second articles. The authors found that SHGs, rather than a tool of poverty alleviation through giving bank loans, functioned more as a tool to accumulate savings, although the cost of higher education is much higher than many can save through SHGs. SHGs functioned for them as a tool of accumulating savings, either in the form of goats or cash money of Rs.5,000–6,000 every five years.
The fourth article, “Deterioration of the Informal Tank Institution in Tamil Nadu: Caste-based Rural Society and Rapid Economic Development in India” by Muniandi Jegadeesan and Koichi Fujita, deals with the problem of tank management in the study area. The paper is a detailed account of the current status of informal tank institutions, based on their study in the six tank-irrigated villages on the foot of the Western Ghats Mountains in the Madurai District. Their focus of analysis is the Neerkattis, water-turners, who have played a pivotal role in tank management. The task of the Neerkattis has been a hereditary assignment given to a particular scheduled caste (SC), the Pallar in the study area. How-r
ever, under rapid economic development and with increasing non-agricultural job opportunities, SCs have also started to shift their jobs from agricultural labor to non-agricultural jobs (mainly blue-collar jobs), especially since the mid-1990s. The article describes how the fundamental contradiction between the “traditional” caste-based tank management system and the rapid socio-economic changes in India is contributing to the deterioration of tank irrigation performance.
The fifth and final article, “The Effects of Expansion of Private Wells on Rural Livelihood in Tank Intensive Watersheds: A Case Study in Upper Gundar River Basin, Tamil Nadu” by Takahiro Sato and Periyar Ramasamy Duraiyappan, deals with one of the recent movements in agriculture: the shift from
foodgrains to high-valued crops such as fruits and vegetables. They have covered a whole upper river basin and, by utilizing Geographic Information System (GIS), clarified land-use changes in the area during the last 20 years from the late-1980s. They found that in the upper part of the basin where water resources are relatively plentiful, farmers successfully shifted from foodgrains to high-valued crops such as fruits and vegetables by introducing private well irrigation, whereas farmers in the lower part of the basin failed to transform their farming practices, and fallow land increased substantially in such areas.
These five articles can be understood more easily in the context of the socio-economic changes in the Madurai District which were presented in this introduction. Finally, we hope that this special issue can contribute to the understanding of the recent rapid transformation of the “traditional” agrarian society in India, especially in Tamil Nadu.
Acknowledgements
We appreciate the financial assistance from the Global COE Program “In Search of Sustainable Humanosphere in Asia and Africa,” represented by Dr. Kaoru Sugihara, Professor, Center for Southeast Asian Studies, Kyoto University, the Grant-in-Aid Kiban S (No. 21221010) for 2009–13, represented by Dr. Tsukasa Mizushima, Professor, The University of Tokyo, the Grant-in-Aid Kiban A (No. 21248029) for 2009–11, represented by Dr. Seiichi Fukui, Professor, Kyoto University, and the Grant-in-Aid Kiban B (No. 21380140) for 2009–12, represented by Dr. Noriaki Iwamoto, Professor, Tokyo University of Agriculture.
References
Fujita, K. 2010. The Green Revolution and Its Significance for Economic Development: The Indian Experience and Its
Implications for Sub-Saharan Africa. JICA-RI Working Paper No. 17, June 2010.
Government of Tamil Nadu (GoT). 2006. Economic Appraisal 2003–04 & 2004–05. ―. 2009. Economic Appraisal 2006–07 & 2007–08.
Kajisa, K.; and Palanichamy, N. V. 2006. Income Dynamics in Tamil Nadu, India from 1971 to 2003: Changing Roles of Land and Human Capital. Agricultural Economics 35 (supplement): 437–448.
Kajisa, K.; Palanisami, K.; and Sakurai, T. 2007. Effects on Poverty and Equity of the Decline in Collective Tank Irrigation Management in Tamil Nadu, India. Agricultural Economics 36: 347–362.
Kotani, H. 2002. Western India in Historical Transition, Seventeenth to Early Twentieth Centuries. New Delhi: Manohar.
Mayer, P. 1993. Inventing Village Tradition: The Late 19thCentury Origins of the North Indian “Jajmani System.”
Modern Asian Studies 27(2): 357–395.
Mizushima, T. 2006. The Mirasi System as Social Grammar: State, Local Society, and Raiyat in the Eighteenth-Nineteenth Century South India. In The State in India: Past and Present, edited by M. Kimura, and A. Tanabe. Oxford University Press.
Palanisami, K.; and Ester, K. W. 2000. Tank Irrigation in the 21stt Century: What Next? New Delhi: Discovering
Publishing House.
Planning Commission (Government of India). 2008. Eleventh Five Year Plan 2007–12 Vol. I: Inclusive Growth. Sato, K. 2011. Employment Structure and Rural-Urban Migration in a Tamil Nadu Village: Focusing on Differences
by Economic Class. Southeast Asian Studies 49(1): 22–51.
Sato, T.; and Periyar Ramasamy. 2011. The Effects of Expansion of Private Wells on Rural Livelihood in a Tank Intensive Watersheds: A Case Study in the Upper Gundar River Basin, Tamil Nadu. Southeast Asian Studies 49(1): 124–150.
Subramanian, M; Thiyagarajan, K.; Kalaiarasi, R.; and Sundar, S. 2005. Genetic Improvement of Rice Varieties in Tamil Nadu. In Genetic Improvement of Rice Varieties of India, edited by Sharma S. D. and Rao U. Prasada. Today and Tomorrow Printers and Publishers.
Srinivasan, S. 2005. Daughters or Dowries? The Changing Nature of Dowry Practices in South India. World
Development 33 (4): 593–615.t
Srinivasan, S.; and Bedi, A. S. 2007. Domestic Violence and Dowry: Evidence from a South Indian Village. World
Development 35 (5): 857–880.t
―. 2009. Girl Child Protection Scheme in Tamil Nadu: An Appraisal. Economic and Political Weekly 44(48): 10–12.
Tanabe, A. 2005. The System of Entitlements in Eighteenth-Century Khurda, Orissa: Reconsideration of “Caste” and “Community” in Late Pre-Colonial India. South Asia 28(3): 345–385.

![Fig. 2 Trend of Sown Area and Yield of Rice Production Source: GoT [2006; 2009].](https://thumb-ap.123doks.com/thumbv2/123deta/6759018.1692345/4.773.141.633.130.377/fig-trend-sown-area-yield-rice-production-source.webp)
![Fig. 3 Trend of Coarse Cereals Production in the Madurai District Source: GoT [2006; 2009].](https://thumb-ap.123doks.com/thumbv2/123deta/6759018.1692345/6.773.148.531.129.396/fig-trend-coarse-cereals-production-madurai-district-source.webp)

