TVET as the last educational chance :
employability and family background of
Ethiopian urban youth
著者
Demachi Kazue
権利
Copyrights 日本貿易振興機構(ジェトロ)アジア
経済研究所 / Institute of Developing
Economies, Japan External Trade Organization
(IDE-JETRO) http://www.ide.go.jp
journal or
publication title
IDE Discussion Paper
volume
671
year
2017-05
INSTITUTE OF DEVELOPING ECONOMIES
IDE Discussion Papers are preliminary materials circulated to stimulate discussions and critical comments
Keywords: TVET; youth; Ethiopia; unemployment; family background JEL classification: J21; I25; I26
* Lecturer, Tokyo University of Foreign Studies ([email protected])
IDE DISCUSSION PAPER No. 671
TVET as the last educational chance:
Employability and family background
of Ethiopian urban youth
Kazue DEMACHI*
May 2017
Abstract
This paper analyzes the effect of TVET schooling of Ethiopian urban youth on their employability using the Urban Employment and Unemployment Survey (UEUS). In estimating the personal returns of TVET experience, we put special focus on family background of workers, with the hypothesis that family characteristics strongly influence on the employability of workers. We find general positive effects of TVET on employability in benchmark regressions as well as sample selection model. However once we controlled endogeneity of TVET choice and family background, the TVET positive effect disappeared. The results suggest the possibility that public vocational school is viewed and chosen as a last resort of education or alternative to general education, especially for those who were denied to proceed to further education, failed to enter upper secondary schools, and females, but only if they are financially fit.
The Institute of Developing Economies (IDE) is a semigovernmental, nonpartisan, nonprofit research institute, founded in 1958. The Institute merged with the Japan External Trade Organization (JETRO) on July 1, 1998.
The Institute conducts basic and comprehensive studies on economic and related affairs in all developing countries and regions, including Asia, the Middle East, Africa, Latin America, Oceania, and Eastern Europe.
The views expressed in this publication are those of the author(s). Publication does not imply endorsement by the Institute of Developing Economies of any of the views expressed within.
INSTITUTE OF DEVELOPING ECONOMIES (IDE), JETRO 3-2-2, WAKABA,MIHAMA-KU,CHIBA-SHI
CHIBA 261-8545, JAPAN
©2017 by Institute of Developing Economies, JETRO
No part of this publication may be reproduced without the prior permission of the IDE-JETRO.
TVET as the last educational chance: Employability and
family background of Ethiopian urban youth
Kazue Demachi
∗March 13, 2017
Abstract
This paper analyzes the effect of TVET schooling of Ethiopian urban youth on their employability using the Urban Employment and Unemployment Survey (UEUS). In es-timating the personal returns of TVET experience, we put special focus on family back-ground of workers, with the hypothesis that family characteristics strongly influence on the employability of workers. We find general positive effects of TVET on employability in benchmark regressions as well as sample selection model. However once we controlled en-dogeneity of TVET choice and family background, the TVET positive effect disappeared. The results suggest the possibility that public vocational school is viewed and chosen as a last resort of education or alternative to general education, especially for those who were denied to proceed to further education, failed to enter upper secondary schools, and females, but only if they are financially fit.
Keywords: TVET; youth; Ethiopia; unemployment; family background JEL Classification Number: J21; I25; I26
∗Tokyo University of Foreign Studies, [email protected] The author is grateful for valuable comments by
Takahiro Fukunishi, Tomohiro Machikita, Shoko Yamada, Christian Otchia, Yuki Shimazu, Motoki Takahashi, and Akiyo Aminaka at the research meetings. Author also wishes to thank Ibrahim Worku for invaluable support at interviews in Ethiopia. Remaining errors are author’s.
1
Introduction
Development of manufacturing sector is one of the promising paths for stable growth of Africa. This is especially true when we look at the countries where primary commodities account for a large part of GDP and export earnings, and their high dependence on primary export retards long-term economic growth and fostering of stable society (Collier and Hoeffler 2000, Ross 2012). Weak manufacturing sector in African countries is associated with insignificant sectoral labor shift from agriculture to manufacturing (McMillan et al 2014) , and the shortage of in-dustrial skilled workers is critical. Recent discussions on technical and vocational education and training (TVET) among the international development society reflects this understanding, which seems to have lead to TVET system reforms in several African countries.
This study attempts to evaluate the impacts of TVET schooling on urban youth in Ethiopia, based on the national labor force survey, Urban Employed and Unemployed Survey (UEUS) 2006, 2009-2015. Ethiopia has still small but growing manufacturing sector. Given the high share of youth in the population as well as the high unemployment ratio especially among youth, development of manufacturing industry as a mass absorber of workforce is critical.
While the reform has been underway almost for a decade, evaluation of the Ethiopian TVET system is not enough, both in government and academic researches. In some of the other less-developed countries, the impact of vocational training programs or projects on youth for limited time period have been studied, applying randomized control trials (for example, Hamory et al. 2015 on Kenya, Blattman et al. 2014 on Uganda, Bandiera et al. 2012 on Uganda, Cho et al. 2013 on Malawi, and Card et al. 2011 on Dominica). Results are mixed; some reported positive impact, while others showed impacts only for female or even negative. Many of those are one-time, relatively short period, poor or minority oriented vocational programs. On the other hand, when vocational training system is planned and designed in close connection to national industrial policy, vocational education becomes an important part of formal educa-tion system. The significant role of vocaeduca-tional educaeduca-tion as a formal system for development of a society is obvious, given the long experiences in industrial countries. However, in terms of cost efficiency, especially for developing countries, there is long lasting debates on TVET (Psacharopoulos 1987, King 1993, Oketch 2007, Joshi and Verspoor 2013).
In this paper we focus on the effect of TVET in Ethiopia as an institutional education, a part of formal education system. Our main research question is the impact of lower level TVET on workers. However, we are not assessing the meaning of training or effectiveness of what is taught. Rather, we simply focus on the effect of TVET on employability, weighting on the two points. First, we ask whether family has effect on employability of worker, by controlling the family background, whereby we treat school difference as exogenous. Second, we treat school difference and choice of TVET as endogenous. The second point is based on the assumption that in Ethiopia where opportunities for higher general education is limited, as other African countries (Oketch (2007), those who lost chance to proceed to upper secondary may see TVET as the last opportunity of additional education, regardless of lower social perception of TVET. While not many empirical researches on Ethiopian TVET exist, Franklin (2015) analyzes on job search of Ethiopian youth, using randomized trial, with special focus on the cost of job search, and suggests that the monetary cost, such as transportation fees, is the bottleneck for youth job searchers. This indicates that economic background and availability of financial sup-port matter to chances for youth to find a job. Apart from randomized trial, several researches on Ethiopian youth also suggest existence of labor market segmentation between the wealthy and the poor. Serneels (2007) focuses on youth male job preference of public job over private or lower status job, and concludes that the riches tend to wait for government jobs, resulting
longer unemployment period.This point has been mentioned by Krishnan (1996), and Mains (2012) supports this view through anthropological work. Mains (2012) especially describes the existence of reluctance, or a kind of “stigma” towards manual works among urban youth, which often are strong enough to make them prefer to stay unemployed rather than taking low status jobs.
In using secondary data, we take advantage of relatively large sample size on one hand, but we also face several limitations. Those limitations mainly stem from the structure and charac-teristics of the survey. One of the two major limitations is that we observe family information of workers only if the one is living with family. This is quite a serious limitation, since as the literature in educational and labor economics suggest, family background such as parents’ education or wealth (income or asset) strongly influences the unobserved trait of workers, abil-ity, or cognitive skills of workers (Acemoglu and Pischke 2001, Rees and Gray 1982, McElroy and Horney 1981, Shea 2000, Krishnan 1996, Heckman and Hotz 1986). Limiting the sample to those with family information will lead to biased estimation if unobserved determinant is correlated both with family membership, that is, whether a worker is living with parents is not, and employment status. We will test this point with sample selection model. The other major limitation is that we observe information of workers’ payment only for limited workers, in not strictly systematic manner. This limitation requires us to develop new indicators, which are also not flawless.
In next section, we briefly discuss on the situation of education and work especially for urban youth in Ethiopia. Section 3 elaborates on the data and our devices to circumvent the data limitation before we move on to analytical framework which will be discussed in section 4. We then empirically test our assumption in section 5, and section 6 concludes.
2
Education and society in Ethiopia
According to the Ministry of Education, net enrollment ratio at upper primary education (grade 8) is 49.5%, which reduces to 20.2% for lower secondary (year 2013/14), suggesting that almost half of the recent school age youth stop before grade 8 (MOE 2015). Given the fact that most common educational path is to finish up to 8th grade, those who proceed to secondary and tertiary education should have some distinguished features with themselves or their families. Unfortunately, the official statistics on TVET enrollment is unreliable for obvious misreporting and underreporting in recent years, but TVET schools and enrollment are on the increasing trend since around 2000.
The Ethiopian government runs national five-year plans specifically for education sector, the Education Sector Development Program (ESDP). As a result of this implementation, the number of TVET schools in Ethiopia increased by fourfold, and the number of students tripled between 2004 and 2011 (Shimazu 2014). Current ESDP V, which covers 2015/16-2019/20 (ac-cording to Ethiopian calender), also refers to TVET as a priority program along with other educations (MOE 2015), which parallels with the national Growth and Transformation Plan (GTP). Fostering of manufacturing sector has been set as one of the keys for development through GTP I (2010/11-2014/15) and newly announced GTP II (2015/16-2019/20, National Planning Commission 2016). The GTP II maintains policy focus on strengthening of TVET to foster skilled workers. The GTP II also refers to the future investment in TVET, to further increase the numbers of TVET institutions and graduates (ibid. 186-187). On the other hand, Bigsten et al (2013) suggest the recent increase of non-public and informal jobs in Ethiopia. While TVET education is aimed to supply skilled workers into industries as employee, current educational policy also aims at the promotion of self-employment among TVET graduates.
Under current policy on TVET which defines it as the post-lower secondary education, the government stipulates that the ratio of the students finishing TVET level 1-2, 3-4, 5 are de-signed to be 24:3:1 (Shimazu 2014, 69). Given this fact, we focus on the return of lower TVET, level 1 and 2, which make up the majority of TVET graduates. Our motivation for focusing on TVET 1 and 2 also stems from our experience in the interviews in Addis Ababa, Oromia, and SNNPR that not a few employers referred to the point that TVET graduates are equipped with favorable knowledge and training experience as employee in their industry, but only if they finished above level 3. If this view represents the general perception on the graduates of TVET, it worth testing its influence on the majority, lower level TVET graduates’ economic outcome.
[Table 1]
2.1
Family membership
Table 1 shows the family membership of those who are economically active, by final educational record. We use the term “family membership” to denotes the situation where youth are living with their parents’ family after finishing education. If one is household head or the spouse, or in the household as non-relative, we define the one is out of family membership. It is clear from the table that family membership is highest among those who finished lower secondary school, TVET, and upper secondary schools.
There are several possible reasons why youth still living with family after finishing educa-tion. Aside from high living cost in urban centers like Addis Ababa, other possibility is that the youth is preparing for next educational step, though those are defined as economically inactive in our analysis and excluded. The other possible reason is the financial. Youth without work, or low earning may choose to live with parents’ family. McElroy and Horney (1981) suggest that family membership has a function as unemployment security for youth. While their analysis was based on the United States, the function of family membership as unemployment security is also applicable in the context of less-developed countries such as Ethiopia, where social security system such as unemployment insurance is still to come.
Unlike the United Stats, a point specific to Ethiopia or other developing economies is that majority of households do not have economic capacity to keep youth in the same household after finishing education. In Table 1, the lower the educational record, the lower the possibility to be living with parents. Only relative rich families are capable to serve as unemployment insurance for their family members.
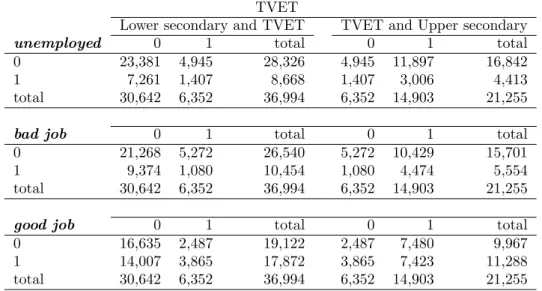
[Table 2]
2.2
Labor market segmentation
Table 2 shows the unemployment ratio by education level. We see that the ratio is highest among those who finished the lower secondary education (secondary 1). This raises following two points, which leads to the question that whether there is segmentation within the labor market.
First, higher unemployment ratio in relatively high education level indicates a possibility that the type of jobs sought are different, depending on their educational background. Kr-ishnan et al (1998), Serneels (2007), and Bisgsten et al (2013) suggest that until recently the government have been the main provider of works in Ethiopia, and government jobs meant
high social status. If it is the case today, the segmentation can be between the government jobs which are rationed and need to be waited, and the private jobs which are less rationed but with lower social status and stability. As suggest by Bigsten et al (2013), with recent economic changes there are increasing number of private jobs in the economy today, and the share of younger workers employed in private sector is increasing. This new trend should have pushed up the status of private sector job, though the preference toward white color or office job still exist.
Second, if labor market is segmented according to educational attainment, the segmentation should have deeper root in social and economic stratification, which resulted in the differences in educational record. The analyses on the intergenerational transmitting effect through family wealth and parents’ ability suggest that parents’ income and education influence on child’s schooling or earnings. In analyses on United States, Shea (2000) shows that father income influences on child’s human capital if father’s educational attainment is low. Acemoglue and Pischke (2001) on the other hand show that family income influences on child’s college enroll-ment. Obviously due to data limitation, not many of this type of analysis have been done in lower-income countries, but Heckman and Hotz (1986) discuss labor market segmentation and social stratification in Panama, and show that education of parents influences male household heads’ earnings. On Ethiopia, Krishnan (1996) examined on age 15-29 urban worker, and sug-gested that parents’ earnings influence on children if they are working in public sector.
In the following, we also assume that family background influences young workers, and see whether those who have chosen to go to TVET are different from their peers, and whether those who are living with parents are different. Our another working hypothesis is that not all the youth entered TVET are vocation-oriented, and we test the possibility that choice of TVET as a reflection of high aspiration for additional educational attainment. This point should not be peculiar, given the rigid educational system in Ethiopia, where demand for education is increas-ing and number of youth is also increasincreas-ing, leadincreas-ing to severe school-record based competitions in job market.
The following sections show that there is segmentation of education class, which leads to segmentation of labor. This is especially relevant in current Ethiopia, where educational system is still experiencing transitions, and still the access to higher education is limited. In the mean time, educational attainment is rapidly increasing in urban areas, while the income gap and opportunity gap is widening given the recent rapid growth and increasing number of youth in the society.
3
Theoretical framework
We assume that there is segmentation of labor market for ones who prefer to be employed in bad job rather than stay unemployed, and for ones who prefer to stay unemployed rather than taking a bad job. Segmentation of job and workers is discussed by Heckman and Hotz (1986), and Acemoglu (2001) on directed search in labor market where two types of jobs exist. We also assume two types of job, good job and bad job, where the payments are denoted as wg
and wb respectively, and 0 < wb < wg. In parallel with the empirical analysis in next section,
we assume good job is formal employment, private or public, as paid employee, and bad job is self-employment. If one is economically active but unemployed, or working but unpaid so that payment w0 = 0, we regard the situation unemployed.
Following Serneels (2007), we assume present value for a worker with each type of job as Vi = ∞ X t=1 δtwi = wi 1 − δ, (1) where i = u, b, g.
For simplicity, we assume that Vb < Vg always holds. We also assume that there is no
entry-cost for self-employment or a bad job, and that bad job is always available. A good job is allocated with possibility α, 0 < α < 1 to a worker, and one will take a bad job regardless of the possibility of getting a good job as long as
V = max(Vu− Vb, 0) = 0. (2)
We define the expected value of an employed as
W (w) = E[αwg+ (1 − α)wb]. (3)
On the other hand, the present value of an unemployed is defined as
Vu = U = δ{max(Vu− Vb, 0)B + E[W (w)] (4)
where B denotes benefit received during unemployment, or family support in Ethiopian context, where social security system such as unemployment insurance is still not fully established. Thus, for the worker with Vu− Vb > 0,
U = (Vu− Vb)B + δE[W (w)], (5)
and for the worker with Vu − Vb ≤ 0
U = δE[W (w)]. (6)
Since a worker is indifferent to staying unemployed or being employed at reservation wage
WR, we obtain reservation wage when expected value of employed equals to present value of
unemployed. Thus, for the worker with Vu− Vb > 0 ,
WR=
(Vu− Vb)B
1 − δ (7)
and for the worker with Vu − Vb ≤ 0
WR= 0. (8)
This model reflects our assumption that a worker who takes any available job should have very low reservation wage, with no external financial support or family to rely on. On the other hand, those who can get support from family, the reservation wage must be high enough so that they can chose to stay unemployed rather than taking a bad job. In the next section we extend this idea to empirical model, where we test the effect of family support B on employment status.
4
Data
The UEUS has been conducted by the Ethiopian Central Statistical Agency from 2003, as one of the survey which complement with the National Labor Force Surveys. The report of the first UEUS survey states that it was a “bi-annual” survey program to be conducted in October and April, and conducted in 2003, 2004 and 2006 (CSA 2004). However, through system changes since 2006 it became annual survey, though the survey round was resumed only first in 2009 after 2006 (CSA2006; 2009). The survey is conducted annually after 2009. We use the date from the round of 2006, and from 2009 to 2015 except for 2013 when it was conducted under the name of Labor Force Survey (LFS). Since large part of the questions in LFS are compatible with UEUS, we integrated the data1. The sampling is stratified based on the Enumeration Areas
defined by the government, so the number of chosen households and composition is compatible all through the survey, though the households are not identical, making a pooled data. Since our focus is on youth, we limit the sample to age between 17 and 35, setting lower boundary at 17 as we wish to include those who have finished lower TVET and comparable education and started working, and upper boundary at 35 according to the definition of youth by the African Youth Charter (African Union Commission 2006). We also limit our sample to male and female who are economically active, that is, not in education, ill or pregnant, or not out of work for any other given reason. Some of the studies on youth unemployment such as Serneels (2007) focus on youth males, but here we keep female in our samples to see the effect of education on different sex. The difference is an important when looking at TVET schools, since it has achieved equal gender enrollment ratio in lower levels. This contrasts to other tertiary level schools, where male enrollment still dominates.
[Table 3]
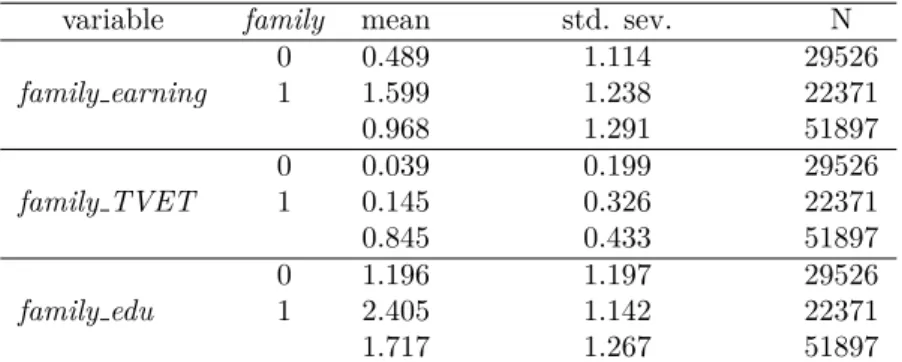
In order to look at the family influence, we defined family (=family membership dummy) and other three variables, family earning, family TVET and family education. These variables are calculated using scores for employment status, TVET experience and educational record for each family member (excluding non-relatives) in the same household. Summary statistics is shown in Table3, and all mean difference by family membership is statistically significant at 1% level. Detailed definitions are given in Appendix. A limitation of our data set is that we observe family background information on parents, siblings or siblings of parents only if the worker is living within the same household. That is, if the worker is married and established independent household, or living alone, we do not observe their parents’ family background. Moreover, given our assumption on the social segmentation, the family membership can be endogenously determined. For instance, rich parents with land and house may be able to accept their children in the household and support their livings even after they finish education and have positive incomes on their own. Conversely, youth with rich family may have been in good learning environment, which may have resulted in better education and higher earning, enabling to establish own independent household. We need to deal family background information as endogenous explanatory variable, where whether the information is observable endogenously depends on the other determinants. We deal with this point with the empirical estimation method.
Regrading the dependent variable, our main focus is employment status. In general, analy-ses on economic return of education in developed countries use wage data to measure the status. However, the UEUS collects weekly payment data only for those who are formally employed
as paid worker, but the survey does not collect information of payment for those who work as self-employed. To circumvent this limitation and to enable those without payment information to be included in sample, we generated new indicators to describe the ordered employment status by categorizing jobs, by applying the concept of good jobs and bad jobs. We define good
job as being employed as paid employee, public or private (with payment information), bad job
as self-employed (without payment information), and unemployed as economically active but not employed or self-employed. Summary statistics is reported in Table 4. One catch here is that there is no clue to distinguish the cases such as when one is informal and self-employed but actually earning more than poorly paid public workers. Such cases should not be rare in a rapidly changing economy such as Ethiopia, but we proceed to empirical analysis with this categorization, assuming that paid-employee is preferred in general and thus regarded at least as better job, given high status value and image attached by the society.
[Table 4]
In estimating the employability of workers who finished lower TVET levels, we need com-parable group of workers whose quality as a worker is similar but with different educational history. On this point, we utilize the structure of educational system. In Ethiopia, only those who passed a threshold in the national examination (Primary School Leaving Certificate Ex-amination: PSLCE) can proceed to Secondary school. On the other hand, entrance to upper secondary school is screened by the national examination (Ethiopian General Secondary Ed-ucation Certificate Examination: EGSECE), and it seems to be rare that one choose TVET despite passing that exam. Based on this system, we assume that cognitive skill level is similar between those who finish Lower Secondary and TVET school. We also assume that those who finish upper secondary schools have higher cognitive skills than their peer, though the average ability as worker should not far apart from TVET graduates. In the meantime, if academic ability reflected in the test scores is further reflected in employability of a worker, upper sec-ondary school graduates should have advantage over TVET school graduates. Additionally, having graduated upper secondary should send strong signal as a good quality worker in labor market. In the same manner, being a TVET graduate should clearly signals as lower quality worker vis-`a-vis upper secondary school graduates, if employers view cognitive skills and the
record of general education as the reflection of worker’s ability. If any meaningful deviation exists between the results of signaling based on academic ability and actual economic returns, that should be interpreted as the result of market’s appreciation for TVET schooling in terms of the skills attained through training, or other ability such as better attitudes toward work.
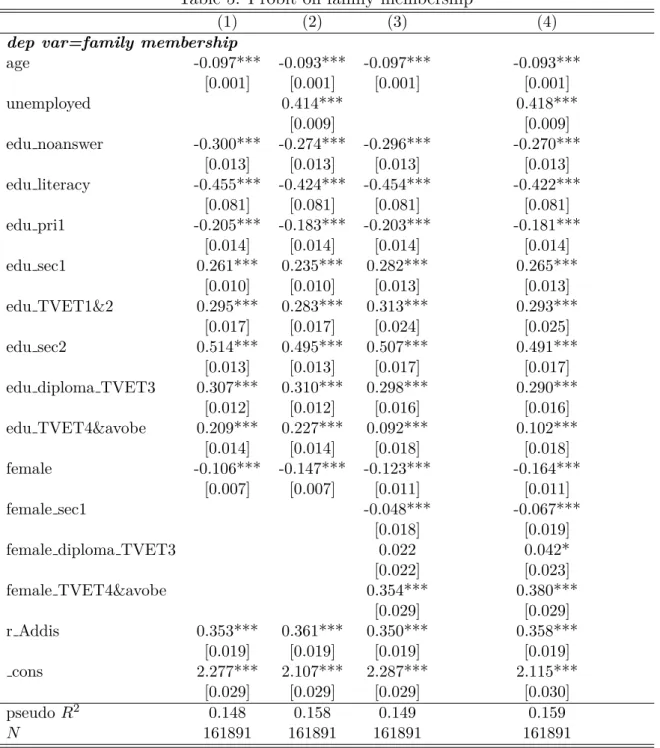
[Table 5]
5
Empirical analysis
5.1
Base regression
Before proceeding to the regressions of main interest, we run regressions on family membership, to see whether our working hypothesis is on the right track. Table5 shows the regression results of family membership of youth on available information. We confirm that the possibility to be living with parents’ family is highest among those with secondary to tertiary educational record, in Addis Ababa, and unemployed. Not surprisingly, family membership decreases as age goes up. We can also read that female youth are less likely to be living with family except
for those with high educational record.
We first run benchmark regressions without controlling any possible biases. Table 6 and Table 7 shows the results of probit regressions, where dependent are binary variables taking the each job status, unemployed; bad job; good job. We built two different sub samples for comparison purpose; first group consists of youth workers who finished either lower secondary school or TVET level 1 and 2, and second group consists of those who finished either TVET level 1 and 2 or upper secondary school. In this base regressions, TVET has no effect on unemployment, but TVET graduates are less likely to be in bad job, and more likely to be in good job in both subgroups. This result should not be surprising in comparison with lower secondary graduates, since having finished TVET clearly indicates the record of additional education and training. On the other hand, it is rather striking that TVET graduates enjoy better employability when compared with upper secondary. It is noteworthy that in both subsamples, the cross term of female and TVET is negative on unemployed and positive on good job, suggesting general positive influence of TVET on female employability. We also included family. The Coefficients appear with positive sign in the regression on unemployed in both subgroups, suggesting that workers living with their parents’ are more likely to be unemployed. Additionally, we also included family earning. From Table 3, family earning tends to be higher if youth is living with parents and working siblings. Regression results show that the higher the family earnings, the more likely the worker to stay unemployed. However, if we separate the sample into those who is living with parents and in independent household, the effect of family earnings is in fact opposite. For those who living with parents, family earnings works to reduce the possibility to stay unemployed, while for those in independent household, family earnings increases the possibility to be unemployed. While we should wait further regressions before interpreting the meaning of family earnings, this at least suggests that the family’s function as a support for unemployed is different in parents’ and own.
[Table 6] [Table 7]
5.2
Family membership as sample selection
Based on the benchmark regressions, we first test the possibility of sample selection. We assume that family information such as earning and education is endogenous, in that they are correlated with other unobserved information, which also determines family membership. To deal with sample selection, we employ a selection model based on Wooldrige (2010), where we treat family earnings as endogenous explanatory variable.
We think about a model consists of three equations as below.
y1 = x1δ1+ y2α1+ u1 (9)
y2 = x2δ2+ u2 (10)
y3 = 1[xδ3+ u3 > 0], (11)
where y1 is binary job status, x1 is a vector of control variables such as female dummy, age,
region and education (TVET), y2 is endogenous family earning which is observed only if the
worker is living with family. x2 is exogenous variables including x1, family education, and
marital status, where the last two variables serve as exclusion restrictions. y2 is binary
fam-ily membership dummy (famfam-ily), and and thus y2 is only observed when y3 = 1. z denotes
u3 are the error terms. We first regressed equation (11) and obtained the Inverse Mill’s Ratio
(IMR), which is used as one of the instruments, along with female household head dummy (feHHH ) number of siblings (n siblings). The second and third steps of regressions (equation 9 and 10) are estimated with IV probit, but linear two stage regression results are also reported.
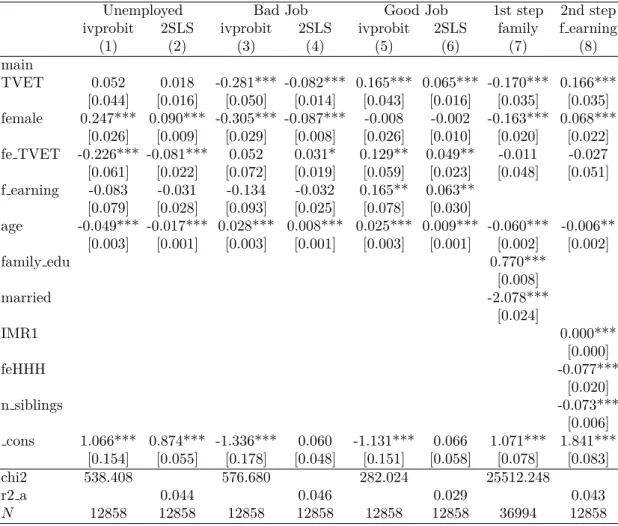
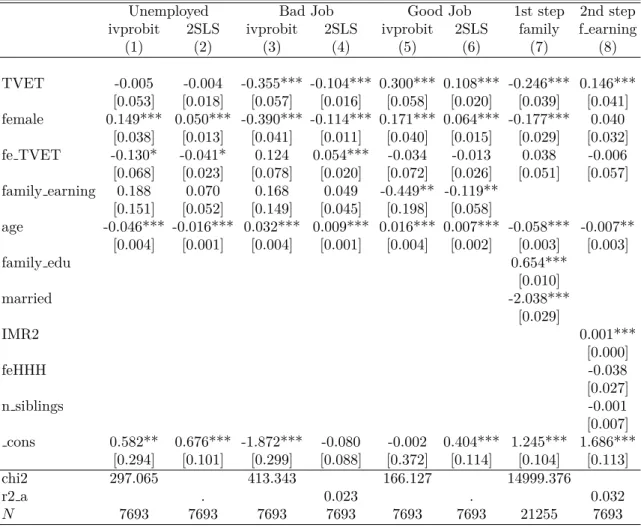
The results are shown in Table8 and Table9. In both subgroup, the final results are similar to the benchmark results. TVET schooling has no influence on unemployment, but workers finished TVET are less likely to be self-employed, and more likely to be in good job, even after controlling the family membership as sample selection and endogenity of family earning. The instrumented family earning is not statistically significant in regressions on unemployment and bad job, but positive and significant (5% level) in regression on good job in lower secondary and TVET subsample, suggesting that the higher the family earning, the higher the possibility to be in good job. On the other hand, the coefficient of family earning is negative and signifi-cant (5% level) in regression on good job in TVET and upper secondary subsample. However, given the fact that the coefficients of IMRs obtained from the first step regression and used as an instrument in the second step is statistically significant but close to zero, sample selection bias of family membership does not appear to be significant, though it can be suggesting the weakness of instruments.
[Table 8]
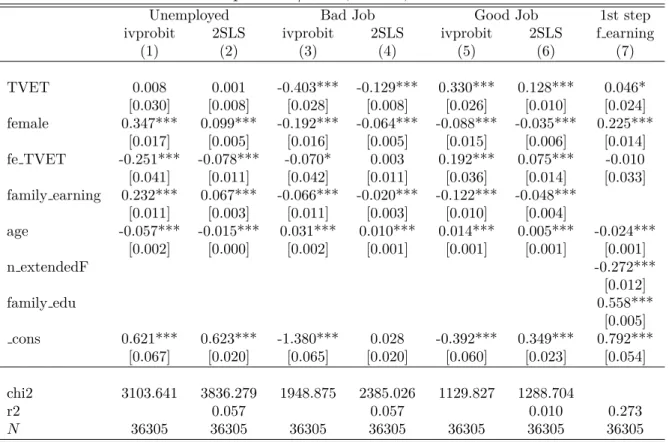
Having checked the weak sample selection, we run two step regressions without sample se-lection, by instrumenting family earning using other family information regardless of family membership. The results are shown in Table10 and Table11. While the results seems to be very similar to the regressions above, one important difference is that the coefficients of the instrumented family earnings are all statistically significant in both subgroups, and except for (3) and (4) in the second subgroup. The sign is positive in the regressions on unemployed, sug-gesting the existence of family support increases the possibility that a youth stays unemployed. On the other hand, in the regressions on good job, the signs are negative. In fact, the sign of family earnings on good job is not consistent through models so far, thus we cannot see clear effects of family support on getting a good job. To check further on this point, we now focus on the possibility that choice of TVET is also biased.
In the models above, we have treated educational choice as exogenous, and family earning as endogenous. However, parents’ background such as education, occupation or social status should have influenced not only on family’s economic capacity but also children’s educational choice.
[Table 9] [Table 10] [Table 11]
5.3
Endogenous educational choice
Given the results above, now we assume that educational choice was influenced by family back-ground, and thus treat TVET dummy as endogenous. Given the binary endogenous variable, here we apply bivariate probit model as below.
y1 = 1[z1δ1+ α1y2+ ν1 > 0] (12)
y2 = 1[zδ2+ ν2 > 0], (13)
where y1 is binary employment status, and y2 is TVET dummy. z1 and z are exogenous
variables. Here we treat family earnings and other variables related to family information (re-gardless of parents’ or own family) as exogenous, along with region dummies, age and female dummy.
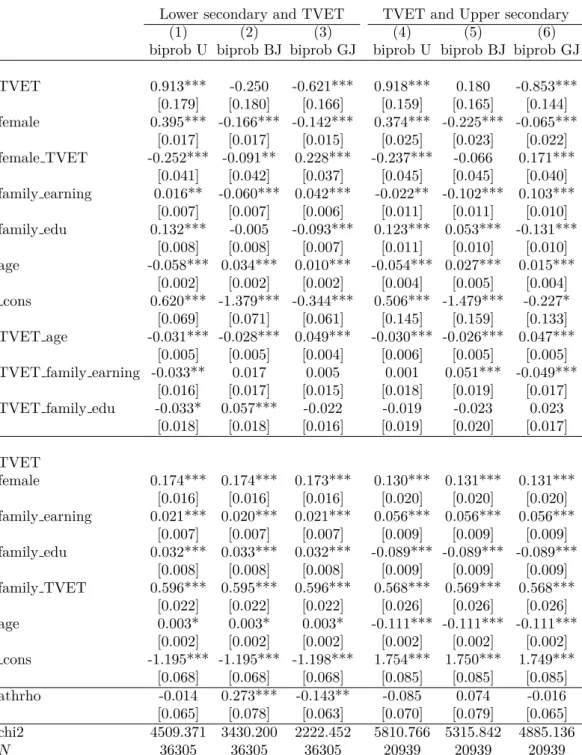
Table12 shows the regression results. Under the assumption of endogenous educational choice and exogenous family earnings, TVET schooling totally changes its impacts on employ-ability. In comparison with lower secondary, TVET graduates are more likely to be unemployed, and less likely to be in good job. Regrading the TVET effects on female, the cross terms with female dummy suggest TVET has positive effect on female employability, though the effect is not large enough to offset the inferior situation in employment. Family earning coefficient appears with positive sign in regression on unemployment, suggesting possibility to stay unem-ployed increase when family support is available. On the other hand, from the regressions on TVET, it is noteworthy that a worker in family with higher earnings and educational records tend to have chosen TVET, and those who have family member who went to TVET are more likely to have chosen TVET. Similarly, in comparison with upper secondary, TVET graduates are more likely to be unemployed, and less likely to be in good job. The regressions on TVET suggest that TVET are chosen by the workers with lower family educational records but higher family earnings. In both subgroups, females are more likely to have chosen TVET, reflecting the equal gender ratio in TVET schools, especially in lower levels.
[Table 12]
6
Conclusion
We have tested the impacts of TVET on employability of youth in urban Ethiopia. We first assumed existence of difference between those who living with parents’ family and not, whereby we treated education as exogenous. In those regressions the effect of TVET on employability was found positive in general, though our view that there is labor market segmentation between those living with family and independent, and thus, between with parents’ family support and without, was not denied, but the difference turned out to be not significant. This result may be due to the fact that we limited the sample to those who are economically active youth and those with educational record between lower secondary and upper secondary. Those youth may be already the “selected,” in Ethiopian society, that is, wealthy enough to enjoy good learning environment and allowed to stay in education without dropping out from school for living. If this was the case, it was unlikely to find a strong sample selection bias by current family membership.
Under our second hypothesis on endogenous educational choice, where we assumed that the segmentation has already started at school choice, we found positive effect of TVET phased out after controlling endogeneity of school choice and other family information. Compared to the benchmark results, this suggests that positive TVET effect comes from the specificity of workers who have chosen to go to TVET, such as strong aspiration and high motivation, as well as existence of financial support in job search. The results further imply the possibility
that TVET is seen as the last resort of educational path for those who was denied to proceed to further education, especially those who failed to enter upper secondary schools and females, but only if they are financially fit. These result must be reflecting the social background in Ethiopia, where there are only limited opportunities and alternatives for post lower-secondary education. As the number of youth increases and competition for wealth grows intense, ed-ucation should be becoming a must to survive the competition.One of the limitations of this analysis, along with lack of several important information, is that we do not have information on the financial cost of schooling in each level. Controlling the schooling cost will be the task for in future study.
As reviewed in the beginning section, TVET in Ehiopia has been promoted under the na-tional growth policy, and its objective is to increase the supply of skilled workers into industries. Our analysis suggest, however, the possibility that those who enter to TVET schools may not be industry oriented. Obviously, our analysis does not offer a discussion basis on the efficacy of public vocational schools. It is a fact that TVET graduates are enjoying better employability, while it does not necessarily mean the effect of vocational training. What we tested is rather a possible meaning of TVET vis-`a-vis conventional education. The results imply the demand for
educational chances, where TVET may be viewed as an last chance of education for youth in a society which is rapidly changing, and the educational aspiration and attainment is increasing.
A
Definition of family information variables
• family earning: Employment status of each family member is evaluated by a score, and summed up for each household except for non-relatives within the household and the worker self, and divided by the family size. Scores are defined as 1=unemployed; 2=in-formal self-employed; 3=2=in-formal self-employed; 4=in2=in-formal employee; 5=2=in-formal paid-employee. Economically dependent are attached score=0.
• family TVET : TVET score=1 is attached to family members if finished TVET and oth-erwise zero, regardless of age, and summed up for each household except for non-relatives within the household and the worker self.
• family edu: Education record (“highest education attained”) of each family member is evaluated by score. The categorization of education is basically according to UEUS, though adjusted by author for the changes in questions through survey years. Scores are defines as 0=not answered; 1=literacy; 2=lower primary; 3=upper primary; 4=lower sec-ondary; 5=TVET 1&2; 6=upper secsec-ondary; 7=diploma or TVET 3; 8=bachelor, TVET 4, and above. Family education score is calculated by summing up for each member education score except for non-relatives within the household and the worker self, and divided by the family size.
References
Acemoglu, D. (2001). Good jobs versus bad jobs. Journal of Labor Economics 19 (1), 1–12. Acemoglue, D. and J.-S. Pischke (2001). Changes in the wage structure, family income, and
children’s education. European Economic Review 45, 890–904.
African Union Committee (2006). African Youth Charter. African Union Committee. Bandiera, O., N. Buehren, R. Burgess, M. Goldstein, S. Gulesci, I. Rasul, and M. Sulaimany
(2012). Empowering adolescent girls: Evidence from a randomized control trial in uganda.
enGender Impact : the World Bank’s Gender Impact Evaluation Database, 1–46.
Bigsten, A., T. Mengistae, and A. Shimeles (2013). Labor market integration in urban ethiopia, 1994-2004. Economic Development and Cultural Change 61 (4), 889–931. Blattman, C., N. Fiala, and S. Martinez (2014). Generating skilled self-employment in
de-veloping countries: Experimental evidence from Uganda. The Quarterly Journal of
Eco-nomics, 697–752.
Card, D., P. Ibarrar´an, F. Regalia, D. Rosas-Shady, and Y. Soares (2011). The labor market impacts of youth training in the dominican republic. Journal of Labor Economics 29 (2), 267–300.
Central Statistical Agency (CSA) (2004). Report on Urban Bi-Annual Employment
Unem-ployment Survey. Addis Ababa, Federal Democratic Republic of Ethiopia: Central
Sta-tistical Agency (CSA).
Central Statistical Agency (CSA) (2006). Report on the 2006 Urban Employment
Unemploy-ment Survey. Addis Ababa, Federal Democratic Republic of Ethiopia: Central Statistical
Agency (CSA).
Central Statistical Agency (CSA) (2009). Statistical Report on Urban Employment
Unemploy-ment Survey. Addis Ababa, Federal Democratic Republic of Ethiopia: Central Statistical
Agency (CSA).
Cho, Y., D. Kalomba, A. M. Mobarak, and V. Orozco (2013). Gender differences in the effects of vocational training: Constraints on women and drop-out behavior. Policy Research
Working Paper, The World Bank 6545, 1–48.
Collier, P. and A. Hoeffler (2000). Greed and grievance in civil war. Policy Research Working
Paper 2355, 1–50.
Federal Ministry of Education (2015a). Education Sector Development Programme V (ESDP
V). Addis Ababa, Federal Democratic Republic of Ethiopia: Federal Ministry of
Educa-tion.
Federal Ministry of Education (2015b). Education Statistics Annual Abstract 2006 E.C
(2013/14 G.C). Addis Ababa, Federal Democratic Republic of Ethiopia: Federal Ministry
of Education.
Franklin, S. (2015). Location, search costs and youth unemployment: A randomized trial of transport subsidies in ethiopia. CSAE Working Paper WPS/2015-11, 1–67.
Hamory, J. H., M. Kremer, I. Mbiti, and E. Miguel (2015). Vocational Education in Kenya
-a R-andomized Ev-alu-ation. 3ie Gr-antee Fin-al Report. New Delhi: Intern-ation-al Initi-ative
for Impact Evaluation (3ie).
Heckman, J. J. and V. J. Hotz (1986). An investigation of the labor market earnings of panamanian males evaluating the sources of inequality. The Journal of Human
Joshi, R. D. and A. Verspoor (2013). Secondary Education in Ethiopia: Supporting Growth
and Transformation. A World Bank Study. Washington, D.C.: The World Bank.
King, K. (1993). Technical and vocational education and training in an international context.
The Vocational Aspect of Education 45 (3), 201–216.
Krishnan, P. (1996). Family background, education and employment in urban Ethiopia.
Oxford Bulletin of Economics and Statistics 58 (1), 167–183.
Krishnan, P., T. G. Selassie, and S. Dercon (1998). The urban labour market during struc-tural adjustment: Ethiopia 1990-1997. Working Paper, Centre for the Study of African
Economies, Institute of Economics and Statistics, University of Oxford WPS/98-9, 1–40.
Mains, D. (2012). Hope Is Cut: Youth, Unemployment, and the Future in Urban Ethiopia. Philadelphia, Pennsylvania: Temple Univeristy Press.
McElroy, M. B. and M. J. Horney (1981). Nash bargained household decisions: Toward a generalization of the theory of demand. International Economic Review 22 (2), 333–349. McMillan, M., D. Rodrik, and ´Inigo Verduzco-Gallo (2014). Globalization, structural change,
and productivity growth, with an update on Africa. World Development 63, 11–32. National Planning Commission (2016). Growth and Transformation Plan II (GTP II)
(2015/16-2019/20). Addis Ababa, Federal Democratic Republic of Ethiopia: National
Planning Commission.
Oketch, M. O. (2007). To vocationalise or not to vocationalise? Perspectives on current trends and issues in technical and vocational education and training (TVET) in africa.
International Journal of Educational Development 27, 220–234.
Psacharopoulos, G. (1987). To vocationalize or not to vocationalize? That is the curriculum question. International Review of Education 33, 187–211.
Rees, A. and W. Gray (1982). Family Effects in Youth Employment, pp. 453–474. Chicago and London: University of Chicago Press.
Ross, M. (2012). The Oil Curse. Princeton and Oxford: Princeton University Press.
Serneels, P. (2007). The nature of unemployment among young men in urban Ethiopia.
Review of Development Economics 11 (1), 170–186.
Shea, J. (2000). Does parents’ money matter? Journal of Public Economics 77, 155–184. Shimazu, Y. (2014). TVET reform as national development strategy in ethiopia. Journal of
International Cooperation in Education 17 (7), 63–75.
Wooldridge, J. M. (2010). Econometric Analysis of Cross Section and Panel Data, 2nd
Table 1: Education and family membership family membership 0 1 Total not answered 81.60 18.40 100.00 literacy 89.85 10.15 100.00 primry1 74.56 25.44 100.00 primry2 68.85 31.15 100.00 secndry1 56.93 43.07 100.00 TVET1&2 56.90 43.10 100.00 secndry2 56.81 43.19 100.00 Diploma/TVET3 63.00 37.00 100.00 TVET4/above 67.49 32.51 100.00 Total 66.37 33.63 100.00 Note: All year pooled, youth. Economically active.
Table 2: Unemployment by education (%)
unemployed education 0 1 Total not answered 87.44 12.56 100.00 literacy 91.76 8.24 100.00 primary1 87.46 12.54 100.00 primary2 83.84 16.16 100.00 secondary1 76.30 23.70 100.00 TVET1&2 77.85 22.15 100.00 secondary2 79.83 20.17 100.00 Diploma/TVET3 85.02 14.98 100.00 TVET4&above 91.01 8.99 100.00 Total 83.30 16.70 100.00 Note: All year pooled, youth. Economically active.
Table 3: Summary statistics for family related variables
variable family mean std. sev. N 0 0.489 1.114 29526 family earning 1 1.599 1.238 22371 0.968 1.291 51897 0 0.039 0.199 29526 family TVET 1 0.145 0.326 22371 0.845 0.433 51897 0 1.196 1.197 29526 family edu 1 2.405 1.142 22371 1.717 1.267 51897 Note: Economically active, age 17-35, Sec1, TVET, Sec2.
Table 4: Summary statistics for employment status by education
TVET
Lower secondary and TVET TVET and Upper secondary
unemployed 0 1 total 0 1 total
0 23,381 4,945 28,326 4,945 11,897 16,842 1 7,261 1,407 8,668 1,407 3,006 4,413 total 30,642 6,352 36,994 6,352 14,903 21,255
bad job 0 1 total 0 1 total
0 21,268 5,272 26,540 5,272 10,429 15,701 1 9,374 1,080 10,454 1,080 4,474 5,554 total 30,642 6,352 36,994 6,352 14,903 21,255
good job 0 1 total 0 1 total
0 16,635 2,487 19,122 2,487 7,480 9,967 1 14,007 3,865 17,872 3,865 7,423 11,288 total 30,642 6,352 36,994 6,352 14,903 21,255 Note:Youth, age 17-35, economically active only.
Table 5: Probit on family membership
(1) (2) (3) (4)
dep var=family membership
age -0.097*** -0.093*** -0.097*** -0.093*** [0.001] [0.001] [0.001] [0.001] unemployed 0.414*** 0.418*** [0.009] [0.009] edu noanswer -0.300*** -0.274*** -0.296*** -0.270*** [0.013] [0.013] [0.013] [0.013] edu literacy -0.455*** -0.424*** -0.454*** -0.422*** [0.081] [0.081] [0.081] [0.081] edu pri1 -0.205*** -0.183*** -0.203*** -0.181*** [0.014] [0.014] [0.014] [0.014] edu sec1 0.261*** 0.235*** 0.282*** 0.265*** [0.010] [0.010] [0.013] [0.013] edu TVET1&2 0.295*** 0.283*** 0.313*** 0.293*** [0.017] [0.017] [0.024] [0.025] edu sec2 0.514*** 0.495*** 0.507*** 0.491*** [0.013] [0.013] [0.017] [0.017] edu diploma TVET3 0.307*** 0.310*** 0.298*** 0.290***
[0.012] [0.012] [0.016] [0.016] edu TVET4&avobe 0.209*** 0.227*** 0.092*** 0.102*** [0.014] [0.014] [0.018] [0.018] female -0.106*** -0.147*** -0.123*** -0.164*** [0.007] [0.007] [0.011] [0.011] female sec1 -0.048*** -0.067*** [0.018] [0.019]
female diploma TVET3 0.022 0.042*
[0.022] [0.023] female TVET4&avobe 0.354*** 0.380*** [0.029] [0.029] r Addis 0.353*** 0.361*** 0.350*** 0.358*** [0.019] [0.019] [0.019] [0.019] cons 2.277*** 2.107*** 2.287*** 2.115*** [0.029] [0.029] [0.029] [0.030] pseudo R2 0.148 0.158 0.149 0.159 N 161891 161891 161891 161891
Note: Base education is upper secondary. Region and year dummies are included.
Table 6: Benchmark Probit, Youth, Lower secondary and TVET
(1) (2) (3) (4) (5) (6) (7) (8) (9) (10) (11) (12) (13) (14) (15)
Unemployed Bad Job Good Job
TVET 0.047 0.044 0.040 0.066* 0.009 -0.406*** -0.406*** -0.403*** -0.303*** -0.482*** 0.306*** 0.308*** 0.306*** 0.166*** 0.440*** [0.029] [0.030] [0.030] [0.038] [0.052] [0.028] [0.028] [0.028] [0.043] [0.037] [0.025] [0.025] [0.025] [0.037] [0.036] female 0.418*** 0.473*** 0.397*** 0.229*** 0.718*** -0.215*** -0.233*** -0.193*** -0.356*** -0.129*** -0.126*** -0.136*** -0.130*** 0.042* -0.281*** [0.016] [0.017] [0.017] [0.023] [0.026] [0.016] [0.016] [0.016] [0.026] [0.021] [0.015] [0.015] [0.015] [0.022] [0.020] fe TVET -0.238*** -0.244*** -0.246*** -0.194*** -0.273*** -0.073* -0.071* -0.070* 0.086 -0.143*** 0.185*** 0.185*** 0.189*** 0.075 0.241*** [0.040] [0.040] [0.040] [0.055] [0.064] [0.041] [0.041] [0.042] [0.066] [0.054] [0.035] [0.035] [0.036] [0.053] [0.049] family 0.501*** -0.265*** -0.154*** [0.016] [0.016] [0.014] f earning 0.060*** -0.034*** 0.062*** -0.062*** -0.045*** -0.051*** 0.005 0.062*** -0.000 [0.005] [0.008] [0.008] [0.005] [0.010] [0.007] [0.005] [0.008] [0.006] age -0.062*** -0.047*** -0.062*** -0.042*** -0.048*** 0.032*** 0.024*** 0.031*** 0.029*** 0.022*** 0.016*** 0.011*** 0.017*** 0.017*** 0.006*** [0.002] [0.002] [0.002] [0.003] [0.003] [0.002] [0.002] [0.002] [0.003] [0.002] [0.001] [0.002] [0.001] [0.002] [0.002] cons 0.986*** 0.244*** 0.907*** 0.849*** 0.026 -1.479*** -1.105*** -1.385*** -1.462*** -1.003*** -0.578*** -0.354*** -0.599*** -0.843*** -0.078 [0.063] [0.068] [0.064] [0.086] [0.106] [0.062] [0.066] [0.063] [0.097] [0.089] [0.056] [0.060] [0.057] [0.083] [0.085]
family membership yes no yes no yes no
chi2 3108.941 4074.169 3210.476 635.573 1935.321 2060.858 2345.929 2172.472 795.230 1019.261 1022.449 1135.420 1031.175 375.974 901.026 r2 p 0.077 0.101 0.081 0.031 0.111 0.047 0.053 0.050 0.048 0.039 0.020 0.022 0.021 0.01 7 0.032
N 36994 36994 36305 15934 20371 36994 36994 36305 15934 20371 36994 36994 36305 15934 20371 Note: Region and year dummies are included.
Table 7: Benchmark Probit, Youth, TVET and Upper secondary
(1) (2) (3) (4) (5) (6) (7) (8) (9) (10) (11) (12) (13) (14) (15)
Unemployed Bad Job Good Job
TVET -0.022 0.007 -0.018 0.051 -0.039 -0.379*** -0.393*** -0.385*** -0.331*** -0.440*** 0.336*** 0.326*** 0.335*** 0.208*** 0.438*** [0.034] [0.034] [0.034] [0.044] [0.059] [0.031] [0.031] [0.032] [0.048] [0.042] [0.028] [0.028] [0.029] [0.042] [0.040] female 0.392*** 0.433*** 0.385*** 0.172*** 0.721*** -0.245*** -0.254*** -0.231*** -0.383*** -0.149*** -0.056*** -0.063*** -0.063*** 0.136*** -0.231*** [0.024] [0.025] [0.025] [0.034] [0.038] [0.023] [0.023] [0.023] [0.037] [0.030] [0.021] [0.021] [0.021] [0.032] [0.029] fe TVET -0.216*** -0.210*** -0.228*** -0.136** -0.270*** -0.052 -0.055 -0.040 0.108 -0.137** 0.126*** 0.121*** 0.126*** -0.0 19 0.196*** [0.044] [0.044] [0.044] [0.061] [0.070] [0.044] [0.044] [0.045] [0.071] [0.058] [0.038] [0.039] [0.039] [0.058] [0.053] family 0.483*** -0.189*** -0.188*** [0.022] [0.021] [0.019] f earning 0.035*** -0.070*** 0.049*** -0.065*** -0.041*** -0.063*** 0.027*** 0.090*** 0.020** [0.008] [0.012] [0.011] [0.008] [0.013] [0.010] [0.007] [0.011] [0.009] age -0.067*** -0.051*** -0.066*** -0.048*** -0.055*** 0.027*** 0.020*** 0.025*** 0.028*** 0.016*** 0.025*** 0.019*** 0.026*** 0.021*** 0.015*** [0.002] [0.002] [0.002] [0.003] [0.004] [0.002] [0.002] [0.002] [0.004] [0.003] [0.002] [0.002] [0.002] [0.003] [0.003] cons 1.085*** 0.362*** 1.038*** 0.949*** 0.282** -1.469*** -1.193*** -1.364*** -1.466*** -1.089*** -0.657*** -0.375*** -0.717*** -0.891*** -0.135 [0.086] [0.092] [0.087] [0.117] [0.144] [0.084] [0.090] [0.086] [0.130] [0.122] [0.076] [0.081] [0.077] [0.111] [0.114]
family membership yes no yes no yes no
chi2 1601.190 2085.530 1616.288 427.126 932.275 1299.307 1380.427 1372.374 537.031 744.142 765.295 861.898 784.743 316.456 645.592 r2 p 0.074 0.096 0.075 0.038 0.102 0.053 0.057 0.057 0.057 0.052 0.026 0.029 0.027 0.02 5 0.040
N 21255 21255 20939 9175 11764 21255 21255 20939 9175 11764 21255 21255 20939 9175 11764 Note: Region and year dummies are included.
Table 8: 2step Probit/2SLS with sample selection, Lower secondary and TVET
Unemployed Bad Job Good Job 1st step 2nd step ivprobit 2SLS ivprobit 2SLS ivprobit 2SLS family f earning
(1) (2) (3) (4) (5) (6) (7) (8) main TVET 0.052 0.018 -0.281*** -0.082*** 0.165*** 0.065*** -0.170*** 0.166*** [0.044] [0.016] [0.050] [0.014] [0.043] [0.016] [0.035] [0.035] female 0.247*** 0.090*** -0.305*** -0.087*** -0.008 -0.002 -0.163*** 0.068*** [0.026] [0.009] [0.029] [0.008] [0.026] [0.010] [0.020] [0.022] fe TVET -0.226*** -0.081*** 0.052 0.031* 0.129** 0.049** -0.011 -0.027 [0.061] [0.022] [0.072] [0.019] [0.059] [0.023] [0.048] [0.051] f earning -0.083 -0.031 -0.134 -0.032 0.165** 0.063** [0.079] [0.028] [0.093] [0.025] [0.078] [0.030] age -0.049*** -0.017*** 0.028*** 0.008*** 0.025*** 0.009*** -0.060*** -0.006** [0.003] [0.001] [0.003] [0.001] [0.003] [0.001] [0.002] [0.002] family edu 0.770*** [0.008] married -2.078*** [0.024] IMR1 0.000*** [0.000] feHHH -0.077*** [0.020] n siblings -0.073*** [0.006] cons 1.066*** 0.874*** -1.336*** 0.060 -1.131*** 0.066 1.071*** 1.841*** [0.154] [0.055] [0.178] [0.048] [0.151] [0.058] [0.078] [0.083] chi2 538.408 576.680 282.024 25512.248 r2 a 0.044 0.046 0.029 0.043 N 12858 12858 12858 12858 12858 12858 36994 12858 Note: Region and year dummies are included. Sample restricted to family=1 except for (7).
Table 9: 2step Probit/2SLS with sample selection, TVET and upper secondary
Unemployed Bad Job Good Job 1st step 2nd step ivprobit 2SLS ivprobit 2SLS ivprobit 2SLS family f earning
(1) (2) (3) (4) (5) (6) (7) (8) TVET -0.005 -0.004 -0.355*** -0.104*** 0.300*** 0.108*** -0.246*** 0.146*** [0.053] [0.018] [0.057] [0.016] [0.058] [0.020] [0.039] [0.041] female 0.149*** 0.050*** -0.390*** -0.114*** 0.171*** 0.064*** -0.177*** 0.040 [0.038] [0.013] [0.041] [0.011] [0.040] [0.015] [0.029] [0.032] fe TVET -0.130* -0.041* 0.124 0.054*** -0.034 -0.013 0.038 -0.006 [0.068] [0.023] [0.078] [0.020] [0.072] [0.026] [0.051] [0.057] family earning 0.188 0.070 0.168 0.049 -0.449** -0.119** [0.151] [0.052] [0.149] [0.045] [0.198] [0.058] age -0.046*** -0.016*** 0.032*** 0.009*** 0.016*** 0.007*** -0.058*** -0.007** [0.004] [0.001] [0.004] [0.001] [0.004] [0.002] [0.003] [0.003] family edu 0.654*** [0.010] married -2.038*** [0.029] IMR2 0.001*** [0.000] feHHH -0.038 [0.027] n siblings -0.001 [0.007] cons 0.582** 0.676*** -1.872*** -0.080 -0.002 0.404*** 1.245*** 1.686*** [0.294] [0.101] [0.299] [0.088] [0.372] [0.114] [0.104] [0.113] chi2 297.065 413.343 166.127 14999.376 r2 a . 0.023 . 0.032 N 7693 7693 7693 7693 7693 7693 21255 7693 Note: Region and year dummies are included. Sample restricted to family=1 except for (7).
Table 10: 2step Probit/2SLS, Youth, Sec1 and TVET
Unemployed Bad Job Good Job 1st step ivprobit 2SLS ivprobit 2SLS ivprobit 2SLS f earning
(1) (2) (3) (4) (5) (6) (7) TVET 0.008 0.001 -0.403*** -0.129*** 0.330*** 0.128*** 0.046* [0.030] [0.008] [0.028] [0.008] [0.026] [0.010] [0.024] female 0.347*** 0.099*** -0.192*** -0.064*** -0.088*** -0.035*** 0.225*** [0.017] [0.005] [0.016] [0.005] [0.015] [0.006] [0.014] fe TVET -0.251*** -0.078*** -0.070* 0.003 0.192*** 0.075*** -0.010 [0.041] [0.011] [0.042] [0.011] [0.036] [0.014] [0.033] family earning 0.232*** 0.067*** -0.066*** -0.020*** -0.122*** -0.048*** [0.011] [0.003] [0.011] [0.003] [0.010] [0.004] age -0.057*** -0.015*** 0.031*** 0.010*** 0.014*** 0.005*** -0.024*** [0.002] [0.000] [0.002] [0.001] [0.001] [0.001] [0.001] n extendedF -0.272*** [0.012] family edu 0.558*** [0.005] cons 0.621*** 0.623*** -1.380*** 0.028 -0.392*** 0.349*** 0.792*** [0.067] [0.020] [0.065] [0.020] [0.060] [0.023] [0.054] chi2 3103.641 3836.279 1948.875 2385.026 1129.827 1288.704 r2 0.057 0.057 0.010 0.273 N 36305 36305 36305 36305 36305 36305 36305 Note: Region and year dummies are included.
Table 11: 2step Probit/2SLS, Youth, TVET and Upper Secondary
Unemployed Bad Job Good Job 1st step ivprobit 2SLS ivprobit 2SLS ivprobit 2SLS f earning
(1) (2) (3) (4) (5) (6) (7) TVET -0.031 -0.010 -0.389*** -0.123*** 0.349*** 0.133*** 0.096*** [0.034] [0.008] [0.032] [0.009] [0.029] [0.011] [0.025] female 0.345*** 0.089*** -0.247*** -0.081*** -0.019 -0.008 0.162*** [0.025] [0.007] [0.023] [0.008] [0.022] [0.009] [0.019] fe TVET -0.237*** -0.063*** -0.044 0.010 0.136*** 0.053*** 0.058* [0.045] [0.012] [0.045] [0.012] [0.040] [0.015] [0.035] family earning 0.185*** 0.051*** -0.009 -0.001 -0.128*** -0.049*** [0.015] [0.004] [0.014] [0.004] [0.013] [0.005] age -0.062*** -0.017*** 0.026*** 0.008*** 0.022*** 0.008*** -0.021*** [0.002] [0.001] [0.002] [0.001] [0.002] [0.001] [0.002] n extendedF -0.138*** [0.013] family edu 0.546*** [0.006] cons 0.773*** 0.654*** -1.459*** 0.013 -0.449*** 0.333*** 0.695*** [0.091] [0.026] [0.089] [0.026] [0.081] [0.031] [0.070] chi2 1561.179 1857.475 1209.539 1435.523 805.192 1012.222 r2 a 0.053 0.058 0.010 0.304 N 20939 20939 20939 20939 20939 20939 20939 Note: Region and year dummies are included.
Table 12: Bivariate Probit
Lower secondary and TVET TVET and Upper secondary (1) (2) (3) (4) (5) (6) biprob U biprob BJ biprob GJ biprob U biprob BJ biprob GJ TVET 0.913*** -0.250 -0.621*** 0.918*** 0.180 -0.853*** [0.179] [0.180] [0.166] [0.159] [0.165] [0.144] female 0.395*** -0.166*** -0.142*** 0.374*** -0.225*** -0.065*** [0.017] [0.017] [0.015] [0.025] [0.023] [0.022] female TVET -0.252*** -0.091** 0.228*** -0.237*** -0.066 0.171*** [0.041] [0.042] [0.037] [0.045] [0.045] [0.040] family earning 0.016** -0.060*** 0.042*** -0.022** -0.102*** 0.103*** [0.007] [0.007] [0.006] [0.011] [0.011] [0.010] family edu 0.132*** -0.005 -0.093*** 0.123*** 0.053*** -0.131*** [0.008] [0.008] [0.007] [0.011] [0.010] [0.010] age -0.058*** 0.034*** 0.010*** -0.054*** 0.027*** 0.015*** [0.002] [0.002] [0.002] [0.004] [0.005] [0.004] cons 0.620*** -1.379*** -0.344*** 0.506*** -1.479*** -0.227* [0.069] [0.071] [0.061] [0.145] [0.159] [0.133] TVET age -0.031*** -0.028*** 0.049*** -0.030*** -0.026*** 0.047*** [0.005] [0.005] [0.004] [0.006] [0.005] [0.005] TVET family earning -0.033** 0.017 0.005 0.001 0.051*** -0.049***
[0.016] [0.017] [0.015] [0.018] [0.019] [0.017] TVET family edu -0.033* 0.057*** -0.022 -0.019 -0.023 0.023
[0.018] [0.018] [0.016] [0.019] [0.020] [0.017] TVET female 0.174*** 0.174*** 0.173*** 0.130*** 0.131*** 0.131*** [0.016] [0.016] [0.016] [0.020] [0.020] [0.020] family earning 0.021*** 0.020*** 0.021*** 0.056*** 0.056*** 0.056*** [0.007] [0.007] [0.007] [0.009] [0.009] [0.009] family edu 0.032*** 0.033*** 0.032*** -0.089*** -0.089*** -0.089*** [0.008] [0.008] [0.008] [0.009] [0.009] [0.009] family TVET 0.596*** 0.595*** 0.596*** 0.568*** 0.569*** 0.568*** [0.022] [0.022] [0.022] [0.026] [0.026] [0.026] age 0.003* 0.003* 0.003* -0.111*** -0.111*** -0.111*** [0.002] [0.002] [0.002] [0.002] [0.002] [0.002] cons -1.195*** -1.195*** -1.198*** 1.754*** 1.750*** 1.749*** [0.068] [0.068] [0.068] [0.085] [0.085] [0.085] athrho -0.014 0.273*** -0.143** -0.085 0.074 -0.016 [0.065] [0.078] [0.063] [0.070] [0.079] [0.065] chi2 4509.371 3430.200 2222.452 5810.766 5315.842 4885.136 N 36305 36305 36305 20939 20939 20939 Note: Region and year dummies are included. athrho is arc hyperbolic tangent ρ.