環境毒性学会誌 (Jpn. J. Environ. Toxicol.), 24, 33–42, 2021
Research Notes
Strategy for development of quantitative structure–
activity–activity relationship models for chronic fish toxicity:
prediction of early-life stage toxicity to
Oryzias latipes from acute Daphnia magna toxicity
Ayako FURUHAMA1, 2, *, Takehiko I. HAYASHI2 and Hiroshi YAMAMOTO2 1 Division of Genetics and Mutagenesis, National Institute of Health Sciences/
3–25–26 Tonomachi, Kawasaki-ku, Kawasaki, Kanagawa 210–9501, Japan
2 Center for Health and Environmental Risk Research, National Institute for
Environmental Studies/16–2 Onogawa, Tsukuba, Ibaraki 305–8506, Japan
ABSTRACT
We examined two groups of quantitative structure–activity–activity relationship (QSAAR) models for predicting Japanese medaka (Oryzias latipes) early-life stage (ELS) toxicities of chemicals for the purpose of chronic hazard and environmental risk assessments. The models included not only typical molecular descriptors but also acute Daphnia magna toxicity data, ELS test conditions, and information about chemical categories (e.g., pesticides). We found that acute Daphnia magna toxicity was an important descriptor for predicting fish ELS toxicity, along with molecular de-scriptors. The group II models, which were based on 119 training data for three warm freshwater species (fathead minnow, Japanese medaka, and zebrafish) had higher predictivity than the group I models, which were based on a 172 training data for four freshwater species (fathead minnow, Japanese medaka, zebrafish, and rainbow trout). In addition, the group II models had higher predictivity than the QSAAR models we reported previously (SAR QSAR Environ. Res. 29 : 9, 725–742 and 30 : 11, 825–846). Models developed by means of the strategy used to develop the group II models would be usable for estimating chronic fish toxicity in screening assessments such as those required under the Japanese Chemical Substances Control Law.
Key words: acute Daphnia magna toxicity, fish early-life stage (ELS), Japanese
medaka (Oryzias latipes), no-observed-effect concentration (NOEC), QSAAR toxicity predictions
1. INTRODUCTION
Fish early-life stage (ELS) toxicity tests are important tools for obtaining chronic toxicity data for hazard and environmental risk as-sessments required by regulations such as the
Japanese Chemical Substances Control Law (CSCL)1, 2). Because of animal welfare concerns
and testing costs, in silico methodologies (e.g., quantitative structure–activity relationships [QSARs]) have been developed for predicting
fish ELS toxicities3, 4). Global QSAR5) models,
which are intended to cover diverse categories of chemicals with various modes of action, are the only feasible models for predicting fish ELS toxicity because the quantity of fish ELS toxicity data is insufficient for developing local models for each category. In our previous stud-ies6, 7), we introduced concepts that are useful
for developing global linear regression QSAR models, quantitative activity–activity relation-ship (QAAR) models, and quantitative struc-ture–activity–activity relationship (QSAAR) models for predicting fish ELS toxicity. Activity data (acute Daphnia magna toxicity data), mo-lecular properties (including physicochemical properties), and three-dimensional structural parameters were evaluated as descriptor can-didates to develop these global models; and we found that acute Daphnia magna toxicity is a key descriptor for predicting fish ELS tox-icities. In these previous studies, we did not use acute fish toxicity data as a descriptor for QSAAR development, for two reasons. First, incorporation of acute fish toxicity data can lead to additional uncertainty due to sensi-tivity differences among various fish species; using data for a single species, such as
Daph-nia magna, avoids this problem. Second, like
chronic fish toxicity tests, acute fish toxicity tests will be used less in the future because of concerns about animal welfare. Therefore, we were motivated to examine the predictive abil-ity of QSAAR models that do not use acute fish toxicity data.
In our first article on this topic (2018)6), we
reported the development of QSAARs for pre-dicting fish ELS toxicities by using a training set consisting of 77 ELS toxicity data for fat-head minnow (FHM). However, the training data were biased toward pesticides: 67 of the 77 chemicals in the set originated from the Pesticide Ecotoxicity Database of the United States Environmental Protection Agency (US EPA) Office of Pesticide Programs8). In our
second article (2019)7), we described the
devel-opment of QSAARs oriented toward industrial chemicals, which are important for chronic hazard and environmental risk assessments in regulatory contexts. The training set for these QSAARs consisted of 55 fish ELS toxicity data for four freshwater species: FHM, Japanese medaka (MED, Oryzias latipes), zebrafish (ZEB), and rainbow trout (RT). However, be-cause the training set was small, the resulting models lacked power for predicting fish ELS toxicities. In the current study, our goal was to increase the number of training data and improve our strategy for toxicity data collection as follows: the chemicals in the training set should not be restricted to nonpesticides; data should be collected for more than one fresh-water species; and finally, the data should be re-collected using the latest data sources (e.g., the latest version of the QSAR Toolbox).
In this research note, we report our eval-uation of the efficiency of MED ELS toxicity prediction using models developed with two freshwater fish training data sets, one set that included toxicity data for a cold freshwater fish (RT) and one set that did not. We focused on ELS toxicity to MED, a warm freshwater fish, because of the usefulness of such data for the Japanese CSCL. Tests of toxicity to cold and warm freshwater species differ not only in test temperature but also in test conditions such as duration. We speculated that models developed by using data for three warm fresh-water fish (FHM, MED, and ZEB) would be more effective than models developed by using data for all four of the fish species used in our previous work. Additionally, the QSAAR models described herein included descriptors that accounted for types of toxicity endpoints, pesticide categories, and fish species in order to encompass the variety of data. Furthermore, to improve the training data set, we re-collected both fish ELS and acute Daphnia magna data by using ver. 4.3 of the QSAR Toolbox9);
pre-viously we had used ver. 3.4. Re-collection al-lowed us to benefit from data updates and bug fixes that were made after the release of ver. 3.4.
2. MATERIALS AND METHODS
A flowchart of the steps for model develop-ment (along with corresponding section num-bers in this research note) is shown in Fig. 1.
2.1 Toxicity data
We used the QSAR Toolbox (ver. 4.3)9) to
collect chemical structural information in the form of SMILES (Simplified Molecular Input Line Entry System) strings10), along with
training data in the form of no-observed-effect concentrations (NOECs in mg L−1) for FHM,
MED, ZEB, and RT. From among the observed endpoints in each fish ELS test, we defined the lowest NOEC values as the endpoints for fish ELS toxicity. For some of the training data in this study, NOECs were available for more than one endpoint. In such cases, we chose
the lowest NOEC associated with the differ-ent endpoints as the NOEC. To extend the training data as far as possible, we collected test data with test durations and conditions that were close to those specified by OECD Test Guideline 21011). The QSAR Toolbox (ver.
4.3) was also used to collect acute Daphnia
magna toxicity data for the training
chemi-cals: specifically, 48-h (or 24-h) 50% lethal or effective concentration (LC50 or EC50 in mg L−1)
was used as a descriptor. In this study, the designation EC50 was used both for EC50 and for LC50. For development of the models, fish ELS and acute Daphnia magna toxicity data in units of milligrams per liter were converted to units of millimoles per liter (mM) and then to the corresponding common logarithmic val-ues, that is, log(1/NOEC [mM]) and log(1/EC50 [mM]), respectively. The use of the common logarithmic values with the inverse of the EC50 or NOEC value are following the description by the QSAR in View of Energy Relation-ship 12). According to the QSAR reviews by
Hansch et al.13), 1/C values are standard in the
biological QSAR. Here C means concentration of chemicals. The procedures for the collection and treatment of toxicity data were the same as those used in our previous work7).
In the current work, we validated the models with the same MED ELS and acute Daphnia
magna toxicity data that were used for
valida-tion of the models in our previous studies6, 7).
Specifically, the external validation dataset comprised data for 36 chemicals (Appendix 1). These data were obtained from a set of data collected by the Japanese Ministry of the En-vironment14) by means of OECD Test
Guide-line 21011). In other words, we focused on the
development of models for predicting ELS tox-icity not for fish in general but rather for MED specifically. Using the same external validation dataset that was used in the previous studies allowed us to directly compare the predictive performance of the QSAAR models in this Fig. 1. Model development flowchart.
study with the performance of the previously reported models.
2.2 Descriptors
The descriptor candidates in this study included the molecular descriptors (physi-cochemical properties such as distribution coefficient and water solubility, structural parameters such as absence/presence of an aniline substructure, and three-dimensional structural parameters such as quantum chem-ical descriptors) used in our 2019 work7). In the
development of our models, we considered not only two-dimensional molecular descriptors but also three-dimensional quantum chemical descriptors, which may account for more-com-plex features of a compound. In addition, we added molecular descriptors for the numbers of three- and five-membered rings and the pres-ence/absence of such rings. In total, 114 molec-ular descriptors were available as descriptor candidates. The pesticide categories listed in
The Pesticide Manual15), endpoints used to
define NOEC (growth, development, hatch, reproduction, survival, and others), and fish species (FHM, MED, ZEB, and RT) were also used as descriptor candidates for developing the QSAARs. Note that we used 1/0 indicator variables to express the type of pesticide, test condition, fish species. For example, a test was used as zebrafish, i_FHM=0, i_MED=0, i_ZEB=1, i_RT=0.
2.3 Model development
We developed linear multiple regression QSAAR models for fish ELS toxicity predic-tion by using the same procedure and the same software used in our previous studies6, 7).
Briefly, we used a genetic algorithm to select descriptors from the descriptor candidates (de-scribed in section 2.2) for the models16). From
the resulting genetic-algorithm-based models, we selected 100 models on the basis of lack of fit (LOF) score, which is proportional to
least-squares error and is influenced by the number of descriptors as a penalty for overfitting16). For
the model developments, we used the Molec-ular Operating Environment (MOE) software package17) with the settings for the QuaSAR
Evolution program18). The overview of
genet-ic-algorithms in some commercial softwares including MOE was summarized by Schefzick
et al.19) Also, we previously demonstrated the
effectiveness of the use of the 100 best QSAAR models on the basis of LOF score20).
We then selected the model with the lowest LOF score, the model with the fewest descrip-tors, and the model with the lowest Akaike s information criterion (AIC)21): the three
mod-els are selected from the 100 best modmod-els on the basis of LOF score. LOF, the number of descriptors, and AIC are commonly used in-dicators for selecting good models. A low LOF indicates a model with a small least-squares error with a small number of descriptors; the number of descriptors is an indicator that can be used to avoid over-fitting; and AIC is an indicator of model predictivity (the model with the lowest AIC is regarded as the model with the best predictivity).
3. RESULTS AND DISCUSSION
3.1 Overview of the chemicals in the training set
The training set comprised fish ELS toxicity data for 172 chemicals (Appendix 2): 100 FHM data, 5 MED data, 14 ZEB data, and 53 RT data. There were 119 data for warm freshwa-ter fish (i.e., data remaining affreshwa-ter exclusion of 53 data for RT). This data set is larger than the data sets used in our previous studies6, 7).
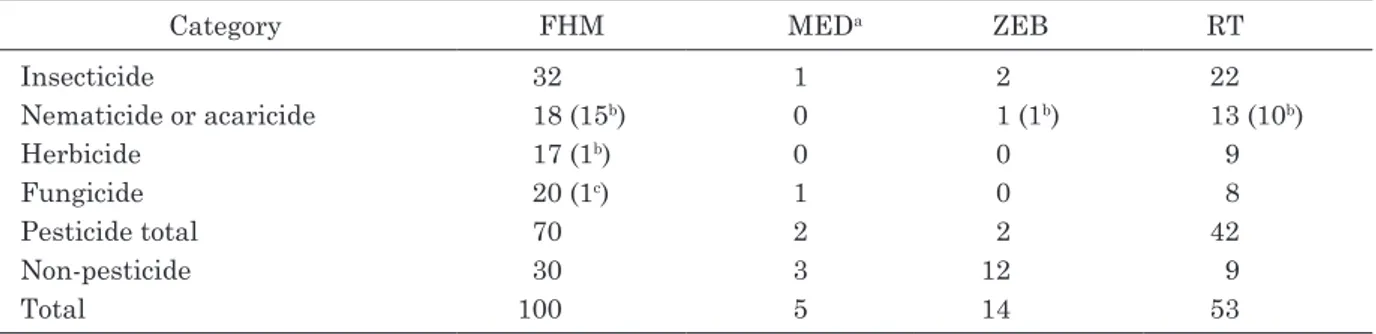
Note that for some chemicals, there were tox-icity values for more than one fish species (e.g., FHM and ZEB toxicity values for some of the anilines; Appendix 2); these values were treat-ed as separate data points. Table 1 shows that 70 of the 100 chemicals with FHM data and 42 of 53 chemicals with RT data were pesticides; the corresponding numbers for insecticides
were 32 of 100 and 22 of 53, respectively. Nota-bly, more than half of the chemicals with FHM and RT data were pesticides. One reason for this is that 69 chemicals with FHM data and 45 chemicals with RT data are listed in the US EPA Office of Pesticide Programs Pesticide Ec-otoxicity Database8). Note that because the
pes-ticides in Table 1 and Appendix 2 were defined according to the categorization scheme in The
Pesticide Manual15), not all of the chemicals
selected from the US EPA Pesticide Ecotoxicity Database for the training set were categorized as pesticides in this analysis. In our previous work on external validation of models for pre-dicting chronic Daphnia magna toxicity22), we
found that special attention is required when estimating pesticide toxicity under the QSAAR/ QAAR framework; specifically, residuals be-tween experimental and predicted toxicity val-ues for pesticides are particularly high. This is one of the reasons that we used the category of pesticides as descriptor candidates in our cur-rent models.
We also included information about ELS testing endpoints as descriptor candidates. The selected endpoints as defined in this study are shown in Fig. 2. The endpoint definitions were based on the QSAR Toolbox ver. 4.3 with some modifications, and the definitions did not rigorously follow the definitions in OECD Test Guideline 210. Most of the lowest NOECs were based on either growth (including fish length and/or weight) or survival, especially for ZEB.
Most of the ZEB data (11 of 15 data points, including one set of duplicates) were gathered in studies that included only survival, embryo hatchability, and growth endpoints3). Among
the 14 chemicals tested on ZEB, 12 were cate-gorized as either chlorobenzene or aniline de-rivatives3, 23). Both the endpoints and the
chem-ical space for the ZEB data were smaller than those for the FHM, MED, and RT data.
3.2 Examination of group I models: four
fresh-water fish species
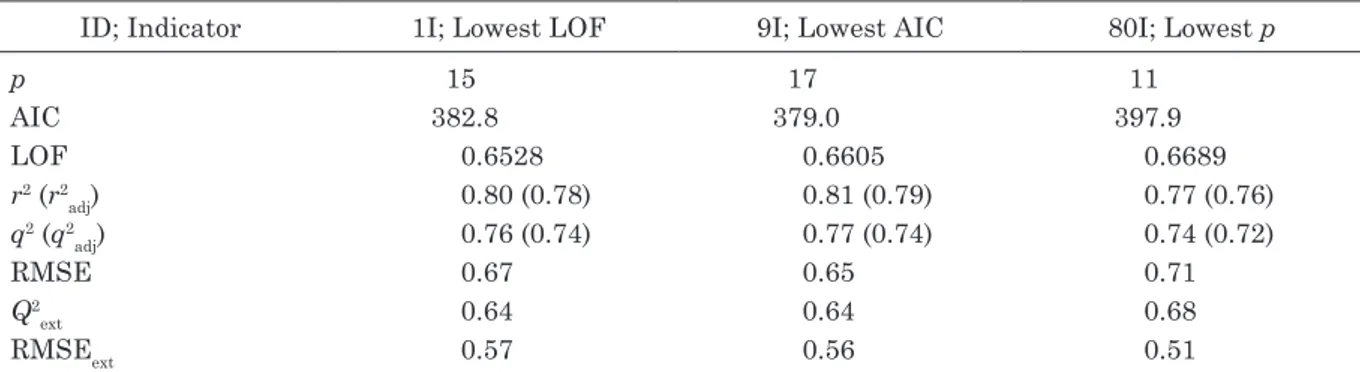
From among the QSAAR models based on the 172 four freshwater fish data, we examined three models in detail (referred to as group I models, see Table 2): the model with the lowest LOF16) score, the model with the lowest AIC21),
and the model with the fewest descriptors (p) (see also Fig. 1). The QSAAR models developed in our previous studies are listed in Appendix 3, and the group I models developed in this Table 1. Numbers of chemicals categorized as pesticides.
Category FHM MEDa ZEB RT
Insecticide 32 1 2 22 Nematicide or acaricide 18 (15b) 0 1 (1b) 13 (10b) Herbicide 17 (1b) 0 0 9 Fungicide 20 (1c) 1 0 8 Pesticide total 70 2 2 42 Non-pesticide 30 3 12 9 Total 100 5 14 53
a Chemicals in the external validation dataset were excluded. b Number also categorized as insecticides. c Number also categorized as a nematicide or an acaricide.
study are listed in Appendix 4. The latter mod-els had relatively high goodness-of-fit values (r2=0.77–0.81) and robustness values (q2=0.74–
0.77). However, because all three models had at least 11 descriptors, the coefficients of deter-mination adjusted for the number of degrees of freedom were relatively low; r2
adj and q2adj
were <0.80 and <0.75, respectively. The model with the lowest LOF (1I-LOF), the one with the smallest AIC (9I-AIC), and the one with the fewest descriptors (80I-Lowp) had 15, 17, and 11 descriptors, respectively. Of these three models, 9I-AIC had the most descriptors and showed the best goodness-of-fit and robustness (high r2 and q2 and low RMSE). In contrast,
model 80I-Lowp had the fewest descriptors (11) and showed the best predictivity (i.e., Q2
ext
and RMSEext were much higher and lower, re-spectively, than the corresponding values for the models in the previous studies; see Appen-dix 3). These results suggest that these models with >11 descriptors contained some redun-dant descriptors.
The energy of the lowest unoccupied mo-lecular orbital (LUMO) was selected as one of the descriptors in each of the three models (Appendix 4). LUMO energy is an indicator of the electrophilicity (reactivity) of a chemical24)
and is used as a descriptor in the models for predicting Daphnia magna 48-h EC50 and fat-head minnow 96-h LC50 in TIssue MEtabolism Simulator (TIMES)25, 26). Except for the LUMO
energy, all the descriptors in the models listed in Appendix 4 were two-dimensional molecular descriptors. Water solubility (log S) is a physi-cochemical property related to membrane per-meability and is well correlated with octanol– water partition or distribution coefficient (i.e., log P or log D), neither of which was selected as a descriptor in the models; log P and log D are well-known descriptors used to account for aquatic toxicity27). Whether or not a chemical
was tested on a cold freshwater fish was used a descriptor, designated i_RT (=1 if the chemical was tested on RT; =0 if the chemical was test-ed on FHM, MED, or ZEB). The group I models included descriptors indicating biological activ-ity, membrane permeabilactiv-ity, and reactivity.
3.3 Examination of group II models: three warm
freshwater fish species
Table 3 shows statistics for three linear multiple regression QSAAR models (Appen-dix 5) developed using the above-mentioned 119 data points for three warm freshwater fish. The numbers of descriptors in these mod-els, which are designated as group II, were dramatically lower than the numbers in the group I models. The model with the lowest LOF16) (1II-LOF), the one with the smallest
AIC21) (14II-AIC), and the one with the fewest
descriptors (49II-Lowp) consisted of 10, 12, and 7 descriptors, respectively. The goodness-of-fit and robustness values for the group II models Table 2. Statistical values for group I models.a
ID; Indicator 1I; Lowest LOF 9I; Lowest AIC 80I; Lowest p
p 15 17 11 AIC 382.8 379.0 397.9 LOF 0.6528 0.6605 0.6689 r2 (r2 adj) 0.80 (0.78) 0.81 (0.79) 0.77 (0.76) q2 (q2 adj) 0.76 (0.74) 0.77 (0.74) 0.74 (0.72) RMSE 0.67 0.65 0.71 Q2 ext 0.64 0.64 0.68 RMSEext 0.57 0.56 0.51
aDefinitions: p, number of descriptors; RMSE, root mean square error; RMSE
ext, RMSE for external
were higher than the values for the group I models: r2 (r2
adj)=0.78–0.81 (0.77–0.81) and q2
(q2
adj)=0.76–0.78 (0.74–0.76). The predictivity of
the group II models was much better than that of the group I models; compare Q2
ext=0.64–0.68
and RMSEext=0.51–0.57 for the group I models (Table 2) with Q2
ext=0.71–0.73 and RMSEext=
0.44–0.46 for the group II models (Table 3). The predictivity of the group II models was mark-edly better than that for our previously re-ported models, which had Q2
ext values of <0.20
and RMSEext values of ~0.90 (Appendix 3). Of the three group II models, model 14II-AIC (the model with the lowest AIC) had the most descriptors (12), and its goodness-of-fit, robust-ness, and predictivity better than those of the other two models in the group. The high pre-dictivity of model 14II-AIC suggests that the 12 descriptors in the model were not redundant but complementary.
No three-dimensional descriptors were se-lected in the group II models (Appendix 5). As was the case for the group I models (Ap-pendix 4), the group II models contained acute Daphnia magna toxicity and solubility as descriptors. In addition, all three models contained i_Zebra as a descriptor (=1 if a chemical was tested on ZEB; =0 if a chemical was tested on FHM or MED) instead of i_RT. i_Zebra would be appeared due to the fewer endpoints and smaller chemical space for the ZEB data than FHM and MED as discussed in
section 3.1. The coefficients for i_Zebra (−0.92 to −0.70) suggest that the ELS toxicity of a chemical toward ZEB was lower than the ELS toxicity of the chemical toward FHM or MED. The descriptor i_Pest (=1 if a chemical is cat-egorized as a pesticide listed in Appendixes 1 and 2; =0 if a chemical is not categorized as any of the pesticides listed in the two ap-pendices) was present in the model with the lowest LOF and the model with the lowest AIC (1II-LOF and 14II-AIC, with coefficients of −0.47 and −0.51, respectively). Similarly, a descriptor indicating the absence or presence of an aromatic amine (i_cNv3) was also selected in the model with the lowest LOF and the one with the lowest AIC (1II-LOF and 14II-AIC, with coefficients of +0.46 and +0.45). There-fore, these two models predict that a pesticide with no aromatic amine substructures should have a toxicity that is one log (1/NOEC [mM]) unit lower than the toxicities of nonpesticides with aromatic amine substructures. Other ef-fective descriptors in the group II models were structural descriptors such as the numbers of halogen atoms, five-membered rings, and sul-fur atoms.
Because the test conditions (e.g., tempera-ture and duration) for the RT ELS toxicity tests differ from the conditions for the tests for the three warm freshwater species, the group II model with the lowest AIC (14II-AIC) had better statistical values than the group I mod-Table 3. Statistical values for group II models.a
ID; Indicator 1II; Lowest LOF 14II; Lowest AIC 49II; Lowest p
p 10 12 7 AIC 266.1 261.6 276.6 LOF 0.6469 0.6541 0.6608 r2 (r2 adj) 0.81 (0.79) 0.82 (0.81) 0.78 (0.77) q2 (q2 adj) 0.77 (0.75) 0.78 (0.76) 0.76 (0.74) RMSE 0.67 0.65 0.72 Q2 ext 0.72 0.73 0.71 RMSEext 0.45 0.44 0.46
a Definitions: p, number of descriptors; RMSE, root mean square error; RMSE
ext, RMSE for external
els and the models we developed in our previ-ous studies6, 7). In the 2019 study7), we pointed
out that for some chemicals, the ELS toxicity data obtained by the Japanese Ministry of Environment and the data collected from the QSAR Toolbox ver. 3.4 had differences in target endpoints and test protocols. These differences caused a discrepancy of more than one log unit for the ELS toxicity data and caused uncertain-ty in the QSAAR predictions. Nevertheless, if fish ELS toxicity data were improved, the selected descriptors changed, and the model predictivity improved. In this research note, our intention is not to provide the best single QSAAR model but rather to examine strategies for developing QSAARs models for predicting MED ELS toxicity (e.g., strategies for consid-ering descriptor candidates and the range of source data). Considering with the model appli-cability as discussed in our previous studies6, 7),
the models developed by the strategy described herein may be useful alternatives to acute-to-chronic ratios and uncertainty factors used for screening evaluation required by the Japanese CSCL1).
4. CONCLUSIONS
In this study, we examined two groups of linear multiple regression QSAAR models for predicting MED ELS toxicities of chemicals for the purposes of hazard and environmental risk assessments. We re-collected toxicity data using QSAR Toolbox ver. 4.3 instead of ver. 3.4, which we had used in previous studies. The developed models suggested that acute
Daphnia magna toxicity was an important
descriptor, along with structural and physi-cochemical descriptors. The group II models, which were developed with training data for three warm freshwater species (FHM, MED, and ZEB), especially the model with the lowest AIC, showed higher predictivity than the group I models, which were developed with training data for four freshwater species (FHM, MED,
ZEB, and RT). The predictivity of the group II models was also much higher than that of our previously reported models. The model devel-opment strategy presented herein (e.g., the strategy used to develop the group II models) may become a useful tool for screening assess-ment under the Japanese CSCL and possibly in the future implementation of chronic risk assessment into Agricultural Chemicals Regu-lation Act.
Acknowledgment
This work was supported in part by the Japan Society for the Promotion of Science (JSPS KAKENHI grant no. JP17K00640).
Supplemental
The predicted explanation of statistical values and predicted NOEC mg/L values for the exter-nal validation dataset along with correlation plot between measured and estimated ELS were available at appendixes. All the prepared de-scriptors and the SMILES strings are listed in a supplementary Excel file, which can be obtained from the authors (AF, ayako_furuhama@nihs. go.jp; or HY, yamamoto.hiroshi@nies.go.jp).
References
1) Act on the evaluation of chemical substanc-es and regulation of their manufacture, etc. (CSCL), Chemical Management, Ministry of Economy, Trade and Industry. http://www. meti.go.jp/policy/chemical_management/ english/cscl/ (accessed December 27, 2020). 2) Ministry of the Environment Government of
Japan Outline of chemical substances con-trol law (CSCL). https://www.env.go.jp/en/ chemi/outline_CSCL.pdf (accessed Decem-ber 27, 2020).
3) van Leeuwen, C. J., Adema, D. M. M., Her-mens, J. (1990) Quantitative structure– activity relationships for fish early life stage toxicity. Aquatic Toxicology
4) Hodson, P.V., Parisella, R., Blunt, B., Gray, B., Kaiser, K. (1991) Quantitative
structure–activity relationships for chronic toxicity of phenol, p-chlorophenol, 2, 4- dichlorophenol, pentachlorophenol, p-nitro-phenol and 1, 2, 4-trichlorobenzene to early life stages of rainbow trout (Oncorhynchus mykiss).
5) Enoch, S. J., Cronin, M. T. D., Schultz, T. W., Madden, J. C. (2008) An evaluation of global QSAR models for the prediction of the toxicity of phenols to Tetrahymena
pyriformis. Chemosphere, 71(7), 1225–
1232.
6) Furuhama, A., Hayashi, T. I., Yamamoto, H. (2018) Development of models to pre-dict fish early-life stage toxicity from acute
Daphnia magna toxicity. SAR and QSAR in Environmental Research, 29(9), 725–742.
7) Furuhama, A., Hayashi, T., Yamamoto, H. (2019) Development of QSAAR and QAAR models for predicting fish early-life stage toxicity with a focus on industrial chem-icals. SAR and QSAR in Environmental
Research, 30(11), 825–846.
8) Pesticide Ecotoxicity Database of the Unit-ed States Environmental Protection Agency Office of Pesticide Programs (USEPA OPPs) https://ecotox.ipmcenters.org/ (accessed De-cember 28, 2020).
9) The QSAR toolbox version 4.3. https://qsar toolbox.org/ (accessed December 28, 2020). 10) Weininger, D. (1988) SMILES, A
chemi-cal language and information-system. 1. Introduction to methodology and encoding rules. Journal of Chemical Information
and Computer Sciences, 28(1), 31–36.
11) OECD (2013) OECD Guidelines for Testing
of Chemicals. Test no. 210: Fish, Early-life Stage Toxicity Test.
12) Kano, K. (2014) QSAR in View of Energy Relationship. Japanese Journal of
Pesti-cide Science, 39(2), 145–151.
13) Hansch, C., Hoekman, D., Leo, A.,
Weininger, D., Selassie, C. D. (2002) Chem-bioinformatics: Comparative QSAR at the interface between chemistry and bi-ology. Chemical Reviews, 102(3), 783–812. 14) Results of eco-toxicity tests data conducted
by Ministry of the Environment in Japan (March 2018). http://www.env.go.jp/chemi/ sesaku/mat2_3003e.pdf (accessed Decem-ber 28, 2020).
15) Council, B. C. P. (2015) The Pesticide
Man-ual 17th edition: A World Compendium.
British Crop Protection Council.
16) Rogers, D., Hopfinger, A. J. (1994) Appli-cation of genetic function approximation to quantitative structure–activity relation-ships and quantitative structure-property relationships. Journal of Chemical
In-formation and Computer Sciences, 34(4),
854–866.
17) Molecular Operating Environment (MOE),
2019.01. Chemical Computing Group ULC.
18) QuaSAR-Evolution, Scientific Vector
Lan-guage (SVL) source code provided by Chemical Computing Group ULC (2015,
COPYRIGHT ©2001–2015 MOLSIS INC.). 19) Schefzick, S., Bradley, M. (2004)
Com-parison of commercially available genetic algorithms: GAs as variable selection tool.
Journal of Computer-Aided Molecular De-sign, 18(7), 511–521.
20) Furuhama, A., Hayashi, T. I., Tatara zako, N. (2016) Acute to chronic estimation of Daphnia magna toxicity within the QSAAR framework. SAR and QSAR in
En-vironmental Research, 27(10), 833–850.
21) Akaike, H. (1974) New look at the statistical-model identification. IEEE
Trans-actions on Automatic Control, Ac19(6), 716–
723.
22) Furuhama, A., Hayashi, T. I., Yamamoto, H., Tatarazako, N. (2017) External vali-dation of acute-to-chronic models for esti-mation of reproductive toxicity to Daphnia
Research, 28(9), 765–781.
23) Nagel, R., Bresch, H., Caspers, N., Han-sen, P. D., Markert, M., Munk, R., Scholz, N., ter Höfte, B. B. (1991) Effect of 3,4- dichloroaniline on the early life stages of the zebrafish (Brachydanio rerio): Results of a comparative laboratory study.
Ecotox-icology and Environmental Safety, 21(2),
157–164.
24) Schwöbel, J. A. H., Koleva, Y. K., Enoch, S. J., Bajot, F., Hewitt, M., Madden, J. C., Roberts, D. W., Schultz, T. W., Cronin, M. T. D. (2011) Measurement and estimation of electrophilic reactivity for predictive tox-icology. Chemical Reviews, 111(4), 2562–
2596.
25) Dimitrov, S. D., Mekenyan, O. G., Sinks, G. D., Schultz, T. W. (2003) Global model-ing of narcotic chemicals: ciliate and fish toxicity. Journal of Molecular Structure
THEOCHEM, 622(1–2), 63–70.
26) Mekenyan, O. G., Dimitrov, S. D., Pavlov, T. S., Veith, G. D. (2004) A systematic approach to simulating metabolism in computational toxicology. I. The TIMES heuristic modelling framework. Current
Pharmaceutical Design, 10(11), 1273–1293.
27) OECD (2014) OECD Series on Testing and
Assessment No. 194, Guidance on grouping of chemicals, 2nd edition. OECD.