Short Communication
Capillary Electrophoretic Characterization of Carbon Nanodots Prepared from
Glutamic Acid in an Electric Furnace
Toshio TAKAYANAGI
*1, Sota IWASAKI
2, Kotaro MORITA
3, Naoki HIRAYAMA
3, Hitoshi
MIZUGUCHI
11Graduate School of Technology, Industrial and Social Sciences, Tokushima University, 2-1 Minamijyousanjima-cho,
Tokushima 770-8506, Japan
2Graduate School of Advanced Technology and Science, Tokushima University, 2-1 Minamijyousanjima-cho, Tokushima
770-8506, Japan
3Department of Chemistry, Faculty of Science, Toho University, 2-2-1 Miyama, Funabashi 274-8510, Japan
Abstract
Carbon nanodots (CNDs) prepared from glutamic acid or glutathione in an electric furnace were characterized by capillary electrophoresis. Two major peaks were detected in the electropherograms by capillary zone electrophoresis, corresponding to anionic and less-charged CNDs. The effective electrophoretic mobility of the anionic CND formed from glutamic acid was almost identical over neutral to weakly alkaline pH range, and the CND would not contain significant amount of amino group. On the other hand, the effective electrophoretic mobility tended to decrease with decreasing pH at weakly acidic pH conditions, suggesting the functional groups of carboxylate moiety on the anionic CNDs. Dodecyl sulfate ion was added in the separation buffer to give anionic charge to the less-charged CND by adsorption. However, the anionic charge induced was little, and the dodecyl sulfate ion was not likely adsorbed on the less-charged CND and the CND would be hydrophilic.
Keywords: Carbon nanodot; Glutamic acid; Glutathione; Electric furnace; Capillary electrophoresis
1. Introduction
Carbon nanodot (CND) is one of carbon clusters, and it is attracting the most attentions in analytical and biomedical research with its less toxicity [1-3]. Capillary electrophoresis (CE) or capillary zone electrophoresis (CZE) is a useful technique to characterize and to utilize the CNDs [4-9]. By using the CE characterization, cationic, less-charged and anionic CNDs were found in the CND prepared from citric acid and 1,2-ethylenediamine [5]. Nanodiamond prepared by detonation was characterized by CE, and a broad peak was detected with tris buffer, while borate buffer accelerated the condensation of the nanodiamond [6]. CND and CND-antibody bioconjugates were separated by CE [8]. The present authors have also
utilized CE for the characterization of the CNDs prepared from glutamic acid and boric acid by microwave irradiation, as well as from glutamic acid [10]. The CE characterizations revealed that anionic and less-charged CNDs were included and that both the CNDs were highly hydrophilic [10].
In this study, four types of CNDs were prepared from glutamic acid, glycine, cysteine, or glutathione in an electric furnace, since the introduction of hetero atoms could develop the quantum yield of CNDs [11]. It was confirmed through the CE characterization that the CNDs formed from glutamic acid or glutathione were successfully prepared. Two major peaks were detected with the CNDs in the electropherograms, and the two major components of the
*Corresponding author: Toshio TAKAYANAGI
Tel: +81-88-656-7409; Fax: +81-88-656-7409 E-mail: [email protected]
CNDs were further characterized by CE. Both anionic and less-charged CNDs prepared from glutamic acid were found to be highly hydrophilic, similar to the preparation by microwave irradiation [10].
2. Experimental
2.1. Reagents
Four types of CNDs were synthesized in an electric furnace from glutamic acid, glycine, cysteine, or glutathione, according to the previous study [11]. Typically, an aliquot of 1.0 g of glutamic acid was dissolved in 10 mL water, and the solution was transferred to a PFA digestion vessel (Savillex, 60 mL). The airtight vessel was heated in an electric furnace at 250 oC for 2 h. After heating, the
crude product was cooled to room temperature and then dispersed in water. Suction filtration and centrifugal filtration (4,000 ×g for 20 min, MW cut-off: <10 kDa) were applied to the suspended solution, and the CND stock solution was prepared as brown-colored transparent solution. The CNDs thus prepared are abbreviated as E-CND (glutamic acid), G-CND (glycine), C-CND (cysteine), and GSH-CND (glutathione). Separation buffers were prepared with formate buffer, acetate buffer, phosphate buffer, Good’s buffers (MES-NaOH, HEPES-NaOH, CHES-NaOH, CAPS-NaOH), borate buffer, or NaOH. Unless otherwise stated, all other reagents were of guaranteed reagent grade and used without further purification. Water used was purified by Milli-Q Gradient A10 (Merck Millipore Japan, Tokyo, Japan).
2.2. Apparatus
An Agilent Technologies (Waldbronn, Germany) 3DCE
was used as a CE system, equipped with a photodiode array detector. A fused-silica capillary purchased from GL Sciences (Tokyo, Japan) was cut to a required length, and it was used as a separation capillary, after a detection window was made by burning a small portion of the polyimide coating. The capillary was held in a cassette cartridge, and the cartridge was installed in the CE system. The dimensions of the capillary were 64.5 cm in the total length, 56 cm in the effective length from the injection end to the detection point, 75 m inner diameter, and 375 m outer diameter. An HM-25G pH meter (TOA DKK, Tokyo, Japan) was used for the pH measurements of the separation buffers, after being calibrated daily with standard pH solutions.
2.3. Procedure
The stock solutions of four types of CNDs were diluted with water and used for the CE measurements. After the separation capillary equilibrated with a separation buffer, a sample solution containing the CND was introduced into the capillary hydrodynamically by applying a pressure at 50 mbar to the inlet vial for 5 s placed at the anodic end. Both
ends of the capillary were dipped in anodic and cathodic buffer vials, a DC voltage of 25 kV was then applied to the capillary for the electrophoresis. The CNDs were photometrically detected at 200 nm. The capillary was thermostat at 25 oC throughout the measurements.
Electroosmotic flow (EOF) was monitored with the less-charged CND. An Agilent Technologies ChemStation software (Ver. B.04.02) was used for recording and analyzing the electropherograms.
3. Results and discussion
3.1. Quantification of the CNDs by CZE
The CND solutions as prepared were diluted and measured by CZE to characterize the amount of the CNDs and the distribution of the charges on it. The results are shown in Fig. 1. Two major peaks can distinctly be detected with GSH-CND and E-CND, while any clear peak was not detected with C-CND or G-CND. The intensity of the detected peaks corresponds to the yield of the CNDs [11]. The color of the CND solution was also thick with GSH-CND and E-CND, and therefore, the two major peaks detected in the electropherograms Figs. 1 (a) and (d) correspond to the CNDs. A peak indicated with the open circle corresponds to the anionic CND, and another peak indicated with the filled triangle to the less-charged CND detected at the migration time of the EOF. Compared with the CNDs prepared by a microwave oven [10], the anionic peaks detected in this study are also sharp, suggesting that the charge/mass ratio of the anionic CNDs is not so much dispersed. On the other hand, the CNDs prepared by an electric furnace contain less amounts of anionic CNDs
Fig. 1. Electropherograms of the CNDs prepared in an electric
furnace. CND: (a), GSH-CND; (b), C-CND; (c), G-CND; (d), E-CND. Separation buffer: 10 mmol/L borax (pH 9.35). The CNDs were diluted by 50 folds from the stock solutions. CE conditions are written in the text.
through a simple comparison of the peak area between anionic and less-charged CNDs. The ratio of the peak area between anionic and less-charged CNDs from glutamic acid are 2.2 and 0.25 for the preparations by a microwave oven [10] and by an electric furnace, respectively. Some minor peaks are also found in Fig. 1., and they are attributed to anionic CNDs with different charge/mass ratio.
The electrophoretic mobility of the anionic component of GSH-CND and E-CND was about −3.1×10⁻⁴ cm2 V−1 s−1
with weakly alkaline separation buffers, and the anionic CNDs prepared from different substances would be resemble.
3.2. Characterization of anionic CNDs by CZE
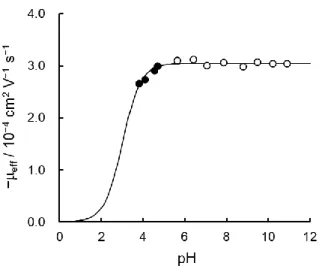
Effective electrophoretic mobility (eff) of the anionic
E-CND was measured at the pH range between 5.6 and 10.9. The eff value was calculated by subtracting the
electrophoretic mobility of the EOF from the apparent electrophoretic mobility of the anionic CND with its migration time. The results are shown in Fig. 2 with the open circles. The anionic E-CND showed almost identical
eff value at the pH range. The constant eff value suggests
that a significant amount of amino group is not contained in the anionic E-CND, because protonation to the amino group would induce the changes in its net charge, as well as in the effective electrophoretic mobility.
The effective electrophoretic mobility of the anionic E-CND was also investigated at weakly acidic pH conditions between 3.8 and 4.7. The velocity of the EOF was not fast enough to detect the anionic E-CND, and therefore, pressure-assisted CZE [12,13] was used. The results are also shown in Fig. 2 with the filled circles. While the peak width of the anionic E-CND was broadened by the laminar flow with the applied pressure, the effective electrophoretic mobility was continuous to the ordinary CZE results. It can be noticed from Fig. 2 that the eff value
tends to decrease at the lower pH conditions. The anionic E-CND is partly protonated, and its anionic charge has decreased. Although the anionic CNDs are polyprotic and the functional groups on them are diverse, the changes in eff was treated as monoprotic acid with its charge from 0 to
−1 as a first approximation. The monoprotic acid dissociation constant, Ka, can be determined through the
measured eff values using Eq. (1).
ep × 10−pKa
eff = (1)
10−pH + 10−pKa
where ep is the electrophoretic mobility of the imaginary
monoanionic CND. A software of R program (Ver. 3.6.1) [14] was used for the analysis, and an imaginary pKa value
of 3.0±0.1 (uncertainty: standard error) was determined. Changes in the eff value, as well as the imaginary pKa
Fig. 2. Effective electrophoretic mobility of the anionic E-CND
with changing pH of the separation buffer. Sample solution: 50-fold diluted E-CND. Separation buffer: 20 mmol/L Good’s buffer or acetate buffer. CE conditions are written in the text. ○: CZE measurements, ●: Pressure-assisted CZE measurements under 20-25 kV constant applied voltage with 50 mbar assist pressure.
value, suggested that the anionic moiety on the CNDs are carboxylate.
To investigate the diversity of the anionic E-CND, its ion-association equilibrium was examined with tetrabutylammonium ion (TBA+) as a hydrophobic pairing
ion [15]. When a certain part of the anionic E-CND is hydrophobic at different degrees, they would associate with TBA+ and its effective charge would be reduced at different
degrees, resulting in peak broadening and/or peak fronting under the consecutive ion-associability with TBA+ [10].
The theoretical plate number (N) was examined as an index of the peak broadening by the hydrophobic ion-association
Fig. 3. Changes in the theoretical plate number (N) of the
anionic CNDs prepared from glutamic acid with increasing concentrations of TBA+. ○: CND prepared by an electric furnace;
▲: CND prepared by a microwave oven (taken from Ref. 10). Separation buffer: 10 mmol/L borax + TBA+Cl−. CE conditions
equilibrium. The results are shown in Fig. 3. Compared with the CNDs prepared by microwave oven [10], the peak broadening was not observed by the addition of TBA+ in the
separation buffer. The results suggest that the CNDs prepared by an electric furnace are not associable with TBA+ and that the CNDs are more hydrophilic than the
CNDs prepared by a microwave oven. The effective electrophoretic mobility of the anionic CND slightly changed with the TBA+ concentrations in the range of
3.0-3.2×10⁻⁴ cm2 V−1 s−1.
3.3. Detection of cationic CNDs by CZE
In addition to the anionic and less charged CNDs, cationic CNDs were also detected at acidic pH conditions. The results are shown in Fig. 4; the pressure-assisted CZE was used at acidic pH conditions. The peaks detected for the cationic CNDs are small and broad, the peaks detected were reproducible, and they would be attributed to cationic CNDs. Cationic CNDs were also detected with the CND prepared from citric acid and 1,2-ethylenediamine [5]. The cationic CNDs detected in this study would be the protonated CNDs from the less-charged CNDs.
Fig. 4. Pressure-assisted electropherograms of the E-CND at
acidic pH conditions. Cationic CND is indicated with a filled arrow, while less-charged CND with filled triangle. Separation buffer: 20 mmol/L HCOOH + NaOH with its ionic strength adjusted at 0.020 mol/L with NaCl. pH of the separation buffer: (a), 2.77; (b), 3.16; (c), 3.54. The E-CND solution was diluted by 50 times from the stock solution and measured. CE conditions: constant applied voltage at (a) 22, (b) 23, or (c) 24 kV with 50 mbar assist pressure, detection wavelength at 200 nm, capillary temperature at 25 oC, sample injection at 50 mbar for 5 s. 3.4. Characterization of less-charged CNDs by surfactant assisted CZE
Less-charged CNDs were also detected with E-CND and GSH-CND, and they were characterized by surfactant assisted CZE with an anionic surfactant of sodium dodecyl sulfate. The CNDs are relatively large against the surfactant molecules, and the surfactant would adsorb on the CNDs
and apparently anionic charge would be introduced to the CNDs. The results are shown in Fig. 5. It can be noticed in the electropherograms that the less-charged CNDs detected by CZE has split into some peaks indicated with the filled triangle. The resolution of the CNDs by the surfactant assisted CZE suggests that the adsorption property of dodecyl sulfate ion (DS−) to CNDs would be categorized into some groups. The similar results have been observed with the CNDs prepared by microwave oven [10]. The peak resolution from the EOF position is little and the DS− would be less adsorptive, i.e., the less-charged CNDs are also highly hydrophilic.
Fig. 5. Electropherograms of (a) GSH-CND and (b) E-CND by
surfactant assisted CZE. Major anionic CND is indicated with an open circle, while less-charged CNDs with a filled triangle. Sample solutions: 50-fold diluted GSH-CND or E-CND. Separation buffer: 5 mM NaH2PO4 + 5 mM Na2HPO4 + 50 mM
SDS (pH 7.05). CE conditions are written in the text.
4. Conclusions
In this study, usefulness of the CE analyses has been demonstrated for the characterization of the CNDs prepared by an electric furnace. The CNDs were successfully prepared from glutamic acid and glutathione among the four starting substances. Two major components of an anionic and a less-charged CNDs were detected as corresponding peaks in the electropherograms, as well as in the case of the CNDs prepared by a microwave oven. Measurements of the effective electrophoretic mobility with varying pH suggested the carboxylate moiety on the major anionic CND, and the CND is highly hydrophilic through the theoretical plate number by ion-association equilibrium with TBA+. Adsorption of anionic surfactant of DS− was
little to the less-charged CNDs, and the less-charged CNDs are also hydrophilic. Both difference and resemblance are investigated with the CNDs from glutamic acid between two preparation methods of microwave oven and electric furnace.
Acknowledgements
This study was fanatically supported by JSPS KAKENHI [grant number 17K05903 and 18K05184].
References
[1] Xu, X.; Ray, R.; Gu, Y.; Ploehn, H. J.; Gearheart, L.; Raker, K.; Scrivens, W. A. J. Am. Chem. Soc. 2004,
126, 12736-12737.
[2] Baker, S. N.; Baker, G. A. Angew. Chem. Int. Ed. 2010,
49, 6726-6744.
[3] Hu, Q.; Gong, X.; Liu, L.; Choi, M. M. F. J.
Nanomater. 2017, 1804178, 23 pages.
[4] Markova, Z.; Bourlinos, A. B.; Safarova, K.; Polakova, K.; Tucek, J.; Medrik, I.; Siskova, K.; Petr, J.; Krysmann, M.; Giannelis E. P.; Zboril, R. J. Mater.
Chem. 2012, 22, 16219-16223.
[5] Hu, Q.; Paau, M. C.; Zhang, Y.; Chan, W.; Gong, X.; Zhang, L.; Choi, M. M. F. J. Chromatogr. A 2013,
1304, 234-240.
[6] Duffy, E.; Mitev, D. P.; Nesterenko, P. N.; Kazarian, A. A.; Paull, B. Electrophoresis 2014, 35, 1864-1872. [7] Wu, Y.; Wei, P.; Pengpumkiat, S.; Schumacher, E. A.;
Remcho, V. T. Anal. Chem. 2015, 87, 8510-8516. [8] Wu, Y.; Remcho, V. T. Talanta 2016, 161, 854-859. [9] Sirkisoon, L. R.; Makamba, H. C.; Saito, S.; Colyer, C.
L. Molecules 2019, 24, 1916, 14 pages.
[10] Takayanagi, T.; Iwasaki, S.; Becchaku, Y.; Yabe, S.; Morita, K.; Mizuguchi, H.; Hirayama, N. Anal. Sci.
2020, in press.
[11] Morita, K.; Kurusu, S.; Kodama, H.; Hirayama, N.
Anal. Sci. 2017, 33, 1461-1464.
[12] Wang, J.-L.; Xu, X.-J.; Chen, D.-Y. J. Pharm. Biomed.
Anal. 2014, 88, 22-26.
[13] Konášová, R.; Dytrtová, J. J.; Kašička, V. J.
Chromatogr. A 2015, 1408, 243-249.
[14] The R Project for Statistical Computing, https://www.r-project.org/.
[15] Takayanagi, T.; Wada, E.; Motomizu, S. Analyst 1997,