Paper Educ. Technol. Res., 43(1), 3-21, 2020
3 1. INTRODUCTION
Is it possible to be confident that students undertake peer assessment seriously? Even if they attempt to do so, do you think they are capable of evaluating their peers properly?
With the growing popularity of active learning in recent years, the practice of making presentations in class and evaluating these through peer assessments has increased. A peer assessment is defined as “an arrangement in which individuals consider the amount, level, value, worth, quality, or success of the products or outcomes of learning of peers of similar status.” (Topping 1998, p. 250)
Fukazawa (2010) categorized the literature on
the general benefits of peer assessment in learning situations into those that enhance learner motivation (Orsmond, Merry, and Reiling 1996) and those that reduce the teachers’ burden (Brown 1998).
Although peer assessments are useful, they can also be flawed in terms of reliability and validity when conducted by students. Consequently, several studies have addressed these concerns. In many of these previous studies, the reliability of peer assessments was determined based on consistencies among the students’ evaluations, and the validity was judged by the consistency of the teacher’s evaluation with that of the students. For example, studies have determined that the reliability of evaluations is high if the students’
How Do Students Evaluate Each Other during Peer Assessments?
An Analysis Using “Evaluation Behavior” Log Data
Izumi H
ORIKOSHI*1and Yasuhisa T
AMURA*2 *1 Graduate School of Science and Technology, Sophia University, 7-1,Kioi-cho, Chiyoda-ku, Tokyo 102-8554 Japan
*2 Dept. Information and Communication Sciences, Sophia University, 7-1,
Kioi-cho, Chiyoda-ku, Tokyo 102-8554 Japan Received for publication, October 15, 2019
This paper focused on students' peer assessment and analyzed evaluation behavior using log data from the evaluation process. Peer assessments by students are problematic in terms of reliability and validity. Many previous studies have discussed the reliability and validity of peer assessments using the evaluation scores of peer assessments. In contrast, the evaluation process, that is, who, when, and which items were evaluated, and in what order, has not been studied. The purpose of this research is to answer this research question, “How do students evaluate each other during peer assessments?” To achieve this purpose, we break the research question into three sub-questions: (1) Is it worth focusing on evaluation behaviors? (2) How can we visualize evaluation behaviors? and (3) What are the characteristic evaluation behaviors? First, we investigated similar studies and considered their relationship with our proposal. Consequently, it became clear that in social science, there have been many studies that acquire process data for answering surveys and questionnaires. Therefore, also in peer assessment research, there is a possibility to gain a better understanding of how students participate in peer assessment by focusing on the process log. Second, we developed a web-based form as the peer assessment tool to detect students’ evaluation process data. Using this form, we conducted an experiment to acquire evaluation process data from a class in which assessments were made to visualize evaluation behavior. Finally, we extracted and discussed characteristic evaluation behaviors. Consequently, we identified characteristic evaluation behaviors such as “evaluated in a short time.” We expect these results will lead to a clarification of the causes of low reliability and validity in students' peer assessments that have been difficult to assess through conventional methods based only on the peer assessment score. Specifically, the causes are, for example, “the students were not evaluating seriously,” “they evaluated seriously but could not evaluate properly because of a lack of evaluation ability,” or “there was room for improvement in the form design or lesson conditions.”
evaluations are consistent with each other, and the validity of the evaluation is high if it meets external standards, such as those of teachers.
Previous studies have mostly discussed the reliability and validity of evaluation scores in peer assessments. However, the evaluation process, that is, who, when, and which items were evaluated and in what order, has not been studied in terms of technology and significance.
To address this gap, in this study, we propose using evaluation process data in peer assessments to analyze and visualize students’ evaluation behaviors.
The purpose of this research is to answer this research question, “How do students evaluate each other during peer assessments?” To achieve this purpose, we break the research question into three sub-questions: (1) Is it worth focusing on evaluation behaviors? (2) How can we visualize evaluation behaviors? and (3) What are the characteristic evaluation behaviors?
To answer these sub-questions, we set the following three objectives corresponding to each sub-question: (1) investigate similar studies, organize them, and compare them with our research; (2) establish a method for the acquisition of the evaluation process and visualization of evaluation behaviors; and (3) extract characteristic evaluation behaviors. Additionally, we focused on the peer assessments of presentations made at a university in Japan.
By achieving these goals and answering the research question, we expect to better understand how students participate in peer assessments. We also believe that evaluation behavior analyses visualize issues that could not be seen using the conventional method based only on assessment scores. Furthermore, we expect that we will be able to estimate the students’ motivation for their peer assessment scoring and improve the design of peer assessment forms and the conditions of peer assessments based on evaluation behaviors.
2. RELATED WORK AND OUR STUDY
To answer the first sub-question, “Is it worth focusing on evaluation behaviors?,” in Chapter 2, we begin by presenting a literature review and a comparative analysis of previous research with the objectives of our study. We end this chapter by neatly organizing these in an easy-to-understand tabular form.
2.1. Conventional Studies Discussing the Quality of Peer Assessments
As mentioned in Chapter 1, peer assessments made by students are weak in terms of reliability and validity, and this issue has been studied extensively (Fujihara, Ohnishi, and Kato 2007). According to Fukazawa (2010), several studies have discussed reliability and validity using the correlation coefficient between scores given in evaluations by teachers and peer assessments made by students.
These studies can be placed into two categories: those that conclude that peer assessments made by students are as reliable as teacher assessments and those that question the reliability and validity of peer assessments made by students. As an example of the former, Fukazawa cites three studies that demonstrated a high correlation between evaluations by teachers and assessments by students in which the correlation coefficients were as follows: r =.68 -.80 (Miller and Ng 1996), r =.83 (Hughes and Large 1993), and r =.89 (Stefani 1994). As examples of the latter, Fukazawa cites Stefani (1994) and Freeman (1995). Stefani reported that the average value of the scores was higher in peer assessments than in teacher evaluations, and the latter had higher standard deviations of the score. Freeman reported that the correlation between teacher evaluations and peer assessments was moderate.
We focused on the fact that any related research has discussed reliability and validity based on the score of peer assessments. In many previous studies, the reliability of peer assessments is determined by the consistency in the students’ evaluations, and the validity is determined using the consistency between student and teacher evaluations. However, it is difficult to conclude that evaluations are “similar” because the evaluation scores are similar. This is because there might be cases where students’ scores are similar, but their behaviors during the evaluation process are different.
2.2. “Paradata” Studies in Web Surveys
On the other hand, we found many preceding research studies focusing on behavior during the answering process in the Web Survey research field (Kreuter 2013; Tourangeau, Rips, and Rasinski 2000; Tourangeau, Conrad, and Couper 2013).
As computers and the Internet have spread to the field of education, research related to
educational technology has also increased. A similar phenomenon can be witnessed in social science and statistics, where the use of computer-assisted interviews and Web surveys has increased.
Computer-assisted interviews or Web surveys have advantages that are not present in traditional surveys. For example, data related to the process of responding to surveys are automatically generated. These log data are called “paradata,” and relate to response behaviors, and include information such as response time for a particular question or an interruption during answering the questionnaire. No formal definition exists for paradata, but specific examples include data on timing, keystrokes, mouse clicks, and interface types, including the web browser and screen resolution (Couper 1998; Olson and Parkhurst 2013). These have then been used to verify the quality of the survey responses.
In studies on paradata, the response time has frequently been the focus, as it is in our study. According to Couper and Kreuter (2013), “response time” is readily available in most computer-assisted interviewing systems. The literature has also demonstrated that “shorter response times” are associated with a “lack of motivation to answer accurately, caused by continuous survey” (Bassili 1996; Yan and Tourangeau 2008). In the research on response behavior in web surveys, those who answer quickly are termed “speeders,” and this behavior is an indicator of poor responses (Zhang and Conrad 2014). However, “longer response times” are also associated with “lower scores on knowledge items” (Heerwegh 2003).
The research field on answering surveys has already accumulated a lot of knowledge. Studies on the psychological aspects of response behavior have been compiled, for example, in the book “the psychology of survey response” (Tourangeau, Rips, and Rasinski 2000). Research in this field has already gone from the basic research stage to the stage of elucidating the relationship between certain characteristic response behaviors and low-quality response results. Additionally, using these findings, further studies that intend to improve the survey results and questionnaires using paradata have been conducted, and the results of those studies were compiled, for example, in the book “Improving survey with paradata” (Kreuter 2013).
2.3. Response Behaviors using “paradata” in Web Surveys and Evaluation Behavior in Peer Assessments
The studies on response behavior using paradata in surveys and those on evaluation behavior in peer assessments are technically similar, as both involve the use of forms supported by computers or web technologies. Additionally, in both types of studies, similar data are collected (for example, the respondent’s ID, timestamps, the order of the answers, and the time spent on answering, which is calculated from the timestamps). Furthermore, the behaviors (especially inappropriate behaviors) that are extracted from the data and their interpretations are also similar. For example, the hypothesis that a “shorter response time” is an indicator of responses submitted without serious thought is suggested in both studies.
Another similarity in both kinds of studies is related to the measures taken in the case of respondents (or reviewers) presenting inappropriate behaviors. In paradata studies, two kinds of measures can be taken.
One measure is to eliminate the answers of inappropriately behaving respondents (Maniaci and Rogge 2014) so that only high-quality answers remain. In the case of peer assessments, if the purpose is to grade students based on the evaluation results, the same measures can be necessary. For example, when summarizing evaluation results to calculate grades, the evaluation results of unreliable evaluators are excluded. Alternatively, some previous studies have indicated that some students consistently score higher, while others consistently score lower, leading researchers to propose a method that adjusts for this tendency (Ueno, Songmuang, Okamoto, and Nagaoka 2008; Fujihara, Ohnishi, and Kato 2006).
The second measure is to improve either the form design or the conditions under which the survey is conducted. Some studies on web surveys reveal that responses are affected by form design and the conditions in which the surveys are conducted (Tourangeau, Conrad, and Couper 2013). We consider this second measure to be more important in peer assessments that are part of classroom activities. This is because the purpose of peer assessments is not only the source of grading but also the educational aspect of the activity. Peer assessments can be designed to help students better understand the evaluation criteria and promote their presentation abilities. Therefore, in peer assessments, excluding answers
with inappropriate behaviors is not sufficient to achieve the purpose of peer assessment. Instead, it is necessary to provide students with instructions on how to evaluate properly. To realize this, teachers must clarify the lesson conditions that increase or decrease inappropriate evaluation behaviors and provide guidance or improvement of peer assessment designs for reducing inappropriate behaviors.
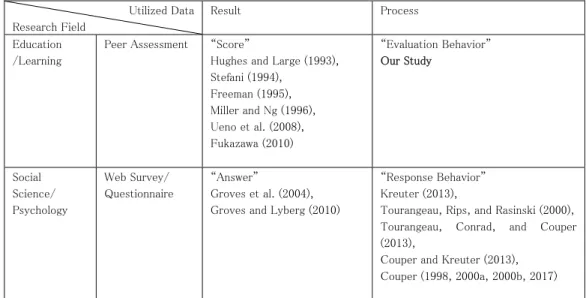
2.4. Research Focusing on the Quality of Answers In Table 1, the elements of our study are placed alongside those of previous studies. We placed the research field on the rows and the data utilized in each study on the columns. The research fields have been classified into Peer Assessment in
Education/Learning and Web
Survey/Questionnaire in Social Science/Psychology. The utilized data in each study have been classified into Result and Process.
The Result refers to the answer obtained. It is termed the Score in Peer Assessments and the Answer or value of the Response in Web Surveys/Questionnaires. The conventional studies that have discussed the quality of peer assessment, as discussed in Section 2.1, correspond to the Result in Peer Assessment because they mainly use the Score.
On the other hand, the studies on paradata in the web surveys, discussed in Section 2.2, correspond to Process in the Web Survey/Questionnaire as they mainly deal with
“Response Behavior.” Our study examines the Process in peer assessments or evaluation behaviors, as presented in the table.
Although the research fields are different, the analysis of “Evaluation Behavior” in peer assessments, which is the focus of this study, and that of response behavior or answering behavior in social research are quite similar in terms of data and behavior. For this reason, we expect that visualizing and analyzing evaluation behavior can also generate valuable findings related to peer assessment.
Note that several previous studies can be classified as the Result in Web Survey/Questionnaire (Groves et al. 2004; Groves and Lyberg 2010), although we have not included those in our literature review. Additionally, research on paradata at times deals with the Score from the viewpoint of response behavior. An example of this is a discussion on tendencies such as selecting only the high score or low score, selecting only the centrally placed button, and selecting only the same score.
3. MATERIALS AND METHODS
To answer the second sub-question, “How can we visualize their evaluation behavior?,” we developed a peer assessment tool to detect students’ evaluation process data. Using this form, we conducted an experiment to acquire evaluation process data of a class and visualized the evaluation behavior.
Table 1. Research Focusing on the Quality of Answers, Based on Form Utilized Data
Research Field
Result Process
Education /Learning
Peer Assessment “Score”
Hughes and Large (1993), Stefani (1994), Freeman (1995), Miller and Ng (1996), Ueno et al. (2008), Fukazawa (2010) “Evaluation Behavior” Our Study Social Science/ Psychology Web Survey/ Questionnaire “Answer” Groves et al. (2004), Groves and Lyberg (2010)
“Response Behavior” Kreuter (2013),
Tourangeau, Rips, and Rasinski (2000), Tourangeau, Conrad, and Couper (2013),
Couper and Kreuter (2013), Couper (1998, 2000a, 2000b, 2017)
3.1. Data Acquisition
To acquire evaluation-timing data during peer assessment, we developed a Web-based form using HTML, JavaScript, and PHP as the peer assessment tool (Fig. 1) to detect students’ evaluation process data. The reviewer selects the score for each item and clicks the radio buttons to evaluate the respondent. The reviewer can change their scores any time before they click the Submit button.
Evaluation process logs are sent to a server with a timestamp, not only when the reviewer clicks the submit button but also the radio buttons. The evaluation logs of the intermediate evaluation, which are sent on the click of the radio button, are called “onClick” data, and the logs of the final evaluation sent on clicking the submit button are called “submit” data. For this study, we used
“onClick” data. The items stored on the server were the reviewer’s student ID, presenter’s group ID, date and time, evaluation item ID, score, and “submit type” (“onClick” or “submit”). 3.2. Target Course, Unit, and Number of
Participants
The target course for this study was conducted at Sophia University, Japan. The name of the course was “Information Literacy (retrieve and search),” and the majority of students were in their third year. This course aimed to learn general information literacy skills such as “retrieve and search,” “compile,” and “output” through exercises and assignments to search online databases and information and also to learn operations of basic applications (e.g., word processor, spreadsheet, and presentation
programs).
The target unit was one of the presentation classes at the end of this course. The presentations’ theme was not specified, but the presentation should be an opinion speech and should also be supported by some data or references. In other words, the purpose of the presentation was to make use of all the techniques and skills, such as graph creation techniques, logical construction techniques, presentation material preparation techniques, and presentation techniques, which the students had learned in that course, rather than the content itself. For this reason, the evaluations for the presentations were mainly focused on formal aspects, which will be described in detail in Section 3.4.
A total of 71 students participated in the study. The students were divided into 12 groups, and six groups made presentations in one class each. In the first week, groups A to F made their presentations, and in the second week, groups G to H made theirs. Each group was given 15 minutes, which consisted of a ten-minute presentation and a four-minute question and answer (Q&A) session. Peer assessments were made using the peer assessment tools described in Section 3.1, and a log of the students’ evaluation behavior was acquired. The evaluation form for peer assessment (Peer Assessment Tool, Fig.1) was placed as a link on the Learning Management System, and the link was made visible just before the class started. The lesson’s length was about 90 minutes, and the students were instructed to submit an evaluation form during class, and the form was made invisible about an hour after the class finished.
The classes in the first and second weeks were in the same format, and the evaluation items of the peer assessment performed in the classes were also the same. Furthermore, in the first week, it was possible to obtain evaluation process data for six groups. For this reason, we determined that it was enough to analyze data only from a single week; therefore, this study utilized data from the first week.
However, although not covered in this paper, the hypothesis that “the evaluation behavior may change in the first week and the second week even if the same students evaluate in the same type of class” is under examination. We consider the hypothesis as a future research question because, as already mentioned in Section 2.2, there is a previous study of research on questionnaire response behavior that continuous
surveys affect respondents’ seriousness and motivation. Therefore, even in the peer assessment, learners’ motivation might be affected, and evaluation behavior might be changed by repeatedly evaluating the same evaluation item.
3.3. Ethical Considerations
This study was approved by the Committee on Research for Human Subjects at Sophia University, Japan. Prior to the experiment, the contents of the study were explained to the students, and data was collected only from those who chose to participate. We also let them know that not participating would not affect their grade.
3.4. Evaluation Items Used in this Peer Assessment As mentioned in Chapter 1, the research target of this study is the Peer Assessment of presentations at universities. The peer assessment form used in this study had 17 evaluation items in total. The evaluation items were divided into the following five categories: “Structure/content,” “Presentation technique,” “Slide preparation technique,” “Question and answer (Q&A),” and “Overall evaluation” (List 1). The five categories were roughly divided into three types: evaluation of the presentation (Category 1-3: Q1-15), evaluation of questions (Category 4: Q16), and evaluation of the overall presentation (Category 5: Q17).
Rather than expecting the reviewer to complete the assessment at once, we expected that specific sections would be completed at different times depending on the category. We expected the evaluation of questions (Category 4: Q16) and evaluation of the entire presentation (Category 5: Q17) to be completed after the presentation. The evaluation of the presentation (Category 1-3: Q1-15) was further divided into three areas: the items that we expected to be (1) judged when the reviewer observed certain slides, (2) evaluated when the reviewer observed a certain behavior of the presenter, and (3) whose timing of evaluation might be different depending on the presentation or the reviewer. We also expected some items to be judged when the reviewer observed a certain slide, such as whether the presenter offered facts and rationale (literature, articles, and statistics) in the presentation (e.g., Q5 and Q15). We expected items to be evaluated when the reviewer observed a certain behavior of the presenter, such as the completion of the introduction (e.g., Q2), smoothness of slide transitions or connecting
phrases (e.g., Q8 and 9), and using tips such as posing questions for the audience (e.g., Q10). Some items might have been evaluated at any point during the presentation, depending on the presentation and the reviewer, including items related to the appropriateness of the title of the presentation (e.g., Q1); the focus and configuration of the presentation (e.g., Q3 and Q4); the speaker’s articulation, vocal volume, body language, and eye contact (e.g., Q6 and Q7); the number and title of each slide; and the number of characters of text, font size, and color (e.g., Q11-13).
These evaluation items were not newly created for this research or experiment but have been used for several years in this unit of this course. In carrying out this research, we did not review or modify the evaluation items, just as we used the instructions of the presentation tasks used in this class. However, similar to the hypothesis discussed in Section 3.3 that “the evaluation behavior may change between the first and second weeks,” the hypothesis that “the evaluation behavior may change depending on the expression or the number of evaluation items or the design (e.g., the polar category scale type or rubric type)” is also under examination as a future research question.
Regarding this hypothesis, as mentioned in Section 2.2, previous studies on survey response behavior have demonstrated that the wording, number, or placement of the items in the questionnaire affect the answering behavior or the answer itself. For this reason, it can be considered that the evaluation behavior in peer assessment may change according to the items and the design of the evaluation form.
List 1. Evaluation Items Used in Peer Assessment Category 1: Structure/content
Q1: Was the title of the presentation appropriate? Q2: Did the presenter give an appropriate introduction before moving to the main topic, and was the introduction useful for the audience in understanding the presentation?
Q3: Was the main point of the presentation clear? Q4: Was the presentation well-structured and
organized?
Category 2: Presentation technique
Q5: Did the presenter present facts and rationale (literature, articles, statistics, etc.)?
Q6: Was the presenter’s speech fluent and
audible?
Q7: Did the presenter face the audience and make eye contact?
Q8: Did the presenter understand the structure of their presentation well? Were the slide transitions smooth?
Q9: Did the presenter insert appropriate connection phrases during slide transition? Did these help to clarify the relationship between the slides and the presentation structure? Q10: Did the presenter make use of tips, such as
posing questions for the audience? Category 3: Slide preparation technique Q11: Were the slides numbered?
Q12: Was the title of each slide appropriate? Q13 Were there too many characters on each
slide? Was the font size too small? Was the choice of font color appropriate?
Q14: Were diagrams, charts, and plots helpful for the audience?
Q15: Were the references or sources of literature, articles, statistics presented on a slide? Category 4: Question and answer (Q&A)
Q16: Did the presenter answer questions, and did the answers match the question?
Category 5: Overall evaluation
Q17: Please rate the entire presentation on a scale ranging from 1 to 5.
4. RESULTS AND DISCUSSION
To answer the third sub-question, “What kind of characteristic behaviors are there?” in this chapter, we discuss how we visualized evaluation behavior from the evaluation process data. We then extract and discuss characteristic evaluation behaviors. Finally, we visualize and discuss the transition of the evaluation of the six groups. 4.1. Acquired Data
T The experiment was conducted according to the procedure described in Chapter 3. On the day of the experiment, 97 students were present, 56 of whom had agreed to participate in the study. Some of the participants held their presentations as “presenters,” while the others conducted peer assessments of the presentations as “reviewers.” Of the peer reviews conducted for each group (presenter), the number of participating reviewers is presented in Table 2. The Group G presentations were not scheduled in that week;
they did not make their presentation and were incorrectly evaluated. A detailed discussion of this reviewer who accidentally evaluated Group G is contained in Section 4.5.
4.2. Visualization of Evaluation Behavior
To visualize the evaluation behaviors, we considered how to plot the acquired evaluation process data. Fig. 2 illustrates an example plot of the evaluation behavior. The horizontal axis of the plot is the elapsed time from the start of the presentation (maximum 20 minutes), and the vertical axis is the evaluation item number (Q1-17).
Of the shaded areas in the figure, the left side represents the presentation (approximately ten minutes), and the right side represents the Q&A session (approximately four minutes). The number starting from S in the upper-left corner of the figure is the anonymized student ID. As there were a total of 71 participants in the study, each student was assigned a number from S001 to S071. The anonymized student ID of each student is the same in groups A to F.
The plot in Fig. 2 illustrates when and in what order each learner evaluated each evaluation item.
Therefore, we believe that the plots in this format can express or visualize the following evaluation behaviors: “in what order did the reviewers evaluate the items,” “whether or not they took time to consider their answer before evaluating,” “when did they evaluate (i.e., just after the beginning of the presentation/near the end of the presentation),” and “whether they changed or modified their evaluation score of the evaluation items after they had evaluated.”
4.3. Evaluation Behavior of Each Reviewer during Evaluation for One Group
Fig. 3 presents the acquired data of the evaluation process for one group (Group A). The horizontal axis of each plot is the elapsed time from the start of the presentation (maximum of 20 minutes), and the vertical axis is the evaluation item number (Q1-17). As observed in Fig. 3, the students’ evaluation behavior varies.
With regard to the time spent evaluating, some students spent a long time while others completed the evaluation quickly. In other words, some students began the evaluation just after the presentation started, while other students began the evaluation just before the end of the presentation.
However, with regard to the order in which the items were evaluated, almost all the students began with the first item on the evaluation form. Some of them proceeded in sequential order until they reached the last item, while others seemed to move from item to item without following any particular sequence. Furthermore, a few students did not begin with the first item on the form.
Table 2. Acquired Data Presenter Number of Reviewers
A 49 B 52 C 52 D 52 E 49 F 51 G 1
4.4. Scope of the “evaluation behavior” in this paper and the “Cognitive response process model”
Before discussing evaluation behavior in detail, we will discuss the scope of the evaluation behavior presented in this paper. As mentioned in Section 3.2., the data covered in this paper were collected through a peer assessment, which was conducted during a ninety-minute class. As the online forms were used for conducting peer assessments, depending on the setting, when we made the evaluation form visible or invisible, there may have been evaluation behavior outside the class time (for example, until the start of the next class). However, in the class where we conducted the experiment, the students were required to conduct their evaluation while watching the class presentation and then submit it by the end of the class. In accordance with our experimental policy, we decided to conduct the class in the same way as it had been conducted during the previous year; therefore, in this experiment, evaluation activities occurred only during class times. For the reasons mentioned above, there was no evaluation behavior outside the class in this experiment, and therefore, it will not be considered for discussion.
Furthermore, as described in Section 3.1, the “evaluation process logs” data used in this paper were sent to our server along with a timestamp when the reviewer clicked the submit button and the radio buttons for each evaluation item. This log data can only visualize “when the reviewer clicks a button on the evaluation form.” Evaluation activities or evaluation actions that do not appear as part of a click operation, such as reading an evaluation item, observing an evaluation target, thinking, or making a judgment, are not visualized. Regarding the process that was not visualized in the log, the questionnaire response behavior research field helped to organize the cognitive process for providing the final response; this has been called the "Cognitive Response Process Model” (Dillman, Smyth and Christian 2009; Tourangeau, Rips, and Rasinski 2000; Olson and Parkhurst 2013). The components of this model differ slightly based on the author of each paper. This article uses the version created by Olson and Parkhurst (2013). Fig. 4 illustrates the response process that operates when respondents respond to a form. Steps 1 to 5 and their descriptions are taken from the “Cognitive response process model” in Olson and Parkhurst (2013) and we added the component
Fig.4 Response process that respondents respond to a form
Steps 1 to 5 and their descriptions are taken from the “Cognitive response process model” in Olson and Parkhurst (2013); we added “Answering” as the 6th step.
“Answering” as the sixth step, which was not illustrated in that version.
Descriptions for each component in the figure (other than “Answering”) are quoted from Olson and Parkhurst (2013). The processes include the following: 1. Perception, 2. Comprehension, 3. Retrieval, 4. Judgment, 5. Editing, and 6. Answering. With the method utilizing form click logs such as ours, Steps 1 to 5 are not visible. In other words, we observe only step 6. The answering step as the point at which the final answer was revealed was expressed as clicks. Regarding methods for visualizing Steps 1 to 5 instead of “Answering,” several studies in the questionnaire response behavior research field have used gazes (Galesic, Tourangeau, Couper, and Conrad 2008) or mouse trajectories (Sakamaki and Someya 2011).
We could consider this process to be almost the same as the peer assessment evaluation actions because the respondents respond to a form. When we associate the process of Fig. 4 with our evaluation behavior, Steps 1 to 5 are unobservable, whereas only Step 6 is observable. A detailed discussion is provided in Section 4.5. When considering “students who spent a long time on the evaluation,” there can be two cases: a case where Steps 1 to 5 and Step 6 are both short, and a case where the Step 6 that appears as logs is short. However, Steps 1 to 5 are long. We cannot observe Steps 1 to 5 based on the data we utilized in this study, so we cannot distinguish between the two cases. In the following discussions, we must examine the graph with the above considerations in mind.
4.5. Characteristic Evaluation Behaviors
As illustrated in Fig. 3, the evaluation behavior of the students varies greatly. In this section, we highlight some of the distinctive evaluation behaviors. The characteristic evaluation behaviors are broadly divided into two types: evaluation behaviors for a single presentation, as presented in Fig. 3, and evaluation behaviors for all presentations made in that class.
4.5.1 Characteristic Evaluation Behaviors during Evaluation for One Group
We begin by discussing the evaluation behavior for a single presentation. Fig. 5 and Fig. 6 present excerpted plots of the characteristic evaluation behaviors from Fig. 3. As mentioned in Section 4.3, some students spent a long time on the evaluation (Fig. 5), while others completed it
quickly (Fig. 6). However, as illustrated in Fig. 5 and Fig. 6, there are several subtypes of students among the students who “spent a long time on the evaluation” or “evaluated in a short time.”
(1) Students who spent a long time on the evaluation
As depicted in Fig. 5, there were three types of students who spent a long time on the evaluation: those who evaluated the items almost sequentially (Fig. 5-(a)), those who did not evaluate items sequentially (Fig. 5-(b)), and those who evaluated some items, suspended the process of evaluation for a while, and then resumed (Fig. 5-(c)). Note that the student in Fig. 5-(a) did not evaluate all items strictly in the order of the evaluation items but sometimes returned to the previous items. However, in comparison with the student in Fig. 5-(b) who performed the evaluation in a completely random order, the student in Fig. 5-(a) performed the evaluation almost in the evaluation item order. For this reason, in this paper, the student in Fig. 5-(a) is labeled with “Students who evaluated the items almost in sequential order.”
It can be assumed that the students who evaluated in a sequential order, as depicted in Fig. 5-(a), evaluated the presentation sequentially from the top of the evaluation item list while listening to and watching the presentation.
On the other hand, as depicted in Fig. 5-(b), students who did not evaluate sequentially can be assumed to have evaluated the items that caught their attention, such as a particular slide or a particular behavior of the presenter.
To interpret students’ evaluation behavior, as depicted in Fig. 5-(c), it is necessary to focus on the content of the evaluation item. As discussed in Section 3.3, in the peer assessment form, the last two items were the evaluations of the Q&A session and the overall presentation. For this reason, it is understood that the student depicted in Fig. 5-(c) completed the evaluation except for the Q&A session and the overall presentation in a short time and then evaluated the last two items after the presentation was complete. If considered this way, the student depicted in Fig. 5-(c) can also be regarded as one who “evaluated in a short time.”
(a) Student who evaluated the items almost in sequential order
(b) Student who did not evaluate sequentially
(c) Student who evaluated some of the evaluation items paused for a while and then resumed the evaluation
Fig.5 Various Types of
“Students who spent a long time on the evaluation”
(a) Student who completed the evaluation during the presentation
(b) Student who completed the evaluation when the presentation ended, and the Q&A session began
(c) Student who completed the evaluation sometime after the presentation ended
Fig.6 Various Types of “Students who completed the evaluation in a short time”
(2) Students who completed the evaluation in a short time
As depicted in Fig. 6, there were also three types of students who evaluated the presentation quickly: those who evaluated during the presentation (Fig. 6-(a)), those who completed the evaluation when the presentation ended, and the Q&A session began (Fig. 6-(b), and those who evaluated a while after the presentation ended (Fig. 6-(c)).
In general, the behavior of performing the evaluation in a short time indicates a negative attitude, such as “lack of seriousness.” In the research on response behavior in Web surveys, those who answer quickly are termed “speeders,” and this behavior is an indicator of poor responses (Zhang and Conrad 2014).
However, it is debatable whether those who evaluate in a short time can be regarded as “nonserious reviewers.” This is because, for example, it can be argued that the student who evaluated after the completion of the presentation and at the commencement of the Q&A session (depicted in Fig. 6-(b)) listened to and watched the presentation carefully and that they might have recorded the evaluation mentally or using paper until they recorded it in the evaluation form. In this case, although the input in the evaluation form was made in a short time, it may not necessarily be true that the student evaluated without listening to and watching the presentation carefully.
On the other hand, students such as those depicted in Fig. 6-(a) and 6-(c) are highly likely to have evaluated sloppily. On examining the plot (Fig. 6-(a)), the student completed the evaluation in the middle of the presentation. As mentioned above, the last two evaluation items were questions regarding the Q&A session and the entire presentation. Therefore, it follows that this student evaluated the items regarding Q&A items before that portion of the presentation began and evaluated the entire presentation before it was complete.
As for Fig. 6-(c), this student evaluated a while after the presentation ended. In the case of the type of student depicted in Fig. 6-(c), it is more likely that they made the evaluation in a sloppy fashion rather than after listening to the presentation carefully and entered evaluations later like the student depicted in Fig. 6-(b).
Thus, it is clear that in peer assessments where the situation of the evaluation object changes over time, such as peer assessments of presentation, it
is difficult to judge whether the reviewer evaluated seriously based only on the time spent on the evaluation. To discuss whether the evaluation was made seriously, we believe that it is necessary to consider not only the length of the time taken for the evaluation but also the timing of the evaluation.
4.5.2 Characteristic Evaluation Behaviors during Evaluation for All Groups
In this section, we discuss the evaluation behaviors for all presentations made in that class. Fig. 7 presents a comparison of the characteristic evaluation behaviors between evaluation for one group and for all groups.
The plots in the right column in Fig. 7 are examples of students who presented the characteristic evaluation behavior as “evaluation behavior for all presentations.” The plots in the left column visualize the evaluation behavior of the same student as that on the right side for one presentation. The axis of the plots on the left is the same as that in Figs. 3, 5, and 6. The horizontal axis of each plot is the elapsed time from the start of the presentation (maximum of 20 minutes), and the vertical axis is the evaluation item number (Q1-17). On the other hand, for the plots on the right, the horizontal axis of each plot is the elapsed time from the start of the class (maximum of 90 minutes), and the vertical axis is the evaluation item number (Q1-17)). In the graphs in the right column, there are supposed to be six lines, one each for groups A to F because these plots visualize the evaluation behavior for all the presentations in one plot.
Among the plots in Fig. 7, Fig. 7-(a-1) depicts the “student who took time for the evaluation and did not evaluate sequentially,” which is also presented in Fig. 7-(b). Similarly, Fig. 7-(b-1) represents the “students who evaluated in a short time at the time when the presentation ended, and the Q&A session began,” which is presented in Fig. 7-(b). Looking at the plots in the right column of these students, the students depicted in Fig. 7-(a-2) had similar evaluation behavior through their assessments of five evaluation targets—for example, taking time for the evaluations or not evaluating sequentially. As this student was from the third group, the student did not evaluate the third group; therefore, the number of groups the student evaluated was supposed to be five. Similarly, the student in Fig. 7-(b-2) made evaluations in a short time between when the presentation ended, and the Q&A
session began, then continued this behavior for all six evaluation targets.
From these results, it can be concluded that each student has a particular evaluation behavior and may reproduce the same behavior each time.
On the other hand, the plot of the student in
Fig. 7(c) is blank. This indicates that this student did not evaluate within 20 minutes of the commencement of the presentation. In the plot on the right side of this student’s plot, several line plots appear toward the end of the class. This means that the student did not evaluate each
Evaluation Behaviors in the Single Group Evaluation Behaviors in All Groups
(a-1) (Same Student as Fig. 5-(b)) (a-2)
(a) Student who did not evaluate sequentially
(b-1) (Same Student as Fig.6-(b)) (b-2)
(b) Student who evaluated between when the presentation ending and the Q&A session beginning
(c-1) (c-2)
(c) Student who did not evaluate within 20 minutes of the presentation beginning
group’s presentation as it progressed but evaluated all groups’ presentations together in the end. It can be concluded that this student is an extreme case of the students who “evaluated a while after the presentation ended,” such as
depicted in Fig. 7-(c).
4.6. All Students’ Evaluation Behaviors during the Evaluation for All Groups
In this section, we discuss all the students’
evaluation behaviors during the evaluation for all groups. Fig. 8 presents all students’ evaluation behavior logs during the evaluation of all groups on a single plot. The horizontal axis of the figure represents the elapsed time from the start of the class (maximum of 90 minutes).
In this figure, it is not easy to distinguish the behavior of each reviewer because the plots overlap each other. However, it is possible to examine the evaluation behavior of the entire class in this figure; each reviewer tends to progress with the presentations from A to F.
As already discussed in Figs. 3 and 5, some students evaluated a long time after the presentation ended. Furthermore, in the evaluation of group F, some students completed their evaluation before the presentation commenced. An extreme example of this case is the student represented by the line on the left side of Fig. 8. This student is the same student as depicted in Fig. 7-(c-2.) This student accidentally evaluated group G despite this group not having made a presentation that week. This might be because the student completed too many evaluations in a short time.
What needs to be pointed out is that both the “students who completed the evaluation before the presentation started” and the “students who mistakenly evaluated a group that did not make a presentation that week” evaluated in a very short time. In Section 4.5.1, we have mentioned that responses given in a short time were an indicator of non-seriousness in research on questionnaire responses. On the other hand, we have also pointed out that it is difficult to judge whether the reviewer evaluated seriously or not, even if they evaluated in a short time in this kind of peer assessment where the situation of the evaluation object changes over time. This was because there were students, such as those depicted in Fig. 6-(b), who were assumed to have listened to and watched the presentation carefully but recorded their inputs in the evaluation forms after some time. However, the action of “complete evaluation before the start of presentation” or “incorrectly evaluate to a group not giving a presentation” is clearly the result of not evaluating seriously.
From this discussion, we can conclude that it is important to be aware of the possibility that each student might have a unique style of evaluation behavior. It also became clear that there were students who did not evaluate seriously and that these students often made evaluations in a short period.
5. CONCLUSION
In this paper, we focused on peer assessments of students’ presentations, acquired the log of the evaluation process, and analyzed their “Evaluation Behaviors.” The purpose of this research was to answer this research question, “How do students evaluate each other during peer assessments?” To achieve this purpose, we broke the research question into the following three sub-questions: (1) Is it worth focusing on evaluation behavior? (2) How can we visualize their evaluation behaviors? and (3) What kind of characteristic behaviors are there? To answer these sub-questions, we set the following three objectives corresponding to each sub-question: (1) investigate similar studies, organize them, and compare them with our research; (2) establish a method of acquisition of the evaluation process and visualization of evaluation behavior; and (3) extract characteristic evaluation behaviors.
As a result of the first objective, it became clear that, in the field of social science, there have been many studies that acquire the answering process data through surveys or questionnaires. Although the research fields are different, the analysis of the evaluation behavior of Peer Assessment, which we focused on, and the analysis of “Response Behavior” or “Answering Behavior” in the field of social research were quite similar in terms of both the data and behavior. For this reason, we believe that visualizing and analyzing evaluation behavior can also generate valuable findings related to peer assessments.
For the second objective, we developed a peer assessment tool to detect students’ evaluation process data. Using this form, we conducted an experiment to acquire evaluation process data from a class and visualized the evaluation behavior. The plots in the proposed format can express or visualize the following “Evaluation Behaviors:” “in what order did the reviewers evaluate,” “whether or not they took time to evaluate,” “when did they evaluate (i.e., just after the beginning of the presentation/near the end of the presentation),” and “whether they changed or modified their evaluation score of the items before submission.”
Finally, for the third objective, we extracted and discussed characteristic evaluation behaviors. Consequently, we found characteristic evaluation behaviors such as “did not evaluate sequentially,” “evaluated in a short time,” and “did not make evaluation during the presentation.” The study
results suggest that evaluation behaviors differ from student to student, and at the same time, that each student might have a unique style of evaluation. It also became clear that there were students who did not evaluate seriously and that these students often made evaluations in a short period.
6. FUTURE RESEARCH
In this paper, we revealed the significance of conducting research on the evaluation process and evaluation behavior in peer assessment. Simultaneously, several questions, hypotheses, and tasks remain to be addressed and should be undertaken in future research.
The first task is to compare the “Evaluation Behavior,” which our proposed method analyzed in this study, with the “Score” studied by the conventional method. In this paper, we found that there were several types of students: those who spent a long time on their evaluation; those who completed their evaluation quickly; those who evaluated items in order; and those who did not evaluate them sequentially. Therefore, for the next step, it is necessary to verify whether there is a difference in the degree of reliability and validity of the scores, depending on the time taken for the evaluation or the evaluation behavior pattern (sequential or nonsequential).
The second task is to discuss evaluation behavior quantitatively. In this paper, we visualized and discussed the evaluation behavior qualitatively using plots. Qualitative methods are suitable for discussing the characteristics of each student. However, qualitative methods have limitations in understanding or discussing the entire class’s characteristics; moreover, the qualitative analysis features are not machine-readable. Going forward, a method to quantitatively discuss the characteristics of evaluation behavior needs to be developed.
The third task is to establish the extraction and interpretation of characteristic evaluation behaviors. It is necessary to construct an interpretation hypothesis for the characteristic evaluation behavior extracted in this study and verify whether our interpretation hypothesis is correct by using a questionnaire or interview. Additionally, we expect that it would be effective to compare the interpretation of the answering behavior findings with that of the paradata research mentioned earlier or compare these findings with those of the conventional method
using the score. For instance, it is said that “respondents tended to answer more quickly as they got closer to the end of the question” (Yan and Tourangeau 2008, p.64) in paradata research. This means that respondents (or reviewers) tend to answer more quickly, not because of their response style, but because they would like to quickly complete the evaluation.
The fourth task is to clarify the relationship between the abovementioned characteristic evaluation behavior and “class design” or “evaluation form design.” In this paper, we discussed only the nature and style of individual reviewers as the cause of characteristic evaluation behavior. However, we have hypothesized that “class design,” such as “how many times the teacher makes the students evaluate in each class,” “how many minutes the presentation length is,” or “how many evaluation items the students evaluate during a presentation,” can influence students’ motivation or seriousness, which might lead to specific evaluation behavior. We also hypothesized that “evaluation form design” such as “whether the form is multiple choice or a rubric,” “the wording of criteria,” or “whether the selector is pre-selected or not,” might influence students’ behavior.
These hypotheses are based on similar hypotheses and findings in research on paradata. For instance, Masuda, Sakagami, and Kitaoka (2017) examined whether responding to many items increased the “middle category response.” The “middle category response” is the respondent’s tendency to choose a selector placed in the center. This behavior is considered an indicator of a lack of seriousness. Their results demonstrated that the endorsement of the middle category increased for the items placed later in the questionnaire.
Preliminary examinations and analyses of these tasks are underway and have been reported in the oral presentations (Horikoshi and Tamura 2017b, (Task 1, 4), 2018a (Task 3), 2018b (1, 4), 2018c (Task 2), and 2018d (Task 2)).
NOTES
This paper is an expanded and revised version of the following papers.
HORIKOSHI, I. and TAMURA, Y. (2017a) Analysis of students’ peer assessment processes. YANG, J. C. et al. (Eds.), Extended Summary Proceedings of the 25th International Conference on Computers in Education. (ICCE 2017), 25-30
HORIKOSHI, I. and TAMURA, Y. (2019) Analysis of “Evaluation Behavior” using students’ peer assessment process data. YANG, J. C. et al. (Eds.), Doctoral Student Consortium Proceedings of the 25th International Conference on Computers in Education. (ICCE 2019), DCS-01
Also, as mentioned in Chapter 6, some of the future works have already been reported in the following presentation.
HORIKOSHI, I. and TAMURA, Y. (2017b) Timing acquisition of students' peer assessment. Japanese Society for Learning Analytics report (In Japanese) HORIKOSHI, I. and TAMURA, Y. (2018a) Evaluation
behavior analysis in peer assessment using evaluation process data: comparison with response behavior analysis using paradata in web survey. Proceedings of the 46th Annual Meeting of the Behaviormetric Society, 46:196-199 (In Japanese)
HORIKOSHI, I. and TAMURA, Y. (2018b) Comparison of evaluation behavior between learner and teaching assistant during peer assessment of oral presentation.
Research report of JSET Conferences. 18(5):37-44 (In Japanese)
HORIKOSHI, I. and TAMURA, Y. (2018c) Analysis of “Evaluation Time” in peer assessment based on evaluation log. Proceedings of the Annual Conference of Japanese Society for Information and Systems in Education, 43:325-326 (In Japanese)
HORIKOSHI, I. and TAMURA, Y. (2018d) Feature extraction of learners’ motivation from peer assessment process logs. YANG, J. C. et al. (Eds.),.
Proceedings of the 26th International Conference on Computers in Education. Philippines: Asia-Pacific Society for Computers in Education, 352-354
REFERENCES
BASSILI, J. N. (1996) The how and the why of response latency measurement in telephone surveys. Schwarz, N., and Sudman, S., (Eds.), Answering Questions: Methodology for Determining Cognitive and Communicative Processes in Survey Research, 319–346. San Francisco: Jossey-Bass
BROWN, J. D. (1998) New Ways of Classroom Assessment (New Ways in TESOL Series II: Innovative Classroom Techniques). TESOL
COUPER, M. P. (1998) Measuring Survey Quality in a CASIC Environment. Proceedings of the Survey Research Methods Section of the ASA at JSM1998, 41-49
COUPER, M. P. (2000a) Web Surveys: A Review of Issues and Approaches. Public Opinion Quarterly, 64(4):464-494
COUPER, M. P. (2000b) Usability Evaluation of Computer-Assisted Survey Instruments. Soc. Sci. Comp. Rev., 18(4):384-396
COUPER, M. P. and KREUTER, F. (2013) Using paradata to explore item level response times in surveys. J. Royal Stat. Soc.: Series A (Stat. Soc.), 176(1): 271-286
COUPER, M. P. (2017) “Birth and Diffusion of the Concept of Paradata” (in Japanese – Translated by W. Matsumoto). Adv. Soc. Res., 18:14-26
DILLMAN, D. A. SMYTH, J. D. and CHRISTIAN, L. M. (2009) Internet, Mail and Mixed-Mode Surveys: The
Tailored Design Method. 3rd edition. Wiley and Sons, Inc., Hoboken, NJ
FREEMAN, M. (1995) Peer Assessment by Groups of Group Work. Assess. Eval. Higher Ed., 20(3):289-300 FUJIHARA, Y. OHNISHI, H. and KATO, H. (2006) A Practice of Mutual Evaluation in Formative Evaluation Using a Report Evaluating Support System. IEICE technical report. Educ. Tech., 106(166):65-70 (In Japanese)
FUJIHARA, Y., OHNISHI, H. and KATO, H. (2007) Review of Research on Peer Evaluation. J. Multimedia Aided Educ. Res., 4(1):77-85 (In Japanese)
FUKAZAWA, M. (2010) Validity of Peer Assessment of Speech Performance. Annual Rev. Eng. Lang. Educ. Japan, 21:181-190 (In Japanese)
GALESIC, M., TOURANGEAU, R., COUPER, M. P. and CONRAD, F. G. (2008) Eye-tracking data: New insights on response order effects and other cognitive shortcuts in survey responding. Pub. Opinion Q., 72(5):892-913
GROVES, R., FOWLER, F., COUPER, M., LEPKOWSKI, J., SINGER, E. and TOURANGEAU, R. (2004) Inference and Error in Surveys. Groves RM, Kalton G, Rao JNK, et al. (Eds) Surv. Methodolog., Wiley, 39-63
GROVES, R. M. and LYBERG, L. (2010) Total Survey Error: Past, Present, and Future. Pub. Opinion Q., 74(5):849-879
HEERWEGH, D. (2003) Explaining Response Latencies and Changing Answers Using Client-Side Paradata From a Web Survey. Soc. Sci. Comp. Rev., 21(3):360-373
HUGHES, I. and LARGE, B. (1993) Staff and Peer-Group Assessment of Oral Communication Skills. Stud. Higher Educ., 18(3):379-385
KREUTER, F. (Ed.). (2013) Improving surveys with paradata: Analytic uses of process information. John Wiley & Sons
MANIACI, M. R. and ROGGE, R. D. (2014) Caring About Carelessness: Participant Inattention and its Effects on Research. J. Res. Personality, 48:61-83
MASUDA, S., SAKAGAMI, T. and KITAOKA, K. (2017) Responding to Many Items in a Questionnaire Increases Middle Category Response. Japanese J. Behaviormetrics, 44(2):117-128 (In Japanese) MILLER, L. and NG, R. (1996) Autonomy in the
Classroom: Peer Assessment. In R. Pemberton, S. L. Edward, W. W. F. Or, & H. D. Pierson (Eds.) Taking control: Autonomy in Language Learning, Hong Kong University Press, 133-146
OLSON, K. and PARKHURST, B. (2013) Collecting Paradata for Measurement Error Evaluations. In Kreuter (Eds.), Improving Surveys with Paradata, 43-72. F. Wiley
ORSMOND, P., MERRY, S. and REILING, K. (1996) The Importance of Marking Criteria in the Use of Peer Assessment. Assess. Eval. Higher Educ., 21(3):239-250
SAKAMAKI, R. and SOMEYA, S. (2011) Rank Presumption of Strength of Conviction Level Based on Respondent’s Mouse-log in Web-query with Image Choices. Transactions Visualiz. Soc. Japan, 31(12):69-77 (In Japanese)
STEFANI, L. A. (1994) Peer, Self and Tutor Assessment: Relative Reliabilities. Stud. Higher Educ., 19(1):69-75 TOPPING, K. (1998) Peer Assessment Between Students in Colleges and Universities. Rev. Educ. Res.,
68(3):249-276
TOURANGEAU, R., RIPS, L. J. and RASINSKI, K. (2000)
The psychology of survey response. Cambridge University Press
TOURANGEAU, R., CONRAD, F. G. and COUPER, M. P. (2013) The science of web surveys. Oxford University Press
UENO, M., SONGMUANG, P., OKAMOTO, T. and NAGAOKA, K. (2008) Item Response Theory with Assessors’ parameters of Peer Assessment, IEICE TRANSACTIONS on Inf. Syst., 377-388
YAN, T. and TOURANGEAU, R. (2008) Fast Times and Easy Questions: The Effects of Age, Experience and
Question Complexity on Web Survey Response Times.
Appl. Cog. Psych.: Official J. Soc. App. Res. Mem. Cog., 22(1):51-68
ZHANG, C. and CONRAD, F. (2014) Speeding in Web Surveys: The Tendency to Answer Very Fast and its Association with Straightlining. Surv. Res. Meth.,