Japan Advanced Institute of Science and Technology
JAIST Repository
https://dspace.jaist.ac.jp/
Title
A consensus making support system using AHP in
combination with KJ method and relationship
matrix
Author(s)
Kato, Naotaka; Kunifuji, Susumu
Citation
Research report (School of Information Science,
Japan Advanced Institute of Science and
Technology), IS-RR-96-0030: 1-14
Issue Date
1996-11-12
Type
Technical Report
Text version
publisher
URL
http://hdl.handle.net/10119/8373
Rights
Description
リサーチレポート(北陸先端科学技術大学院大学情報
A CONSENSUS
MAKING
SUPPORT
SYSTEM
USING
AHP
IN COMBINATION
WITH
KJ
METHOD
AND
RELATIONSHIP
MATRIX
Naotaka Kato
Susumu Kunifuji
November, 12 1996
IS-RR-96-0030
School of Information Science
Japan Advanced Institute of Science and Technology, Hokuriku
Asahidai 1-1, Tatsunokuchi
Nomi, Ishikawa, 923-12, JAPAN
nkato@jaist.ac.jp
©Naotaka Kato, Susumu Kunifuji, 1996
Abstract:
We propose a computer assisted method of consensus making for cooperative
group decision problem solving. The problem solving has a process which constructs
appropriate evaluation structure interactively and chooses the optimal alternative plan
rationally. However, in this problem solving, the problem is usually complicated because
it contains some ill-structured elements and each participant in the group has his own sense
of value which is different from the others. Additionally, both subjective and objective
evaluations are often needed in order to solve the problem. These make the problem
solving more complexed. Our major concern is to support the problem solving rationally
by using distributed computer systems. We expect the problem can be solved effectively
by integrating various techniques of creative thinking support, system engineering, group
decision support and groupware. This paper describes a consensus making support method
which uses AHP in combination with a creative thinking method and a relationship matrix
associating subjective evaluation with objective evaluation. The implementation example
is also given.
Introduction
This paper focuses on an integrated architecture of requirement acquisition, creative thinking,
decision-making, and groupware system. So far, one of the authors has designed and implemented a
knowl-edge acquisition support groupware GRAPE(GRoupware for Acquiring, Processing, and Evaluating
knowledge)(H.Ueda and S.Kunifuji,1993) by combining appropriate system analysis methodologies
with system modelling methodologies(i.e., ISM(J.N.Warfield,1974), Extended ISM(S.kunifuji and
T.Takeshima,1979), Fuzzy Clustering(L.A.Zadeh,1971),
AHP(Analytic Hierarchy Process)(T.L.Saaty,
1980), and so on.) We have also developed another different system(H.Nagata,1994) to support the
judgement which has the rationality of decision makers. These systems are bottom-up-typed group
DSSs and have convergent thinking support functions. However, they are not sufficient for
construct-ing appropriate evaluation structure because they don't have functions which can correct evaluation
structure interactively. In case of the insufficient structure, iterative correction of its structure is
necessary. For this purpose, we expect that integrating creative thinking method which is
com-posed of divergent thinking process and convergent thinking process into these DSSs is useful. In
the past, there are some creative thinking methods existing in Japan. Especially, KJ(Kawakita Jiro)
method(J.Kawakita,1975) is one of the most interesting creative thinking methods, which is composed
of divergent thinking process and convergent thinking process. It is widely used for two reasons. Oneis due to the suitability for requirement acquisition and requirement analysis(N.Takeda, A.Shiomi,
K.Kawai and H.Ohiwa,1993). The other is that some useful computer assisted tools such as KJ
Edi-tor(H.Ohiwa, K.Kawai and M.Koyama,1990) and Diagram Abductor(K.Sugiyama and K.Misue,1991)
have been developed.Inspired by these methods and systems, we are now designing and implementing a new type of
consen-sus making support system for group decision problem solving(N.Kato and S.Kunifuji,1995;S.Kunifuji,
T.Tamura and N.Kato,1995). The characteristics of our system are as follows:
• Combination of a creative thinking method (i.e. KJ method) and a group decision support
method.• A new hybrid system with divergent thinking support functions and convergent thinking support functions.
• Bi-directional transformation between subjective evaluation and objective evaluation using
lationship matrix.
• Two types of tradeoff analysis mechanisms implimented for consensus making.
This paper is organized as follows; first, the outline of KJ method is described. Next, we describe our
concepts and our consensus making support system in detail. Finally, some conclusions are given.
KJ Method
The original KJ method contains the following basic procedures.
1. Label Making: Each label is often derived from Brainstorming.
2. Label Grouping: It consists of label collection, grouping, and naming. A group can be nested and each group is also named. This label grouping is useful for getting a new hypothesis.
3. Chart Making: To find the relation among groups and/or labels. The relation may be similar,
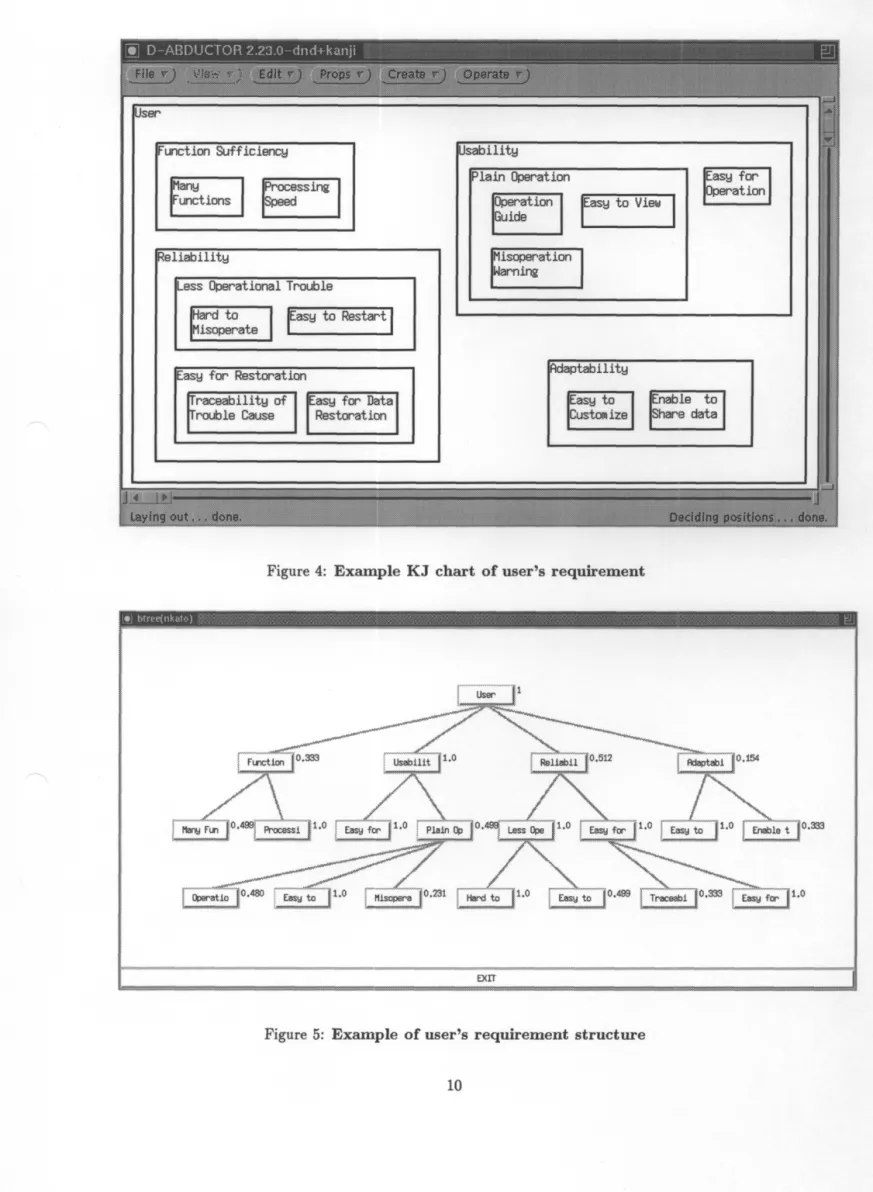
opposite, cause-from, etc. The chart is called A-type of KJ method.The step of label making is a divergent thinking process, and the other steps are convergent thinking processes. The whole information of the creative thinking activity is concentrated in the A-type chart which is obtained by KJ method. An example chart of user's requirement in software development is shown in Figure 4. The chart externalizes the results of the creative thinking of all participants. Using this chart, we can extract the common part of the recognition and the common sense of value. These make KJ method useful for recognizing the common part in the early stage of consensus mak-ing. Moreover, the chart obtained by KJ method can be used as the hierarchical evaluation structure of AHP directly. In traditional AHP, this structure is usually obtained by a kind of non-systematic or heuristic method. We expect that the idea of applying KJ method, which is a systematic method, to construct the evaluation structure of AHP will give a better result than using the traditional method. From the above reasons, we apply KJ method to construct the evaluation structure of AHP for consensus making.
Concept of the Proposed System
Our concept is depicted in Figure 1. A requirement of a participant depends on his sense of value and also his stand point on the occasion of consensus making. So, firstly, we introduce a point of view that is called a priority as the basic measure to show some differences of sense of value and some degrees of compromise. According to this, we suppose that a participant's requirement is composed of some requirement elements associated with weight values denoting the priority. Such a requirement is represented by a hierarchical tree structure. Hereafter, we will simply deal with the requirement as mentioned above.
Person A's Sense of Value Person B's Sense of Value Requirement
0
Person A Requirement Structure _ Tradeoff Analysis Transformation Transformed Structure Tradeoff Analysis Person B Transformed Structure Inverse Transformation Requirement Structure Requirement).J
Figure 1: Concept of the proposed system
in Person B's sense of value. On the other hand, we transform the requirement in Person B's sense
of value into the dimension of the requirement in Person A's sense of value vice versa. According to
this, it is possible to do mutual adjusting of sense of value. In other words, the requirement in Person
B's sense of value can be understood as the requirement which is possible to interpret in Person A's
sense of value. The opposite matter is the same too. Then, we believe that it is possible to support a
consensus making by showing a mutual requirement each other. A relationship matrix is used for the
process of these transformation and inverse transformation.
We contrived this relationship matrix
based on QDA(Quality Deployment Approach)(A.Ohmori,1994) which is known as the methodology
of the quality control management.By the way, the requirements of the participants are various. Especially, the opinion competition always exists among the participants. Some priorities have to be sacrified in order to carry out the other priority in some cases. So, appropriate value judgement of priority is necessary in such cases. Such a procedure is called tradeoff. To discover the existence of tradeoff which lurks among par-ticipants and to remove it efficiently is important in the consensus making process. Therefore, two kinds of tradeoff analysis mechanisms are implemented on our system to acquire the requirement of all participants and to support the consensus making, respectively. We define the tradeoff analysis as finding requirement element sets which have tradeoff relation and analyzing sensitivity for more effective consensus making.
System Functions And Techniques
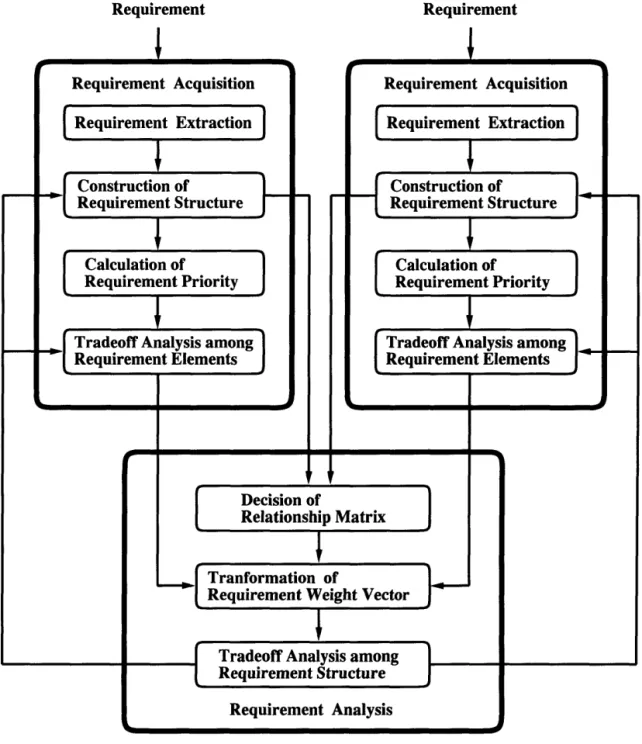
The functional flow of our system is shown in Figure 2. requirement acquisition module and requirement analysis
• requirement acquisition module
It is composed of the following four sub-function
It is composed of two function modules: module.
modules: (1) requirement extraction, (2)
Requirement Requirement Requirement Acquisition Requirement Extraction Construction of Requirement Structure Calculation of Requirement Priority
Tradeoff Analysis among Requirement Elements Requirement Acquisition Requirement Extraction Construction of Requirement Structure Calculation of Requirement Priority
Tradeoff Analysis among Requirement Elements
Decision of
Relationship Matrix
Tranformation of
Requirement Weight Vector
Tradeoff Analysis among Requirement Structure
Requirement Analysis
Figure 2: System function flow
construction of requirement structure, and (3) calculation of requirement priority, (4) tradeoff
analysis among requirement elements. Here, Diagram Abductor can be used for module (1)
and (2), which is a computer assisted tool for KJ method. ISM software can also be used for
module (2).
• requirement analysis module
It is composed of the following four sub-function modules: (1) decision of relationship matrix, (2)
transformation of requirement weight vector, (3) inverse transformation of requirement weight
vector, and (4) tradeoff analysis among requirement structure.
X window system. For example, when noticing should be added or ignored with progressing in th be appropriately corrected.
The detail of eac
the existence of new requirement elements which e consensus making, the requirement structure can
h function and technique is describ ed in the order as follows. Requirement Acquisition
The requirement acquisition is to extract requirement elements, to construct its structure, and to calculate priorities among these elements. As the result, requirements are embodied in the form of a set of the requirement elements associated with weight values denoting the priority and represented by a hierarchical tree structure.
Requirement Extraction
First, the tangible or latent requirement of the participants are collected
candid primitive word labels(for example, easiness, simplicity, portability,
on). Brainstorming is often used to collect the labels.
Making of Requirement Structure
in the form of the flexibility, and so
We use KJ method to form the requirement structure which is composed of a set of the concise
linguistic expression. To improve the efficiency of KJ label making, if necessary, it is possible
to pick up KJ labels from the group collected in the past. By the similar procedure, we acquire
the requirement of all of each participants. Incidentally, we construct the requirement
struc-ture using KJ method in principle, and ISM method is also available. This method is effective
when the consciousness of participants to the problem and the knowledge level to the object
knowledge are high.
Calculation of Requirement Priority
Generally, each requirement element differs in the measure and, moreover, it has a subjective
characteristic. We use AHP as the method of suiting priority calculation among such elements.
AHP is a method of calculating ratio measure values with the consistency from doing each pair
comparison among the elements and the values, assumed to be relative weights, denote the
priority. Hereafter, we will deal with these weights as the priority of requirement elements.
As the weight, AHP defines the eigen vector w = (w1, w2,
•••,
wn)
Amax obtained from the pair comparison matrix A in formula(1).
A= [aij]
of the maximum eigen value
(1)
where ai j is a pair comparison value
aii = 1, aji = Vai .9, ai2 >0 (1<i<n,
1<j<n)
(2)
A relation between aij and wison matrix is complete.
is shown by formula (3) when the consistency of the pair
compar-aij = wi/wj
(3)
However, the consistency is generally incomplete because a pair comparison value is subjectively
judged and fixed. According to the theory of AHP, the degree of consistency is called consistency
index and is shown using symbol C.I.. C.I. is given by the following formula(4).
C.I. = (Amax — 1)/(n — 1)(4)
By the way, the following two points are the problems of AHP.
1. Pair comparative work becomes complex when the number of the comparative elements increases. Consequently, the mental load of the worker increases.
2. It is not usual to get mutual complete independency, which is a condition of applying AHP, among the requirement elements obtained by KJ method. In other words, the dependency
often exists among the requirement elements. Generally, it is difficult to remove this dependency totally.
Therefore, we apply incomplete pairwise comparison method in AHP(Harker,P.T.,1987) to
lem 1 and method of AHP using non-additive weight(H.Ichihashi and H.Tanaka,1987) to
prob-lem 2.
Incomplete Pairwise Comparison Method in AHP
This is the technique composing the total pair comparison matrix which has a consistency as a whole by complementing the part for there to be a consistency in which there is not con-fidence in a pair comparison or not to be understood by the information lack. There is an effect that the number of the pair comparison decreases by using this technique. And this effect can also diminish the load of the pair comparison work when the number of the comparative elements is increased.
AHP Using Non-additive Weight
As for the requirement structure, the original weight values of AHP change and the reverse phenomenon of the weight order sometimes happens when there is the dependency among the requirement elements or when some new requirement elements are added. This reason is that the weight values are defined as the additive measure which is normalized for the weight sum-mation to become 1.
Therefore, with applying this method, we can remove the occurrence of the reverse phenomenon of the weight order. We normalize the weight values for the weight maximum to become 1 after finding them in original AHP.
Tradeoff Analysis Among Requirement Elements
When there is a difference between the expectation (or dissatisfaction) and the weight
val-ues found by the above procedure, it is necessary to revise the weight valval-ues. Also, in the next step of consensus making, the weight values must be adjusted to advance the compromise pro-cess of the mutual requirement. To achive the above purpose, the tradeoff analysis among the requirement elements becomes necessary. We propose an efficient technique of tradeoff analysis.
Our approach applies the sensitivity coefficients of the weight vector w(the values calculated by
differentiating the weight vector cv by the pair comparison value aii)(See T.Masuda,1987.) By
this method, we can support the strategies which revise any pair comparison value by referring to these calculated sensitivity coefficients. More precisely, we can choose the combination of the pair comparison, that makes the tradeoff operation work with the most effectiveness. Our system shows a user the candidates aii orderly with respect to the sensitivity coefficient. Theuser can revise the pair comparison value ai3 which the tradeoff effect seems to be high. (i.e.,
the sensitivity coefficient is high.) Repetitively, the weight is re-calculated and the consistency
index will be checked again.Requirement Analysis
The requirement analysis is to analyze priorities of requirement elements among some requirements of the participants. This section describes a technique for transforming the requirement in one's sense of value into the dimension of requirement in the other's sense of value. Next, the reverse procedure is described. Finally, we show the way to analyze these priorities by the tradeoff analy-sis technique. For simplicity, we explain these techniques using an example in a case of product design.
Decision of Relationship Matrix
Generally, a user's sense of value is subjective and qualitative, whereas a developer's sense
of value is objective and quantitative. For example, the user's requirements are somethings like
easiness of viewing display, easiness of operation, high speed processing and so on. Whereas
the developer's requirements are such things as menu operation function, learning function,
high-speed calculation function and so on. Therefore, we suppose the relationship table which
provides the strength of the relationship between the user's requirement and the developer's
requirement (for example, see Figure 3).
We suppose that the user's requirement elements is set to the row of the table, and the de-veloper's requirement elements is set to the column of the table. Next, we place the strength
of the relationship by the symbol like © (strong), 0 (middle), A (weak) in the table. Lastly,
a relationship matrix is made by giving five points to ©, three points to 0, one point to A,
and 0 points to the others. In this way, the relationship matrix of two types of requirements is
represented by the two dimensional matrix. This procedure is based on QDA method which is
developed for the product quality management to reflect a customer requirement and is widely
used for the mechanical product design mainly.
Transformation of Requirement Weight Vector
By using this a developer's relationship requirement. matrix, a user Suppose that
's requirement is transformed into the dimension a weight vector of the user's requirement is u, a
of
re-Including Many Functions Sufficiency of Processing Speed Easy to Operate
Including Operation Guides Easy to View Misoperation Warning Hard to Misoperate u
0
0
0
0
C0
0
0
A
0
0
C
0
0
0
Os C a ti0
0
3 C O O. CA
0
0
D C0
0
0
0
0
A
0.0
0
d C O0
0
A
C O A O UA
0
00 C0
0
0
0
A
A
Figure 3 : A part of an example of relationship table
quirement weight vector which is transformed into the developer's side is v'. We can formulate the relationship between u and v' as follows:
VI = W u
(5)
where W is a transposed relationship matrix. With this formula, the developer can understand which functions the user wants and their priorities by transforming the user's requirement into the dimension of the developer's requirement. We have to assign the relationship strengths carefully because they will influence on the result straight. For example, we apply the following rule to decide relationship values to reflect the user's requirement as aggressively as possible.
1. To avoid the misunderstanding about the meaning of technical terminologies and about
the developer's requirement elements, the developer should explain them to the user.
2. The user checks all of each element of relationship table and fixes their relationship values
subjectively. Incidentally, the obscure part of the relationship is fixed after getting the
advice of the developer.
3. After that, the developer checks a relationship table.
Then, if there is any contradictory point or any improvement, the developer points out the part to the user and the user corrects it. Therefore, it is desirable that the user and the developer should cooperate together to fix the relationship values.
Inverse Transformation of Requirement Weight Vector
Next, an inverse transformation technique which make feed back from a developer's
require-ment to a user is described. The relationship transpose matrix W in formula (5) is rectangular
matrix generally. According to the theory of the generalized inverse matrix(Y.Okamoto,1992),
it is known that an inverse matrix of W exists uniquely when the condition of Moore-Penrosegeneralized inverse matrix (shown in the following) is met.
(WW+)t = WW+(6)
(W+W)t = W+W(7)
WW+W =W(8)
W+WW+ = W+(9)
where W+ is a Moore-Penrose generalized inverse matrix. It is known that an optional rect-angular matrix has a Moore-Penrose generalized inverse matrix uniquely. That is, supposing that the developer's requirement weight vector is v, the requirement weight vector u' which is
transformed into the user's side is shown by formula (10).
u'=W+v
(10)
Therefore, the developer becomes able to grasp the user's viewpoint at the level of his own
view-point by using formula (5). In the same way, the user becomes able to grasp the developer's
viewpoint at the level of his own viewpoint by formula (10). In other words, at the same time as
the user's requirement is directly reflected into software functions, the developer's requirement is fed back to the user.Tradeoff Analysis Among Requirement Weight Vector
u and v' in formula (5) express a user's weight vector and its transformed weight vector at
the early stage before starting the consensus making process. In the same way, v and u' informula (10) express a developer's weight vector and its transformed weight vector at the early
stage. Generally, the vector direction between u and u'(or v and v') is different in this stage. In
order to step up each other for the consensus making, we suppose that the developer changeshis requirement vector as indicated by Av, whereas the user changes his requirement vector as indicated by Au. A littte change of Av and Au is recommended. Next, we define the following index functions using the above parameters.
— The index functions shown to the user
— The
S(Au, Au') = (u — Du)t(u' — Au')
Ru(Au) = ut(u — Au)
Rd(Du') = u't(u' — Au')
C = S/(aRu + /3Rd)
index function shown to the developer
(11)
(12)
(13)
(14)
S(Av, Av') = (v — Av)t(v' — Av')(15)
Ru(iv') = v't(v' — Av')(16)
Rd(Ev) = vt(v — Av)(17)
C = S/(aRu + /3Rd)(18)
where(a + 0 = 1, a > 0, /3 > 0)(19)
where S shows the approaching degree between the modification of the user's sense of value and that of the developer's one, Ru shows the changed degree of the user's requirement, Rd
shows the changed degree of the developer's requirement, and C shows the consensus making
degree of both. Rd and Ru often mean the degree of dissatisfaction or concession. a and 0 are suitable weighting coefficient that is decided by both conditions. Then, the values of formula
(11)-(14) are shown to the user on the screen display by graphical charts. Similarly, the values
of formula (15)-(18) are shown to the developer. While viewing these values, both the user
and the developer change their own requirement weight vectors with interactive mode for the consensus making. These changes are reflected in the above index function's value at once. The consensus making is supported by repeating the above sensitivity analysis.Example of Implementation
We are now implementing a prototype system on a SUN work station with X Window system
en-vironment. It has some groupware functions(WYSIWIS:What You See Is What I See). We show
a small example of deciding functional specification in software development, in which our method apply to the function analysis process to reflect both a user's requirement and a developer's one. The upper process of software design such as planning, making of specification is essential to develop software. In this process, creative thinking is the main part and is done by the group cooperative work. Problem solving, software design, progresses while both the user and the developer show their own requirements mutually and look for the compromise of their requirements. But actually, com-munication gap often occurs among them which obstructs their consensus making. Therefore, the improvement of above-mentioned group cooperative work can be expected with our proposed method.The user's requirement of this example obtained by KJ supporting tool software (i.e. Diagram
Abductor) has a nested structure as shown in Figure 4. The user's requirement structure can be
derived directly by this nested structure and it is shown in Figure 5. Each value of requirement weight is denoted at the right side of its own requirement element box. Figure 6 denotes an example of the operation screen during a pair comparison is done and the values of requirement weight are calculated. The developer's requirement structure is abbreviated, but it has the similar structure as the user's one. The requirement acquisition resulting in the early stage is shown in Figure 7. The left upper window denotes the original user's requirement, the left lower window denotes the user's re-quirement transformed into the dimension of developer's requirement, the right lower window denotesser unction Sufficiency Many Functions Processing Speed eliability
Less Operational Trouble
Hard to Misoperate
asy to Restart
sability
Plain Operation
Easy for Restoration raceability of rouble Cause Operation Guide Easy to View Misoperation Warning Easy for Operation
asy for Data Restoration Adaptability asyto ustomize nable to hare data
Figure 4: Example KJ chart of user's requirement
User 11
Function 0.333 usabilit ,V •1,0 Reliabil 0.512 Rdeptabi 0.154 0.499
0 ~.. Less:..Ope
1,0 Easy,.: ,.., 1.0Enable t :0• s .
0.480 Miscpera 0•231 Hard to 1.0 Easy to ..0.499
Traceabi 0.333 Easy for ^ 1.0
EXIT
Function 0.333 Usabilit 1.0 Reliabil 0.512 Rdaptabi 0.154 Many Fun 0.499 Processi 1.0
Operatio Easyfor1.0 P__i~ On
0.480
x--E;s:u 1.0
Misopera 0.4990.231
v
H 1.0~ ~~.
t k 1Ji...}~%o
t„ti
nti$%7e'~
~,¢'{G'N
}'•.`"3~iCQ~CpF.q'hA,~r.A.-.eik
FV•}~...'.;...,if¢Si3Edfrv^,raR;`qiLi
"s
Easyµto
0.499
Traceabi
0.333
r •4'a~~'i3~`kFig ure 6: Example of pair corn parison and calculation of requirement weight
REITJIRDENT ELEMENT'S WIGHT VALUES 1: 2: 3: 4: 5: 6: 7: 8: 9: 10: 11: 12: Many Functions Processing Speed Easy for Operation Operation Guide Easy to Vier
Misoperation Warning Hard to Misoperate Easy to Restart
Traceability of Trouble Cause Easy for Data Restoration Easy to Customize Enable to Share data
- 0.166 0.333 0(11 0.240 ^rrtrrrrmINIMMEN 0.499 - 0.115 NMNIIIIIIII1111111110.512 mrmrrlr 0.256 - 0.170 0.512 11111110.154 ^ 0.051 1.000
REQUD7Q4ff ELEMENFS IFIGHT VALUES 1: Many Functions
2: Processing Speed 3: Easy for Operation 4: Operation Guide 5: Easy to Vier 6: Misoperation Warning 7: Hard to Misoperate 8: Easy to Restart
9: Traceability of Trable Cause 10: Easy for Data Restoration 11: Easy to Customize 12: Enable to Share data
mm>r 0.181 ^ 0.030 10.022 0.397 0.731 m#r 0.101 0.306 imm1 0.171 ^0.095 mr0.108 110.020 EXIT r i. 000 ft ' tit 3: 1: Searching 2: Editing 3: Printing 4: Japanese Processing 5: Selecting Operation Way 6: Menu 7: Learning 8: Help 9: Online Manual 10: Command Definition 11: User Programming 12: Obstacle Countermeasure 13: Logging 14: Backup 15: Undo 16: Misoperation Check 17: File Conversion 18: Data Link 0.861 mtmmommu 0.440 mommommum 0.364 0.129 1.000 EXIT ^0.389 0.441 0.284 omm 0.101 ^ 0.048 mmmrrm 0.308 mme 0.142 0.400 mm>rrrrr 0.346 mmermm 0.344 m 0.120 OM 0.130 0.861 1: 2: 3: 4: 5: 8: 7: 8: 9: 10: 11: 12: 13: 14: 15: 16: 17: 18: Searching Editing Printing Japanese Processing Selecting Operation Way Menu Learning Help Online Manual Command Definition User Programming Obstacle Countermeasure Logging Backup Undo Misoperation Check File Conversion Data Link mormommommommommo0.809 mummommommommommo0.608 0.304 - 0.152 mmmr 0.231 mmilmmummorrr 0.480 ~rm 0.333 - 0.166 0.516 0.516 1.000 EXIT - 0.183 S0.061 •0.049 - 0.134 1111rrl1^ 0.366 MEI 0.062 mm 0.165
Figure 7 : Example of requirement contents in the early stage
REQUIREMENT ELEMENTS_--- 1: Many Functions~~~ 2: Processing Speed 3: Easy for Operation 4: Operation Guide 5: Easy to View 8: Misoperation Warning 7: Hard to Misoperate 8: Easy to Restart
9: Traceability of Trouble Cause 10: Easy for Data Restoration 11: Easy to Customize 12: Enable to Share data
WEIGHT VALUES 1im1m 0.200 immomommom 0.400 10.499 milmmm 0.314 - 0.198 1111110.555 mmnm 0.277 - 0.185 0.555 1.000 - 0.243 11E0.081 1: 2: 3: 4: 5: 8: 7: 8: 9: 10 11 REQUIREMENT ELEMENTS Many Functions Processing Speed Easy for Operation Operation Guide Easy to Viee Misoperation Warning Hard to Misoperate Easy to Restart
Traceability of Trouble Cause Easy for Data Restoration Easy to Customize Enable to Share data
EXIT REQUIPDENT ELEMENTS EXIT {EIGHT VALUES Eli 0.079 m 0.066 111111111.000 ~m111111~ 0.380 moon 0.217 0.499 mmmm^ 0.351 molim^ 0.479 - 0.190 m1 mememe n 0.503 nowimmoiiiiiimaNI 0.726 NI 0.062 REQUIRE?ENT EL DENTS 1: Searching 2: Editing 3: Printing 4: Japanese Processing 5: Selecting Operation Way 6: Menu 7: Learning 8: Help 9: Online Manual 10: Command Definition 11: User Programming 12: Obstacle Countermeasure 13: Logging 14: Backup 15: Undo 16: Misoperation Check 17: File Conversion 18: Data Link 0.889 mmmmmm1110.463 mmmrm 0.330 mm 0.137 moiree 0.745 memeem 0.376 0.489 11.000 mmmn 0.275 me 0.118 e0.067 mmmmm10.331 MONO 0.136 0.383 mmmmm 0.332 immommorm0.965 imm0.114 - 0.129 1: 2: 3: 4: 5: 8: 7: 8: 9: 10: 11: 12: 13: 14: 15: 16: 17: 18: Searching Editing Printing Japanese Processing Selecting Operation Way Menu Learning Help Online Manual Command Definition User Programming Obstacle Countermeasure Logging Backup Undo Misoperation Check File Conversion Data Link 10.856 mmrmum 0.438 - 0.312 me 0.200 11.000 0.417 10.433 mmmr 0.216 mmmm 0.281 - 0.281 mm111r1m11m1m 0.509 - 0.169 mmmommommim 0.509 mmmmmnmm 0.509 mummommommimm0.509 10.887 m10.093 111111111110.187 EXIT
Figure 8 : Example of requirement contents in the final stage
the original developer's requirement, and the right upper window denotes the developer's requirement
transformed into the dimension of user's requirement.
As a result of the tradeoff analysis operation, the consensus making was achieved to some extent, but
it didn't extend to the last satisfied condition. Therefore, their requirement structures have to be
reconsidered once again by using our requirement acquisition module. Then, after trying to operate
tradeoff analysis once again, the consensus making result was better than the last time. A result at
the final consensus making stage is shown in Figure 8. The requirement function analysis of software
development which reflects both the user's and the developer's requirements progresses in this way.
However, through more future cases, the objective and quantitative evaluation experiment on our
system is necessary.
As for qualitative evaluation, we confirmed some effectiveness of our system.
• Concerning with ease of constructing requirement structure
It is not easy to construct appropriate requirement structure in group decision-making because
its task needs expert knowledge and heavy loads. To reduce working loads and to operate
intelligibly for even if non-expert user, we provided a method that the whole requirements are
classified into subjective and objective requirement elements and each requirement structure is
constructed separately by using KJ method and AHP. We confirmed from the above example
that our system makes it easier to embody and refine requirement structure gradually and
creatively by interactive support fuctions.
• Concerning with equality between participants in consensus making process
because the user's requirement is not sufficiently reflected to the developer. From the above example, the user's requirement was aggressively reflected to the developer's side and consensus making progressed in the situation which the user and the developer are equal. At this point, our method is different mainly as compared with the conventional requirement analysis which the developer takes a leadership. One of the characteristics of our method is that requirement analysis which a user takes part in the planning directly can also be supported.
Conclusions
We proposed a new method of consensus making support for group decision problem solving. A
char-acteristic of our method is to integrate divergent thinking support functions and convergent thinking
support functions using KJ method, decision-making method, and QDA method. Our method can
deal especially with the cooperative work among the perticipants who have different senses of value
with each other. Two types of tradeoff analysis mechanism were designed and implemented for
con-sensus making. Through an example for concon-sensus making in case of software development, the way
to support both requirement acquisition and function requirement analysis between a user and a
developer was described. We provided a distributed environment to show the user and the developer
both of their requirements by transforming them into the dimension where they can interpret each
other's requirement. In other words, by using our system, the subjective evaluation of the user and
the objective evaluation of the developer can be connected mutually. With this, some latent
require-ment elerequire-ments can be discoverd newly and the reconsideration of the requirerequire-ment contents can be
done rationally. In this way, their consensus making process can be advanced with the bi-directional
repetitive transformation procedure.
References