Japan Advanced Institute of Science and Technology
JAIST Repository
https://dspace.jaist.ac.jp/Title
Mitigating the Spread of a Virus in the Internet
Author(s)
Nguyen, Thanh Dang; Bonnet, Francois; Defago,
Xavier
Citation
2014 IEEE 33rd International Symposium on
Reliable Distributed Systems Workshops (SRDSW):
14-19
Issue Date
2014-10
Type
Conference Paper
Text version
author
URL
http://hdl.handle.net/10119/12372
Rights
This is the author's version of the work.
Copyright (C) 2014 IEEE. 2014 IEEE 33rd
International Symposium on Reliable Distributed
Systems Workshops (SRDSW), 2014, 14-19. Personal
use of this material is permitted. Permission
from IEEE must be obtained for all other uses, in
any current or future media, including
reprinting/republishing this material for
advertising or promotional purposes, creating new
collective works, for resale or redistribution to
servers or lists, or reuse of any copyrighted
component of this work in other works.
Mitigating the Spread of a Virus in the Internet
Thanh Dang Nguyen, Franc¸ois Bonnet, and Xavier D´efago
School of Information Science
Japan Advanced Institute of Science and Technology (JAIST) 1-1 Asahidai, Nomi, Ishikawa Prefecture 923-1292, Japan +81 761-51-1111 {thanh, f-bonnet, defago}@jaist.ac.jp
Abstract—Virus is a traditional and serious threat of the Internet. The spread of a virus and the containment of the spread can be generalized in an abstraction of a two-side problem in which one side tries to spread the infection as much as possible while the other side tries to detect and limit the spread. Two parameters play an important role: (1) the probability of a successful infection, (2) the probability of a successful detection. The existing studies consider both sides of this problem separately. They either study the spread without detection or study the containment when detection is perfectly accurate.
A natural question that arises when attack can be detect but the detection may possibly be inaccurate, is whether it is possible to contain the spread and, if it is, then under what conditions?
This paper studies the two-side problem with defense strate-gies that can be grouped into two main classes; (1) Killing strategies, where a node decides to sacrifice itself and possibly deactivate some of its neighbors, and (2) Cutting strategies, where a node decides to cut or deactivate some communication links. Both classes aim at containing the epidemic by disconnecting infected nodes from healthy ones.
Keywords—Containment, epidemic, Internet, simulation, virus spread.
I. INTRODUCTION
Nowadays, our society is built over many kinds of overlay networks such as social networks, e-banking systems, health care sensor networks, ubiquitous network and cloud-based systems. All of these networks are built on the top of the Internet’s infrastructure. By itself, the Internet have been already vulnerable because it provides the facilities to the infection starting from some particular locations can quickly propagate and corrupt the whole network. Moreover, when a mechanism can attack different types of networks, due to their heterogeneity recovering from the attack is more difficult than usual. So, the planetary-scale systems based on the Internet are even more vulnerable because of not only their infrastructure but also their heterogeneity and complexity.
Following to the increasing impact of computer into the human life, many self-replicating computer viruses have been created. Among which, worm is the most serious threat of the Internet security. For example, CodeRed [1] and Nimda incidents of 2001 pointed out how vulnerable our Internet is and how fast a worms can propagate over it. More recently, Heartbleed problem in OpenSSH even introduces more serious problem in because of various kinds of devices and client using this protocol. In the scale of nations, vulnerable attack becomes a weapon in warfare between different countries. In the aspect of company, the infection occurring at a world-scale of big company can bring big threats to millions (even billions users).
The more heterogeneous and complex of a system is and the more difficult the defense against the virus attack to prevent a cascading failure is.
An interesting question that arises when all other mecha-nisms to defense a virus attack (such as increasing the detection ability, updating blacklist of compromised hosts and virus signatures) have been applied, the attack is still not detected correctly is if there is any mechanism to globally contain the spread of a virus? If it is, what condition is required?
Because it is unacceptable to create a real virus and study how it propagates in the Internet, we design a probabilistic model of virus spread against an imperfect virus detector. In this model, the Internet is abstracted by a connected undirected graph. This graph represents a snapshot of the Internet’s infrastructure collected by CAIDA project [2]. By simulation, we study the effect of different factors to the spread of a virus over the network of routers. It is interesting because at router level the human monitoring activities do not occur frequently. There have been already many researches investigate how to contain or quarantine the virus in different network envi-ronments [3]–[6]. In these works, the most common ways to stop the spread of virus are cutting communication links with the infected nodes (or suspect infected nodes) or scanning the communication content. Which are based on the assumption of a perfect detection: when a node detects the virus attack and transmits some information (on how to detect) to other nodes, these other nodes can always detect the attack (i.e. the successful rate of detection is 1). In general, most of anti-virus mechanisms aim to increase the accuracy of detection, and then use the accurate detection to contain the virus.
Upon detecting an infection attempt, there are two possible classes of reactions consisting of: cutting communication links carrying the infection in order to remove the material of spread; and letting a machine shutdown itself, in the hope that this will create a “fence” of deactivated nodes to isolate the infected nodes from the remaining sane ones. These strategies is motivated by the classical approach used by firefighters. It is formally defined in [7]–[9] as a combinatorial problem: a fire spreads in a graph and one must deploy firefighters to contain its spread. The goal is similar but results are usually developed in a centralized model. Under that strategy, what are the probabilities of infection and detection such that the propagation is contained and some nodes remain sane?
Contributions: In this paper, we present a study on the effect different factors (including infection rate, the location of initial infected node) to the opportunity of various reactions (grouped into deactivation (killing) of nodes and cutting
com-munication links) to contain the spread of virus on the Internet backbone and similar planetary-scale distributed systems.
Structure: The rest of the paper is structured as follows. Section II gives an overview of related work. Section III defines the model. In Section IV, we introduce the containment strategies. Section V presents the simulation settings and analyzes the simulation results. Finally, Section VI concludes the paper.
II. RELATED WORK
A. Biological viruses
Starting from the epidemiology in human community, much research has been conducted on propagation. The first mathematical models appeared in the 18th century, but modern models were essentially developed in the middle of the 20th century (e.g., [10]–[12]). While original models did not con-sider geographic distributions, more recent epidemic models consider geographic topologies, such as an infinite grid [13]). Epidemic threshold: Kephart and White [14] propose a birth-death model to study the spread of computer viruses in homogeneous sparse graphs and conclude that a pandemic oc-curs only when the infection rate exceeds a finite threshold that depends on the connectivity of the network (phase transition). They also extend their model to allow doing a virus scan [15]. B. Computer viruses
Threshold of the spread in computer network: Later, many works improve the results on the birth-death model and compute new epidemic thresholds for the virus in computer network. Pastor-Satorras and Vespignani [16], [17] look at the dynamics of epidemics in power-law scale free networks for which they find the critical threshold. Chakrabarti et al. [18] study an epidemic model with recovery and find that the propagation threshold is related to the eigenvalues of the adjacency matrix of the network. Lately, Van Mieghem et al. use mean field approximation to transform from individual random infection rates into an average infection rate [19], [20]. Their model is called N -intertwined Markov chain.
Modeling actual virus/worms: In another direction, after the propagation of Code Red in 2001, many researches look for the most accurate model to reflect the spread of different kinds of viruses in the Internet. They propose different models from the scanning worms [21]–[23] to the event-based worms [5], [6]. Here, the question is to predict, as accurately as possible, the evolution of the expected number of infected entities in the network after the virus starts propagating.
On defense against a virus propagation: There are many works studying how to contain or quarantine the virus or worms in different network environments [3]–[5]. The con-tainment strategies can be classified into two main classes; proactiveor reactive. In the first one, some nodes are initially immune to the virus and only other nodes can be infected. In the latter, all nodes are initially susceptible, but eventually any node may become immune if it detects the virus (or receive some informations from other nodes).
Moore et al. [3], propose a model for scanning worms in complete graph topology and give a comparison between
two reactive strategies; (1) blacklisting, upon detection of an infection, a node adds the attacker into a blacklist; and (2) filtering-content, upon detection of a virus, a node transmits its signature to all other nodes. They assume that when a node detects an infection, the information (blacklisted IP address, or virus’ signature) will be available to all other nodes after some time. They study the efficiency of both strategies when this delay varies. Under this model, filtering-content strategies perform better than blacklisting strategies.
Later, Zhou et al. [4] study the containment of worms in peer-to-peer network when an infected node randomly selects some of its neighbors to attack. Among the peers, some are proactively immune (called guardian nodes) and can detect any attack; the others are always infected (no chance of detection). With this model, by simulation of some classical peer-to-peer networks (Gnutella and KaZaA), they study the relationship between the final fraction of infected nodes and the fraction of guardian nodes. Not surprisingly, they found that choosing for guardians the nodes with a large number of neighbors helps to contain the infection.
Zou et al. [5] deeply analyze the existing models of computer viruses propagation and propose an event-based model to study the defense of email worms spread in three topologies power-law, small-world, random graph. They first show that mathematical models usually largely overestimate epidemic spreading speed, justifying the need of simulations. Moreover they also introduce and study two proactive strategies: (1) random immunization in which immune nodes are randomly chosen and (2) selective immunization where the p percents of most connected nodes are immunized.
In all these works, immune nodes are assumed to always detect virus attacks successfully. However, with a polymorphic (such as Sality [24]) or metamorphic virus, it may not always be possible to detect the virus correctly. In this context, several detectors are introduced in [25]–[27]. We call imperfect detec-tionthe ability to detect a virus but not always successfully. If we only have an imperfect detection, what could the network possibly do to mitigate the spread? The model proposed in this work aims to answer this question by looking at various levels of the detection probability.
III. MODEL ANDDEFINITIONS
The network is modeled by a connected undirected graph G = (V, E), where V is the set of vertices (also called nodes), and E is the set of edges. In this graph, an edge eij ∈ E
represents a communication link between the two network nodes i, j ∈ V .
The network is synchronous and communication happens in rounds, also called timeslot. Starting from timeslot t = 1 with one node is infected by the virus. Then, in each timeslot, the virus can propagate from infected nodes to their neighbors via communication links.
A. States of nodes
A node can be in one of four states: (1) infected: the node is compromised by the virus and acts as an infectious agent, (2) killed: the node no longer sends or receives any message, (3) susceptible: the node is neither infected nor killed, but can
still be affected in the future, or (4) sane: the node was still susceptible after the spread has completely stopped.
The model does not consider recovery mechanisms; hence when a node is infected, killed, or sane; it is a permanent state. At the end of an execution, there are no more susceptible nodes. Either the entire system is infected, or it is partitioned by killed nodes into infected and sane components. As stated in the introduction, the goal is to contain the spread and possibly maximize the number of sane nodes.
B. States of edges
At any time, an edge is in one of the following two states; active or cut. The state of edge e at the end of timeslot t is denoted by se(t) with se(t) ∈ {active, cut }. An edge is
considered cut, when one (or both) of its extremities decides to stop using the corresponding communication link.
The state se(t) of edge e at the end of timeslot t also
corresponds to the state of e at the beginning of timeslot t + 1. Initially, all edges are active.
C. Virus propagation
Initially (t = 1), all nodes are susceptible, except for a single node which is initially infected. Then, at each timeslot, the virus can propagate via active communication links, from every infected nodes to its susceptible neighbors.
Let p be a parameter of the system denoting the in-fection probability. At each round, an infected node attacks and attempts to infect each of its susceptible neighbors. For each attack, the susceptible node targeted is infected with probability p. Conversely, with probability 1 − p, the node detects the attack, in which case it starts a containment strategy. Consider a virus propagation in real world, if virus has a set of different ways to attack different nodes, p can be bounded by the most successful way of attack.
IV. CONTAINMENT STRATEGIES
This paper studies the possible actions that a susceptible node can take when it detects an infectious attack. In the following, we call a detector a node that detects an attack. The local virus detection mechanism is considered as blackbox with the imperfect ability to detect a virus. We propose two families of strategies a detector can follow to mitigate the spread. A. Killing strategies
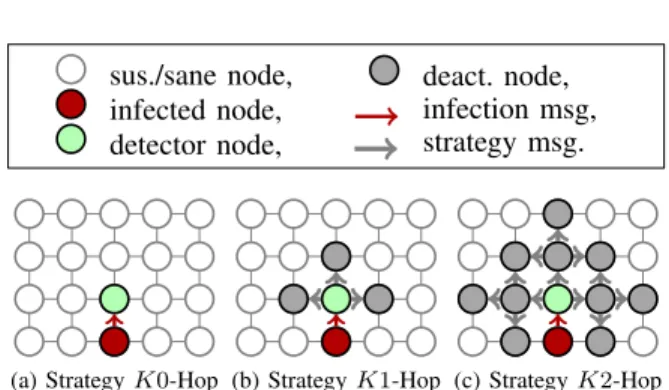
Firstly, we propose a family of killing strategies that differ in the number of nodes that are deactivated/killed. For all strategies, the detector deactivates itself, and in addition to its own sacrifice, it tries to deactivate its neighbors up to a given hop count. The three main strategies are K0-Hop, K1-Hop, and K2-Hop but it can easily be generalized up to Kx-Hop.
In order to deactivate its neighbors, the detector sends deactivation messages. The behavior of a node receiving such a message depends on its current state:
• A susceptible node sacrifices itself as requested by the message, after having potentially forwarded the message as requested by the strategy.
• An infected node ignores the message; it does not forward the message and does not sacrifice itself. • A deactivated node does not receive the message; it does
not forward the message and is already deactivated.
sus./sane node, infected node, detector node, deact. node, infection msg, strategy msg.
(a) Strategy K0-Hop (b) Strategy K1-Hop (c) Strategy K2-Hop Fig. 1. Representation (in a grid) of the three killing strategies
The Figure 1 represents the three main killing strategies on a grid topology (for simplicity). The green node detects the infection from the red node and tries to deactivate all gray nodes. One should note that these deactivations are not always successful (see example of Figure 2).
(a) Timeslot t − 1 (b) Timeslot t (c) Timeslot t + 1
(d) Timeslot t + 2 (e) Timeslot t + 3 (f) Timeslot t + 4 Fig. 2. Example of an execution of the strategy K1-Hop
Figure 2 depicts a step-by-step execution of strategy K1-Hop in a 3 × 5 grid. An infected node attacks its neighbors at timeslot t; the top and the left neighbor detect the attack, the right one becomes infected. Following strategy K1-Hop, the top and the left neighbor (detector) send deactivation messages to their own neighbors and deactivates themselves; two neighbors (top and left) of each detector react accordingly, but the right neighbors of the top detector ignores it because it was infected in the meantime. In contrast, during timeslot t+2, a node deactivates itself after receiving both a deactivation and an infected message. The execution stops at t + 4 when the network is partitioned and the spread is contained.
B. Cutting strategies
Another studied strategy is called cutting strategy C0. By this strategy, upon detecting the attack, the detector decides to cut only the link carrying the infection. Strategy C0 is different to strategy K0-Hop, which is equivalent to cutting strategy that disconnects all communication links to detector’s neighbors.
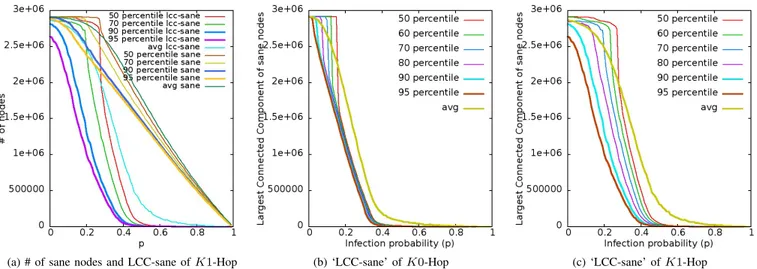
(a) # of sane nodes and LCC-sane of K1-Hop (b) ‘LCC-sane’ of K0-Hop (c) ‘LCC-sane’ of K1-Hop Fig. 3. The comparison of metrics when infection starts from a ‘high-degree’ node
V. SIMULATION ANDANALYSIS
A. Simulation settings
CAIDA Topology: This paper focuses on a real network given by the IPv4 Internet topology collected by CAIDA project. We consider the network topology at router level in which a node in network represents to a router in the Internet. The topology consists of about 3 millions IPv4 routers. Among which, the highest node degree is about 13 thousand, there are more than 55 thousand nodes that have degree greater than 50. We call these nodes ‘high-degree’ nodes. On the other hand, there are more than 2 millions nodes with degree smaller than 3 among which more than 1.5 millions nodes have degree 1. We designate nodes having degree smaller than 3 as ‘low-degree’ nodes.
Simulator: We wrote a discrete simulation in C++ to study our containment strategies over the CAIDA topology. Each simulation running starts with an arbitrary infected node at timeslot 0. In the next round, it starts the spread by attacking all its neighbors. At the end of the spread, we measure the number of infected, sacrificed, sane nodes and the largest connected component of sane nodes (LCC-sane). The probability of infection p and the probability of detection q are changed from 0 to 1 by 0.01 steps. The results are stated at the 95% confidence interval level for absolute value.
Because of the wide variance of the degree of nodes, we analyze the difference when the infection starting from a ‘low-degree’ node and from a ‘high-‘low-degree’ node.
B. Choice of a metric
Figure 3a shows the performance of strategy K1-Hop in term of the number of sane nodes and the largest connected component of sane nodes (LCC-sane) at the end of the propa-gation starting from a ‘high-degree’ node. The number of sane nodes is much greater than the largest connected component. It means that there are many small independent components as islands when the number of ‘low-degree’ nodes is large. There are several reasons. Firstly, with the large number of low-degree nodes, there is a high probability to have the case
in which the deactivation of a high-degree node makes all low-degree neighbors that are still alive but disconnected to each other. Secondly, when there is a ‘high-degree’ infected node connecting to many nodes having degree 1, the probability of any of its neighbor to be infected linearly depends on the infection probability of each attack. Therefore, the number of sane nodes is not an exact metric to evaluate the performance of strategies at then end of the virus propagation. And we use the largest connected component of sane nodes (LCC-sane) to analyze the performance of different containment strategies.
Moreover, Figure 3b, 3c show the wide variant distribution of ‘LCC-sane’. Hence, the average of ‘LCC-sane’ does not re-flect correctly the performance of strategy. The greater number of hops is deactivated, the wider variance of data is. In order to increase the reliability of the system evaluation, we consider the 90th-percentile and 95th-percentile of data generated by 40, 000 times of running the simulation. The value of each percentile is stated at the level of 95% confidence interval. C. Effect on virus propagation
Figure 4 presents the performance comparison of four strategies K0-Hop, K1-Hop, K2-Hop and C0 against the virus propagation in Caida in both cases when the infection starts from a ‘low-degree’ and ‘high-degree’ node. According to that Figure, the only place having a large confidence interval is at the epidemic threshold.
An epidemic threshold exists: We can see that, in both cases, there is an epidemic threshold where ‘LCC-sane’ is sharply decreased when the infection probability is increased. The threshold is less clear when the infection starts with ‘high-degree’ node. The reason is that as soon as there are some infected nodes and detectors; a large number of nodes and links will be killed or cut by containment strategies. Therefore, when the infection probability is small, the infection starting from ‘low-degree’ is less harmful than the infection starting from ‘high-degree’ node. But when the infection probability increases, the consequences in both cases are similar.
Cutting strategies are ineffective in containing the spread: In other works [3]–[5], the most common strategy is used to
90th percentile 95th percentile
(a) Infection starts with a ‘low-degree’ node
90th percentile 95th percentile
(b) Infection starts with a ‘high-degree’ node Fig. 4. The comparison of different strategies on LCC-sane
mitigate virus propagation are blacklisting or cutting commu-nication links with infected nodes, which is similar to strategy C0 in this paper. Surprisingly, it is shown that not effective to contain the virus propagation. In other words, blacklisting is not enough to prevent the propagation of virus. Deactivating the detector and its neighbors is more effective than cutting the link carrying the infection.
Killing more than1-Hop is pointless: In contrast, due to the small diameter of Caida, increasing the number of killed hop up to 2 does not bring benefit in isolating the virus spread. In fact, it kills too much nodes of the network. Figure 4b shows that when the infection starts from ‘high-degree’ node, K2-Hop strategy kills more than a half of network nodes even the infection probability is around 0. When the infection starts from ‘low-degree’ node, according to Figure 4a, the number of killed nodes is reduced but still a lot when compared with other strategies. Therefore, in the Internet, we can strictly limit the killing hop less than or equal to 1 in order to prevent the attack exploiting the killing strategy to do DoS attack.
Killing detector itself effective with small infection prob-ability: When the infection probability is small, by saving a larger connected component at the end of spread, strategy K0-Hop is better than cutting strategies and K1-K0-Hop. However, the difference between K0-Hop and K1-Hop is not so significant as the different with cutting strategies.
Killing1-Hop neighbors is effective with greater infection probability: Figure 4 shows that from the infection proba-bility 0.2 with the infection starting ‘low-degree’ node and 0.05 with the infection starting from ‘high-degree’ node, the ‘LCC-sane’ of K0-Hop sharply decreases. While K1-Hop can still maintain a larger connected component of sane nodes. Interestingly, the difference between two strategies is more significant when the infection starting from the ‘low-degree’ node. It means that K1-Hop strategy helps to mitigate the virus propagation by shifting the propagation threshold to higher infection probability.
Therefore, the benefit of using K1-Hop strategy is clearer than the benefit of using K0-Hop strategy. This advantage of K1-Hop is less significant when we consider the infection starting from ‘high-degree’ node with 95th percentile of data.
VI. CONCLUSION
We have studied at the last line of virus defense the propagation of a virus against an imperfect virus detector over Caida and how local strategies can help contain this propagation to prevent a cascading failure.
After verifying the existence of a threshold and a phase transition for all strategies, we analyze the effect of different factors on the choice of an effective strategy to shift that threshold to higher infection rate.
Surprisingly, we find that cutting communication links with infected nodes are not enough to isolate the infection. It is better to deactivate the node that detects the attack and also its directed neighbors. On the other hand, killing more than 1-hop neighbors of detector is pointless because of the small diameter of Caida topology. Killing up to 1-hop neighbors of detector helps to mitigate the virus spread. In general, K1-Hop brings more significant benefit than K0-Hop.
The starting point of infection affects to the chance to mitigate it. The infection starting from a ‘low-degree’ node is less harmful to the network than the one starting from ‘high-degree’ node when infection probability is small. However, when the infection probability increases, the effects are similar in both cases.
The containment can be achieved only for a small in-fection probability. Therefore, the system is necessarily well constructed to increase the detection ability of virus. After all, the mitigating strategies based on deactivating neighbors around the detector node should be consider to tolerate the failure caused by the incompetence of the virus detection.
The tolerance to incompetence fault of a virus attack is concerned when several classes of smart viruses in real systems are introduced. These viruses have a wide range of different attack mechanisms or can always evolve to change the virus signature (such as polymorphic virus) such that the virus detector becomes unreliable quickly. Our model aims to model such kinds of viruses. When the virus detection cannot always detect the signature; it leads to a probabilistic model of infection and detection. With the virus having the wide range of attack, the infection probability can be bounded by the successful rate of the strongest attack. In reality, we can
use multiple detection mechanisms at different defense layers, the first layer is the weakest mechanism, and the final layer is the strongest mechanism. When a virus can attack the weaker layer, the stronger inner layer that detects the attack can know the strength of the virus. Therefore, detector node will decide whether any strategy should be used to mitigate that virus.
REFERENCES
[1] D. Moore, C. Shannon, and J. Brown, “Code-red: a case study on the spread and victims of an internet worm,” in Internet Measurement Workshop (IMW) 2002. Marseille, France: ACM SIGCOMM/USENIX Internet Measurement Workshop, Nov 2002, pp. 273–284.
[2] CAIDA, “Ipv4 routed dataset,” http://data.caida.org/datasets/topology/ ark/ipv4/, Feb. 2014.
[3] D. Moore, C. Shannon, G. Voelker, and S. Savage, “Internet quarantine: requirements for containing self-propagating code,” in Proceedings of the 22nd Annual Joint Conference of the IEEE Computer and Commu-nications Societies (INFOCOM’03), vol. 3, Mar. 2003, pp. 1901–1910. [4] L. Zhou, L. Zhang, F. McSherry, N. Immorlica, M. Costa, and S. Chien, “A first look at peer-to-peer worms: Threats and defenses,” in Pro-ceedings of the 4th International Conference on Peer-to-Peer Systems (IPTPS’05). Berlin, Heidelberg: Springer-Verlag, 2005, pp. 24–35. [5] C. Zou, D. Towsley, and W. Gong, “Modeling and simulation study
of the propagation and defense of internet e-mail worms,” IEEE Transactions on Dependable and Secure Computing, vol. 4, no. 2, pp. 105–118, Apr. 2007.
[6] W. Xu, F. Zhang, and S. Zhu, “Toward worm detection in online social networks,” in Proceedings of the 26th Annual Computer Security Applications Conference (ACSAC’10), Dec. 2010.
[7] B. Hartnell, “Firefighter! an application of domination, presentation,” in 20th Conference on Numerical Mathematics and Computing, 1995. [8] P. Fogarty, “Catching the fire on grids,” Master’s thesis, Department of
Mathematics, University of Vermont, 2003.
[9] M. E. Messinger, “Average firefighting on infinite grids,” Australian journal of Combinatorics, vol. 41, pp. 15–28, 2008.
[10] W. O. Kermack and A. G. McKendrick, “A Contribution to the Mathematical Theory of Epidemics,” Proceedings of the Royal Society of London. Series A, vol. 115, no. 772, pp. 700–721, Aug. 1927. [11] R. M. Anderson and R. M. May, “Population biology of infectious
diseases: Part i.” Nature, vol. 280, no. 5721, pp. 361–367, Aug. 1979. [12] R. M. May and R. M. Anderson, “Population biology of infectious diseases: Part ii.” Nature, vol. 280, no. 5722, pp. 455–461, Aug. 1979. [13] P. Grassberger, “On the critical behavior of the general epidemic process and dynamical percolation,” Mathematical Biosciences, vol. 63, no. 2, pp. 157–172, Apr. 1983.
[14] J. O. Kephart and S. R. White, “Directed-graph epidemiological models of computer viruses,” in Proceedings of the 12th IEEE Symposium on Security and Privacy (S&P’91), 1991, pp. 343–361.
[15] ——, “Measuring and modeling computer virus prevalence,” in Pro-ceedings of the 14th IEEE Symposium on Security and Privacy (S&P’93), 1993, pp. 2–15.
[16] R. Pastor-Satorras and A. Vespignani, “Epidemic dynamics and endemic states in complex networks,” Physical Review E, vol. 63, no. 6, pp. 066 117–1–8, 2001.
[17] ——, “Epidemic spreading in scale-free networks,” Physical Review Letters, vol. 86, pp. 3200–3203, Apr. 2001.
[18] D. Chakrabarti, Y. Wang, C. Wang, J. Leskovec, and C. Faloutsos, “Epi-demic thresholds in real networks,” ACM Transactions on Information and System Security, vol. 10, no. 4, 2008.
[19] P. Van Mieghem, J. Omic, and R. E. Kooij, “Virus spread in networks,” IEEE/ACM Transactions on Networking, vol. 17, no. 1, pp. 1–14, 2009. [20] P. Van Mieghem, “The N -intertwined SIS epidemic network model,”
Computing, vol. 93, no. 2-4, pp. 147–169, Dec. 2011.
[21] S. Staniford, V. Paxson, and N. Weaver, “How to own the internet in your spare time,” in Proceedings of the 11th USENIX Security Symposium (USENIX-Security’02). Berkeley, CA, USA: USENIX Association, Aug. 2002, pp. 149–167.
[22] J. Xia, S. Vangala, J. Wu, L. Gao, and K. Kwiat, “Effective worm detection for various scan techniques,” Journal of Computer Security, vol. 14, no. 4, pp. 359–387, Jul. 2006.
[23] C. C. Zou, W. Gong, and D. Towsley, “Code red worm propagation modeling and analysis,” in Proceedings of the 9th ACM Conference on Computer and Communications Security (CCS’02). New York, NY, USA: ACM, 2002, pp. 138–147.
[24] N. Falliere, “Sality: Story of a peer-to-peer viral network,” http://www.symantec.com/connect/sites/default/files/sality peer to peer viral network.pdf, Jul. 2011.
[25] C. Kruegel, E. Kirda, D. Mutz, W. Robertson, and G. Vigna, “Poly-morphic worm detection using structural information of executables,” in Proceedings of the 8th International Conference on Recent Advances in Intrusion Detection (RAID’05). Berlin, Heidelberg: Springer-Verlag, Sep. 2006, pp. 207–226.
[26] D. Brumley, J. Newsome, D. Song, H. Wang, and S. Jha, “Towards automatic generation of vulnerability-based signatures,” in Proceedings of the 27th IEEE Symposium on Security and Privacy (S&P’06), May 2006, pp. 2–16.
[27] Z. Li, M. Sanghi, Y. Chen, M.-Y. Kao, and B. Chavez, “Hamsa: fast signature generation for zero-day polymorphic worms with provable attack resilience,” in Proceedings of the 27th IEEE Symposium on Security and Privacy (S&P’06), May 2006, pp. 32–47.